Trend research tools: rankings and buying guide for 2026
 By Jan Suski. I go deep on every review, checking every number against its source and digging up details other coverage misses, a habit from six years of SEO and link building for tech companies. Bylines at Surfer, Brand24, and Senuto. How the scoring works.
· Prefer this source on Google
Quick comparison of the best trend research tools
Primary signal names the data type each tool leads with, and starting price runs from free to a paid monthly plan, or comes bundled into a broader subscription.
| # | Tool | Best for | Primary signal | Starting price | Primary buyer |
|---|---|---|---|---|---|
| 1 | Exploding Topics | Early topic and product detection | Search, social, ecommerce growth curves | $39/mo | Marketing, ecommerce, investing teams |
| 2 | Glimpse | Absolute search-volume context | Google Trends augmentation | Free-$500+/mo | SEO, content, product researchers |
| 3 | Trend Hunter | Innovation and pattern libraries | Published trend reports | $199/mo (PRO) | Innovation and strategy teams |
| 4 | Google Trends | Free baseline search interest | Relative search interest | Free | Analysts, content teams, founders |
| 5 | Semrush Trends | Trend plus competitor context | Traffic, market share, audience overlap | Included in Semrush plans | Digital marketing and research teams |
Trend research tools, also called trend analysis tools, turn search, social, and ecommerce signal into an early read on what's about to grow, before a topic shows up in mainstream search volume. This guide ranks five trend analysis tools against five evaluation criteria, explains why each landed where it did, and gives a full features, pricing, pros, and cons breakdown for each, then covers how to validate a signal before acting on it.
Market research teams run trend analysis for a reason: spotting a shift a quarter before a competitor does beats a polished market research report after the fact. Spotting the shift first keeps a team ahead of the curve while competitors still work off last quarter's numbers. Market analysis, market trend analysis, and plain trend tracking all describe pieces of the same discipline, and the five tools in this ranking split that work differently.
Some run the data analysis in-house; others hand back raw data points and expect a human analyst to interpret them.
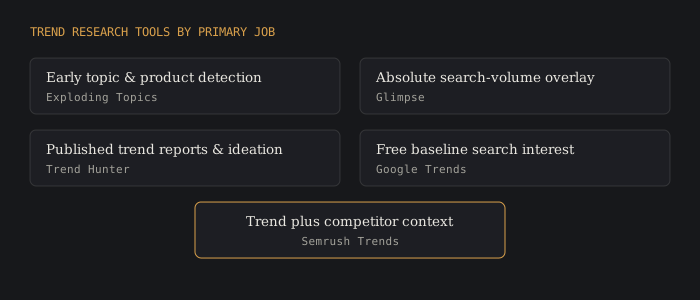
These aren't interchangeable. Exploding Topics leads on early detection before mainstream search volume exists, Google Trends is the free baseline every other tool gets compared against, and Semrush Trends is the pick when a trend question overlaps with competitor and market-share analysis. Matching the tool to the decision it needs to support, content, product, or investment, is the point of this guide.
Why trend research matters now
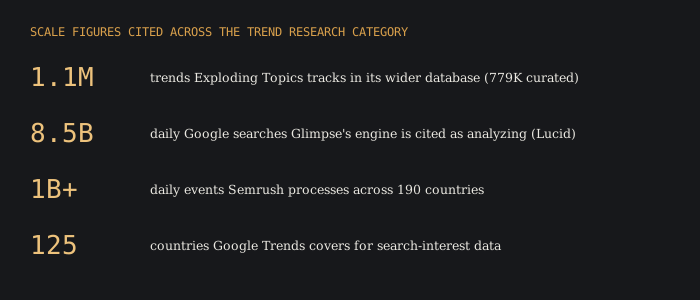
A trend spotted after it peaks is a missed cycle. The value in this category comes entirely from lead time: Exploding Topics is built to surface a topic 12 or more months before it goes mainstream, tracking more than 1.1 million trends in its wider database and maintaining a curated set of over 779,000 emerging topics and trending products, filtered specifically to exclude terms the internet already knows about.
A spike in search interest can be a real shift or a one-week fad, unconfirmed until validated. Every tool in this ranking handles that distinction differently, some through machine-learning-plus-human-curation, some by leaving validation entirely to the analyst reading the chart. The jury's still out on that distinction until a second source confirms the signal.
Market research has always tried to identify trends before they mature, but traditional market research runs on a cycle measured in weeks. Our own market research report template remains useful for the slower-moving picture, industry trends and market dynamics rarely shift month to month, but they cannot replace a live feed built to identify emerging trends or catch customer behavior and consumer behavior shifts as they happen.
Growth trends, market trends, and business and market trends all get discussed as if they were one thing, but tracking trends at the search-and-social layer this ranking covers is different from tracking trends in quarterly revenue. Marketing strategies built on the wrong layer waste budget chasing a signal that was never going to convert.
Scale varies enormously across the category, and that scale is part of what each tool is selling. Industry analysis cited by Lucid puts Glimpse's engine at analyzing 8.5 billion daily Google searches, with reported demand-trend predictions up to 12 months in advance; the same research puts Semrush processing more than 1 billion daily events across 190 countries.
Neither figure is independently audited, but both illustrate why a manual spreadsheet can't compete with the category's underlying data volume. A hand-built spreadsheet tracking a handful of keywords is a drop in the bucket next to that kind of daily volume.
Evaluation criteria for the best trend research tools
Five factors separate a tool that catches a real shift early from one that just re-displays search volume.
- Early-signal detection. Does the tool surface a topic while it's still small, or only after it's already visible in mainstream search data.
- Source transparency. Can you see where a trend signal comes from, search, social, ecommerce, or a published report, and judge its reliability yourself.
- Category filters and historical context. Ability to browse by industry, growth rate, and time window.
- Validation and curation quality. If spikes get filtered for noise (human review, cross-referencing) before they reach the user.
- Pricing transparency and fit for the decision. Published starting points, and if the tool serves a content/product decision or a broader market-strategy one.
Pilot the top two or three candidates against a trend your team already validated independently before committing budget. Detection timing and noise level only show up once a tool is tested against a known outcome.
Getting these five factors right is what separates trend analysis tools a team trusts from ones that just add noise. AI-powered scoring helps identify patterns faster than a person scanning a spreadsheet by hand, but interpreting the data still takes someone who understands the target audience a finding is meant to serve. Growth strategies built on an unvalidated spike are not a competitive edge; they are a guess with a chart attached.
Acting on that guess before it's checked is jumping the gun.
The statistical techniques underneath these tools vary by vendor, but the goal stays the same: turn raw signal into data-driven decisions. A hunch doesn't need that pipeline. Record labels run the same loop on playlist and streaming data, using the music data platforms covered in our music industry statistics report.
Top trend research tools, ranked
Five tools, ranked by how completely they cover the five criteria above, with the reasoning behind each position plus a full features, pricing, pros, and cons breakdown.
Exploding Topics
·top pick·Early topic and product detection built to surface a trend before it shows up in mainstream search volume.
Exploding Topics was founded by Brian Dean and Josh Howarth and is now owned by Semrush. It tracks more than 1.1 million trends in its wider database and maintains a curated set of over 779,000 emerging topics and trending products, screening out established keywords the internet already knows about.
Why it's ranked #1. Exploding Topics wins the early-signal-detection criterion outright: it's purpose-built to find a topic 12-plus months before mainstream visibility, using machine learning to flag rising keywords and human analysts to curate what ships to the feed.
That combination gets the ball rolling on a trend long before it shows up anywhere else. Trend Hunter has a larger published-report library, but it doesn't detect a rising signal from raw data the way Exploding Topics does.
Features
- Trends database filterable by category, growth rate, and date range.
- Trend Search for checking any specific keyword on demand, plus saved Projects with weekly reports.
- Meta Trends that group related rising keywords into one larger consumer shift.
- Trending Products and Trending Startups feeds, filterable by price range and growth, for investors and operators tracking product intelligence alongside search signal.
Pricing
Plans start at $39 a month, scaling up through Pro and Investor tiers that add trending-products/startups feeds and forecasting.
Pros
- Purpose-built for lead time: 12-plus months ahead of mainstream visibility.
- Curated database (779,000-plus topics) filters noise a raw search-volume tool won't.
- Trending products and startups feeds serve investors as well as content teams.
Cons
- Early signal still needs independent validation before a real budget commitment.
- Higher tiers (Pro, Investor) required for the trending-products and forecast features.
- Now a Semrush property, so its roadmap is tied to Semrush's broader product direction.
Glimpse
A Google Trends extension that adds absolute search volume and growth rate to relative interest data.
Glimpse, released as a browser extension in February 2022, layers absolute search volume, growth rates, and additional context onto Google Trends' relative interest charts. Industry analysis cites its underlying engine as analyzing 8.5 billion daily Google searches, with reported demand-trend predictions reaching up to 12 months in advance.
Why it's ranked #2. Glimpse ranks second because it directly fixes Google Trends' biggest limitation, relative-only data, without requiring a switch away from the free tool teams already use.
For a team already living inside Google Trends, that pairing offers the best of both worlds, a familiar interface with real volume added underneath it. It ranks below Exploding Topics because it's an augmentation layer on existing search data. Nothing here finds signal outside of search.
Features
- Absolute search volume layered directly onto Google Trends charts.
- Growth-rate calculations showing momentum on top of relative interest.
- Browser-extension delivery, so it works inside the Google Trends interface teams already use.
- Free tier available alongside paid plans for higher usage.
Pricing
Pricing runs from a free tier up to roughly $50 a month for casual use, scaling to $500-plus a month for enterprise usage.
Pros
- Fixes Google Trends' relative-data limitation without leaving the interface.
- Free tier lowers the bar to try it before paying anything.
- Growth-rate view and reported 12-month-ahead demand predictions surface momentum a flat relative chart hides.
Cons
- Still inherits Google Trends' underlying data, search demand differs from purchase demand.
- Enterprise tier pricing (~$500-plus/mo) is a large jump from the casual tier.
- No independent trend-discovery database of its own. It's an overlay on someone else's.
Trend Hunter
The largest published library of consumer-trend reports and innovation examples, built for ideation over raw signal detection.
Trend Hunter, founded in 2005, has grown a weekly newsletter with 90,343 subscribers and a social following of 3.5 million; its PRO plan runs $199 a month per user billed annually. Two decades of published trend calls means the team knows the ropes of turning a raw signal into something readable.
Weekly newsletter subscribers Trend Hunter reports, alongside a social following of 3.5 million, built since its 2005 founding.
Why it's ranked #3. Trend Hunter ranks third because it wins on breadth of published, human-written trend analysis and category patterns, useful for ideation, but it ranks below Exploding Topics and Glimpse on the early-signal-detection criterion: it curates and publishes trend reports after a topic already has coverage elsewhere.
Features
- A published library of trend reports and innovation examples across categories.
- PRO research tier with custom trend reports for specific client questions.
- Weekly newsletter reaching over 90,000 subscribers.
- Pattern libraries useful for structured ideation sessions.
Pricing
The PRO plan runs $199 a month per user billed annually (down from a $324 list rate); custom research and reports are quoted separately.
Pros
- Nearly two decades of published trend-report history (founded 2005).
- Large audience (90,343 newsletter subscribers, 3.5M social followers) as a proof point of reach.
- Human-written analysis and pattern libraries suit ideation as well as raw numbers.
Cons
- Use as ideation plus validation. Checking a trend against your own data still comes after.
- Published reports lag a genuinely early raw-data signal by definition.
- Per-user annual billing on PRO adds up for a multi-person team.
Google Trends
The free baseline for search interest that every other tool in this ranking gets compared against.
Google Trends reports relative search interest by topic, geography, and time period, drawn directly from Google's own search data, at no cost. Industry research puts its coverage at search interest across 125 countries, with data reported to update roughly every 10 minutes. For a team where money doesn't grow on trees, a zero-cost baseline like this matters before any paid tool enters the conversation.
That zero-cost status is why Google Trends also anchors our free market analysis tools ranking.
Roughly how often Google Trends data is reported to refresh, across search interest coverage in 125 countries, at no cost.
Why it's ranked #4. Google Trends ranks fourth because it's free and universally available, the baseline criterion every analyst starts from, but it loses ground on category filters, curation, and absolute-volume context, which is exactly the gap Glimpse and Exploding Topics are built to close.
Features
- Relative search interest by topic, comparing up to five terms at once.
- Geographic breakdown across 125 countries, down to the regional and city level in many markets.
- Time-window comparison from the past hour to multi-year history, with data reported to refresh roughly every 10 minutes.
- Related queries and rising-topics panels for adjacent search behavior.
Pricing
Free, with no paid tier; Google does not monetize Trends directly.
Pros
- Free and instantly available, no account or trial required.
- Directly sourced from Google's own search data across 125 countries, with no modelling in between.
- Universal starting point every other trend tool in this ranking is compared against.
Cons
- Relative-only data needs careful interpretation; it shows interest without volume attached.
- No category-level curation or noise filtering; every spike is presented equally.
- Search demand differs from purchase demand, a gap Google Trends doesn't distinguish on its own.
Semrush Trends
Trend research folded into a broader competitor and market-share analysis platform.
Semrush's .Trends module extends the platform from single-site SEO into market-level analysis: industry traffic trends, market share by domain, audience overlap, and demand shifts by category. Industry research cites the broader Semrush platform as processing more than 1 billion daily events across 190 countries.
Why it's ranked #5. Semrush Trends ranks last for pure trend research because it's the least purpose-built of the five for early-signal detection specifically, it's a module inside a much broader SEO and competitive-intelligence platform. It ranks here at all because for a digital marketing team already paying for Semrush, the trend view arrives bundled with competitor context none of the other four tools provide.
For that kind of team, the trend view kills two birds with one stone, pairing competitor context with trend detection in the same login.
Features
- Industry traffic trends and demand shifts by category.
- Market share by domain, showing which competitors are gaining or losing search visibility.
- Audience overlap analysis across competing sites.
- Direct integration with the rest of the Semrush SEO and competitive toolkit, reported to process over 1 billion daily events across 190 countries.
Pricing
Included as a module (.Trends) inside Semrush's broader subscription plans, which start at $139.95 a month on classic Pro; it is not sold as a standalone product.
Semrush Trends can't be bought on its own. Budgeting for it means budgeting for the full Semrush Pro subscription at $139.95 a month minimum, if a team uses the rest of the platform.
Pros
- Trend data arrives alongside competitor and market-share context in the same platform.
- No separate subscription needed for a team already running Semrush.
- Useful when a trend question is a competitive-positioning question.
Cons
- Not purpose-built for early detection; it's a market-analysis module doing trend detection on the side.
- Requires a broader Semrush subscription.
- Best suited to digital categories; weaker fit for physical-product or offline consumer trends.
Trend research across industries
The same underlying discipline, spotting a durable shift before it's obvious, gets applied differently depending on the sector reading the chart.
Retail and ecommerce teams use trend analysis mainly for demand forecasting: which product categories to stock ahead of a season, and which are already fading. Getting that call right means reading the room on a fading category before committing warehouse space to it. Healthcare organizations run a parallel discipline for a different purpose, tracking case-count trends to catch a disease-outbreak pattern early.
Finance teams apply the same statistical toolkit, time-series and regression analysis, to forecast market movements and screen investment opportunities before a broader market catches on.
The tools in this ranking sit mostly on the consumer and marketing side of that spectrum, Exploding Topics for product and content signal, Semrush Trends for competitive and traffic signal, but the underlying validation discipline, cross-checking a spike against independent data before acting, holds regardless of which industry is running the analysis.
Marketing teams lean on the same signal for content strategy and marketing campaigns: a rising search trend or a spike in social media posts tells a content calendar what to cover before a rival's content strategy gets there first, and the same signal feeds the sales intelligence stack a rep uses to time outreach.
Retail teams watch market share and market saturation together, since a category near saturation rewards a different pricing strategy than one still growing.
Finance teams read the same charts differently. Revenue trends, sales trends, and financial performance sit next to consumer sentiment and regulatory shifts in a quarterly review, and financial data pulled from a trend tool earns its keep only once it is checked against a company's own numbers before anyone treats it as a forecast. Getting that number straight from the horse's mouth, the company's own filings, turns a chart into a forecast worth trusting.
Performance metrics and the latest trends in a category both feed the same competitor analysis and competitive analysis exercise: what a rival is doing differently, and how fast, and both depend on social media monitoring alongside search and ecommerce signal.
Common mistakes when acting on a trend signal
Two metrics moving together does not mean one is driving the other. Confirm a mechanism as well as a correlation before a rising trend signal drives a real budget decision.
The most common failure isn't missing a trend, it's mistaking correlation for causation: two metrics moving together doesn't mean one is driving the other, and a team that skips this check ends up chasing a signal that was never connected to the decision they made against it.
A close second is overextrapolating a short-term spike into a long-term forecast, treating three good weeks as if they were a full market shift, particularly in categories where conditions change fast enough that last quarter's pattern doesn't hold this quarter. Three good weeks can turn out to be a flash in the pan.
Insufficient historical depth causes a subtler problem in genuinely new or emerging categories: a tool with only a year of data can't distinguish a seasonal pattern from a one-time event, which is exactly why cross-referencing a rising signal against a second, independent data source, sales data, customer interviews, or a competitor's own public numbers, matters more in a new category than an established one.
Data collection, historical data, and methods of trend analysis
Stable metric definitions and naming conventions matter before comparing any two trend sources: a "mention" counted on social platforms and a "search" counted on Google measure two distinct units. Centralizing source connectors into one ingestion pipeline keeps time intervals consistent and makes an audit possible if a number looks wrong six months later.
Storing raw time-series snapshots underneath the rolled-up chart is what lets a team re-run an analysis after a metric definition changes, a detail that gets skipped until the first time someone needs to explain why last quarter's numbers don't match this quarter's methodology.
Underneath the tools sit a handful of established methods worth knowing regardless of which platform runs them: time-series and regression analysis for quantitative pattern detection, desk research for a fast qualitative first pass, the Delphi method for gathering structured expert opinion when data is thin, and straightforward surveys for capturing stated consumer intent directly.
Collecting data well beats collecting more of it. A valuable tool for effective trend analysis normalizes structured data before comparing sources, since complex data pulled from five dashboards in five formats produces observed trends that are formatting artifacts. Skipping that normalization step is cutting corners on the one part of the process that decides if the chart means anything at all.
Quantitative data alone does not track trends effectively without a baseline. Historical patterns tell an analyst, the same way a consumer intelligence program does, say a spike is a significant shift in consumer interest and consumer preferences, or just noise, and spotting that distinction is most of what separates a tool that helps a team spot trends early from one that just re-displays a chart.
Teams that get this right report reliable insights and consumer insights they can act on, plus real trend forecasting. The operational metrics that matter most, time from signal to decision, are what boost operational efficiency.
Validating AI-powered trend signals
Any tool using AI to flag a rising signal deserves the same test before it earns trust: build a labeled validation set from past events with known outcomes, then measure how often the model's alert would have caught the real trend versus how often it flagged noise. Precision and recall on historical events are the two numbers that answer if an AI-flagged spike is worth acting on.
Hold your horses on any AI-flagged spike until precision and recall on historical events back it up.
The model's own confidence score answers nothing, the same discipline our AI traffic report applies to search-referral data specifically.
Explainability is the second check. A model that can show which features (search velocity, social mention growth, ecommerce listing growth) drove a specific alert lets an analyst sanity-check the signal against their own judgment before committing budget.
Trend research and competitive analysis
Trend research overlaps with competitive analysis whenever a rising topic is a competitor moving first. Benchmarking share-of-search and traffic trends against named competitors, monitoring SERP feature volatility weekly, and comparing content velocity across rivals turn a generic "this topic is rising" signal into "this competitor is capturing the rise and we aren't," a more actionable finding for a marketing or strategy team.
None of this replaces consumer behavior insights gathered directly. Surveys and interviews answer why a shift happened as well as that it did, and a platform that only reports what is rising without connecting it to consumer behavior hands a strategy team half the picture. Skipping that step leaves an elephant in the room, a trend everyone can see with no one able to explain why it's happening.
A structured market analysis has to fill in the rest, and market analysis tied to a broader competitive data set turns an interesting chart into a decision worth staking budget on. The alternative is insight nobody acts on.
Search trends and social media activity are two different measurement instruments pointed at the same target audience, and a significant shift in one does not guarantee revenue growth without checking the other. Analysis tools that only watch one channel miss the sales trends and financial data a finance team tracks.
Tool evaluation checklist and implementation
Match a trend analysis tool's cadence to your team's actual decision cycle. A content team publishing weekly needs faster-refreshing signal than a strategy team running quarterly category reviews, and pricing a tool against the wrong cadence wastes the subscription either way.
Pilot the top two or three candidates against the same known trend, one your team already validated independently. That's the fastest way to see which tool's detection timing and noise level fits.
Growth strategies and business plans built around a single tool's output carry more risk than ones built on a cross-checked signal. Betting the whole budget on one tool's read puts all your eggs in one basket. Budgeting for one of these tools works best as a small pilot line item first, expanded only after a quarter of comparing its calls against what happened.
Embedding trend KPIs into a shared trend tracker dashboard, setting actionable alert thresholds, and running a quarterly review to reassess which signals proved real versus which turned out to be noise closes the loop between detection and an actual decision.
Trend research tools FAQ
What is a trend research tool?
A trend research tool collects search, social, or ecommerce signal and surfaces which topics, products, or categories are growing, ideally before that growth is visible in mainstream search volume or news coverage. The terms trend research tool and trend analysis tool describe the same category of software.
What is the difference between trend analysis and market research?
Trend analysis tracks a narrower signal, search, social, or ecommerce data, over time to catch a rising pattern early. Market research is broader and often includes surveys, interviews, and market research reports built for a specific question, while trend analysis runs continuously in the background. Most strategy teams use both: market analysis for the wide view, trend analysis for the early warning.
Can social media data be part of trend analysis?
Yes. Several tools in this ranking, including Exploding Topics and Semrush Trends, fold social media signal into their trend analysis alongside search and ecommerce data, since a topic often surfaces on social media before it shows up in search volume.
What is the difference between Google Trends and Exploding Topics?
Google Trends shows relative search interest for a term you already have in mind; Exploding Topics is built to surface a topic you haven't thought to search for yet, screening out established keywords and keeping only what's still climbing. Exploding Topics finds that needle in a haystack before anyone else starts searching for it.
How much do trend research tools cost?
Google Trends is free; Exploding Topics starts at $39 a month; Glimpse runs free to roughly $500-plus a month at the enterprise tier; Trend Hunter's PRO plan runs $199 a month per user; Semrush Trends is bundled inside Semrush plans starting at $139.95 a month.
Which trend research tool is best for content and marketing teams?
Exploding Topics fits content and marketing teams that want early, filtered signal on rising topics; Semrush Trends fits teams that already run Semrush and want trend data alongside competitor context in the same login.
How much validation do trend signals need before you act on them?
No single signal, from any tool in this ranking, should drive a real budget decision on its own. Cross-checking a trend against your own search, social, sales, and customer data before calling it a durable shift is standard practice across every tool covered here.
How many countries does Google Trends cover?
Industry research puts Google Trends' coverage at search interest data across 125 countries, with figures reported to refresh roughly every 10 minutes.
What industries use trend analysis besides marketing?
Retail and ecommerce teams use it for demand forecasting, healthcare organizations use it to monitor disease-outbreak patterns, and finance teams use time-series and regression methods to forecast market movements, the same underlying discipline applied to different data.
Bottom Line
No single trend analysis tool in this ranking covers early detection, source transparency, and competitive context at equal depth, which is why the right pick depends on the decision the trend needs to support.
No single tool here wins every category with flying colors, and the right pick still comes down to matching it to the decision at hand.
Start with Exploding Topics or Glimpse for early content and product signal, Trend Hunter for structured ideation, Google Trends as the free baseline everyone should already be checking, and Semrush Trends when the real question is competitive, then validate any signal against your own data, and against the correlation-versus-causation and overextrapolation traps above, before committing budget to it.