Trend Tracker Template
 By Jan Suski. I go deep on every review, checking every number against its source and digging up details other coverage misses, a habit from six years of SEO and link building for tech companies. Bylines at Surfer, Brand24, and Senuto. How the scoring works.
· Prefer this source on Google
This tracker turns scattered trend-spotting into a longitudinal record: trends in rows, time intervals in columns, and percent change computing itself, with trend tracking built in as a habit.
A trend tracker is a structured document used to identify market trends and follow them: which trends are rising, which trends are fading, and what changed since the last review of the tracked trends.
The formulas run live inside the file: no macros to enable, no add-on to install, just percent-change columns that recalculate the moment a new number lands. No cost, no email gate, and it's one of several tracking documents in the download library.
Download the Tracker
Download the tracker (XLSX)One row per trend, interval columns, a percent-change formula, and an archive sheet that keeps history without cluttering the view.
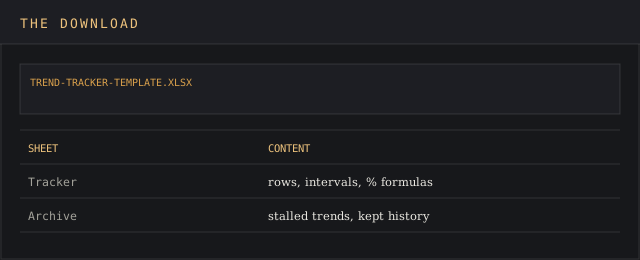
The file opens in Excel and imports into Google Sheets cleanly; Google Sheets and Excel are the popular homes for trend tracking, and the free download works identically in both.
A worked example row ships inside, so the first real trend you track copies its shape; the example also shows the date format the formulas expect.
What a Tracker Row Holds
Key components of a tracker row include the trend name and category, followed by the source, the interval values, the computed change, a status, and context.
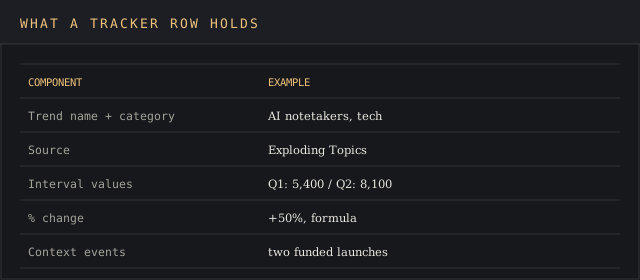
A well-designed trend tracker includes structured time intervals and core KPIs: pick weekly, monthly, or quarterly and hold the line, because using consistent time intervals establishes a stable longitudinal dataset the trend analysis can trust.
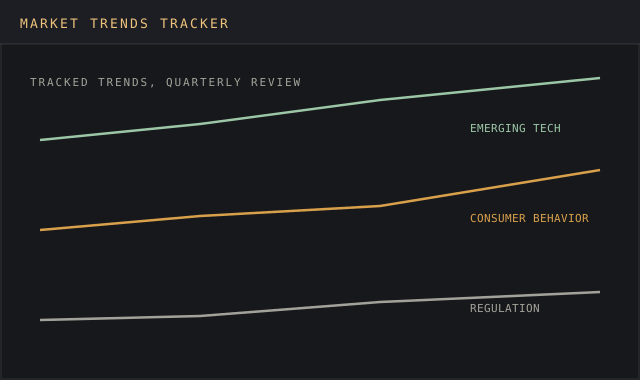
Context earns its column: contextual events should be documented to explain variations in trend data, so the spike that came from one viral post reads differently from the spike that came from ten funded rivals.
Trend templates should structure data for reliable analysis, and structure is most of the work: free-form trend notes describe; structured rows compare.
The Trend Percentage Formula
The trend percentage formula calculates the percent change over time: current value minus prior value, divided by prior value.
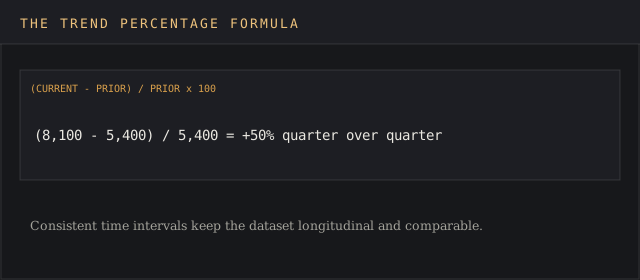
The template computes it per row, so trend analysis starts at a glance: sort by percent change and the quarter's real movers surface, while the flat rows argue for the archive.
Trend analysis examines historical and current data patterns to identify changes, and the formula is the whole engine; everything else in trend tracking is deciding which trends deserve a row and which numbers feed the cells.
Why Track Trends at All
Trend tracking allows businesses to spot opportunities or risks early, while the response is still cheap; business opportunities get identified through evaluating emerging trends before the crowd confirms them.
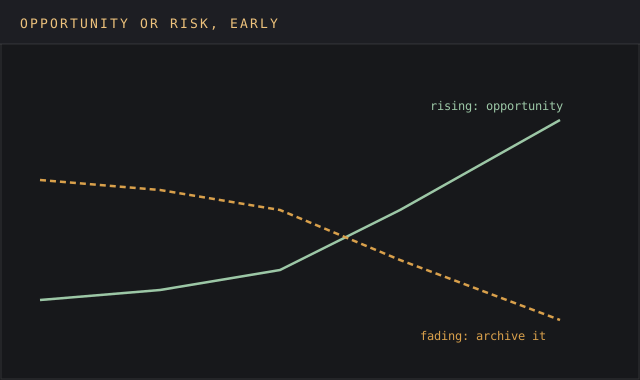
A working trend tracker should monitor shifts in consumer behavior and competitor movements together, because the two move each other: demand shifts pull competitors in, and competitors' launches push demand around.
Comparative benchmarking belongs in the same file: trend analysis that compares your performance against competitors on the same trends shows if the market moved or just you.
Marketers get the fastest payoff, because search demand leads content demand: marketers who track rising search topics publish before rivals rank, and marketers who track fading ones stop spending on yesterday's keywords. The same trends steer product bets and industry analysis further up the calendar.
Our own templates hub pairs this tracker with the market analysis template, where the trends block feeds a fuller market picture.
Build a Trend Center
The tracker works best as a trend center: one central location where all tracked trends, sources, and notes live. Screenshots scattered across chats don't count as a system.
A trend center is a system, and no single file: the tracker at the center, the source list beside it, and the logging habit that feeds both on schedule.
Access decides adoption: give the whole team access to the center, and trends stop being one person's hobby; resources this cheap should never be private.
The center also protects institutional memory. People leave, the system stays, and the logging trail shows every date a trend bent; new users read the center and inherit a year of market trends in an afternoon.
Keep supporting resources in the same place: the articles worth citing, the source URLs, and the archive, so the center answers questions without a scavenger hunt; shared resources are what turn trend tracking into a team sport, and the center is where the categories, metrics, and review dates all meet.
Testing What the Tracker Finds
Tracking trends is half the loop; the other half is the test. A rising trend is a hypothesis, and hypotheses earn budget by surviving a test.
Content is the cheapest test: publish two articles against a rising trend, measure the search clicks and pages per session, and let the metrics say if demand is real. One test article beats a quarter of debate, and the winning pages tell you which related trends deserve pages next.
Marketers can test harder: a small campaign against the trend's keywords, with quality thresholds set in advance, and the test's key metrics, clicks, conversions, revenue per visit, logged next to the trend's row.
Product ideas test the same way: generate a landing page, measure sign-ups, and the trend either demonstrates demand or it doesn't; generate the next test from what the first one taught, since failed pages cost little and skipped tests can cost a roadmap.
Grade every test against the tracker's data: real data from your own test, laid over the trend's slope, is the strongest evidence trend tracking produces, and the valuable insights compound when each test's results get archived with the trend.
The difference between teams that profit from trends and teams that just watch them is exactly this: test, measure, repeat.
For Agencies and Their Clients
Agencies run the same tracker per client: one tab per client, the clients' niche trends in rows, and a monthly summary each of the clients reads.
Brands pay for foresight, and a tracker full of dated evidence demonstrates it: clients renew when the agency's trend report predicted the demand shift their revenue later confirmed, and brands remember who called the market trends first.
Regional splits earn their own rows where markets diverge: a trend cresting in one part of the world while budding in another is a rollout calendar, and no contradiction; finance and technology trends especially travel at different speeds by market.
Publications and creators use the identical setup: trends as beat ideas, the tracker as the editorial reference, and the archive as proof of early calls.
Sources, Accounts, and Registration
Every source row deserves a URL, so the number's origin is one click away and the next reviewer can browse straight to it; a value without a URL ages into a rumor.
Note what each source costs to reach: Google Trends needs no registration, most trend databases offer free tiers behind a registration wall, and the paid tools want an account and a card. Log the registration status per source, because a tracker nobody can refresh without the one person who holds the account is a system with a single point of failure.
Trend databases differ in what their millions of data points measure: search databases count queries, social databases count posts and users, and content databases count articles; mixing them in one row breaks the longitudinal record, so give each source its own row and let the quality of agreement between them be the finding.
Data quality checks close the loop: spot-check each source's numbers against a second source on a fixed date each quarter, and explore a replacement when a source's quality slips; the world's trend data shifts under the tools that report it.
Where the Trend Data Comes From
The tracker is source-agnostic; the tools below are where most trend rows get their numbers, free tools first, paid tools where the coverage earns it.
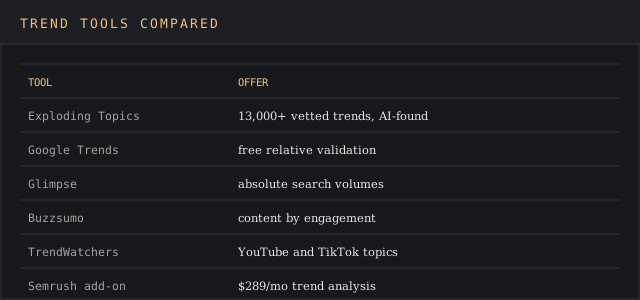
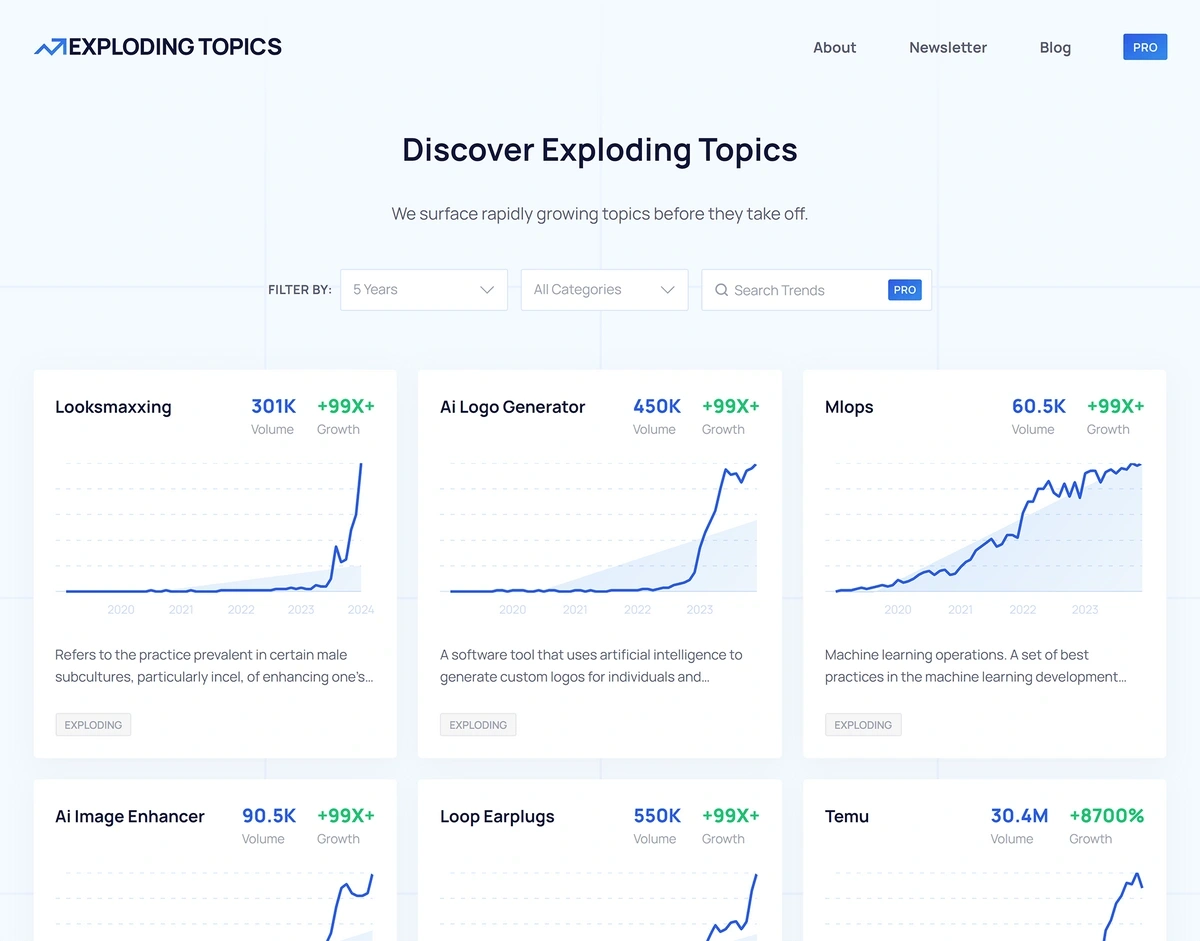
Exploding Topics has over 13,000 vetted trends and uses AI to identify under-the-radar trends before they chart elsewhere; it is the strongest single feed for the discovery side, and our review covers the plans.
Google Trends is a free tool for trend validation: it provides historical search volume data for keywords in relative terms, which makes Google Trends the standard cross-check on anything another source flags. Search interest that Google Trends shows flat deserves skepticism, whatever the discovery tool claimed.
Glimpse layers absolute search volume data onto that relative picture, which matters when the tracker needs real numbers in its interval columns.
Buzzsumo ranks content based on recency and engagement, the content-marketing read on the same trends; TrendWatchers tracks topics on YouTube and TikTok, where visual trends surface first; and Semrush's trend analysis add-on costs $289 per month for teams that want the trend data inside their Semrush workflow.
Free covers more than most teams expect: Google Trends plus a free discovery feed fills a tracker respectably, and the paid tools earn their fees on search volume data, alerts, and coverage of trends the free tier misses; brands with bigger budgets add a second discovery source and reconcile the two.
Automating the Updates
Manual trend tracking survives about a quarter; automation turns the tracker into a habit that keeps running long after the original project wraps.
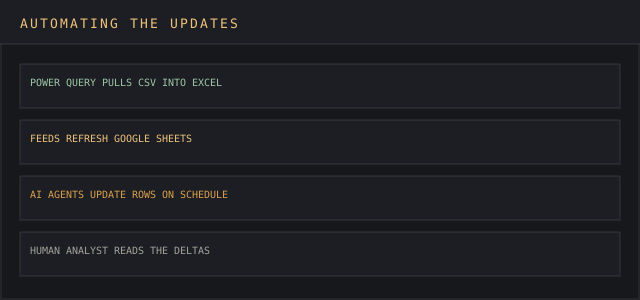
Templates can automate data imports from CSV or feeds: Power Query automates the imports in Excel, and Google Sheets pulls feeds natively, so the interval columns fill themselves on schedule.
AI agents go a step further: a Simular AI agent can manage trend templates automatically, and Simular AI agents automate data updates in Google Sheets and Excel, refreshing rows without a person touching the file. AI agents suit the collection half of trend tracking precisely because the work is repetitive.
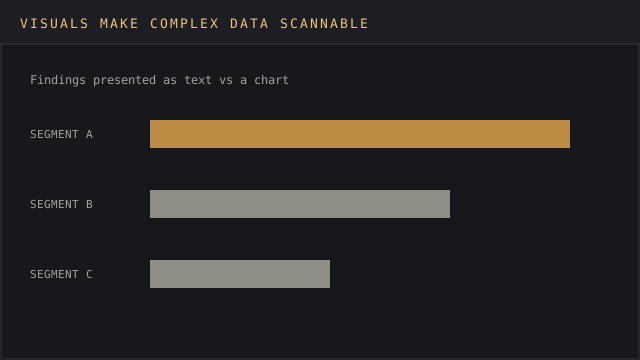
Automated trend analysis can save time and reduce manual errors, and automated visual aids transform raw historical data into actionable intelligence; charts drawn from the tracker make the movers visible in seconds, since visual tools simplify data interpretation for everyone who reads the report.
Keep a human analyst on the reading side. A human analyst decides which trends matter, which spikes are noise, and which context events explain the wiggle; the automation feeds the tracker, and the human analyst feeds the strategy. AI agents that write the rows plus a human analyst who reads them is the division of labor that holds; our AI market intelligence guide covers the boundary in depth.
Tracker Hygiene
Best practices for trend tracking include regular updates and archiving irrelevant trends, and both habits protect the same thing: a tracker short enough to read.
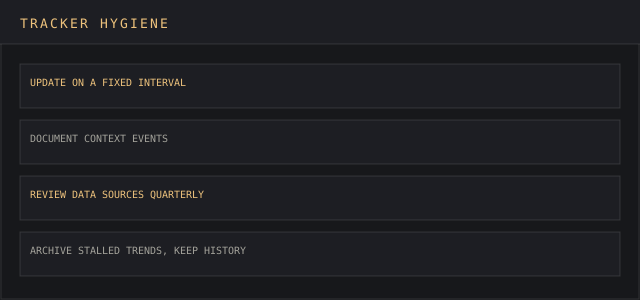
Update on the fixed interval, never ad hoc; tracking trends on memory produces a record with holes exactly where the interesting quarters were, and the report inherits every hole.
Archive stalled trends. Don't delete them. They move to the archive sheet with their history intact, so a trend that revives keeps its past, and the main view stays a working report. The museum piece lives in the archive tab, where it belongs.
Regularly reviewing data sources matters too: a source that changes methodology mid-year quietly breaks the longitudinal record, and a quarterly source check costs five minutes.
Close each review by translating the movers into moves: actionable next steps turn visual trends into business actions, and a tracker whose report never changes a decision is a hobby.
The Weekly Read
A useful rhythm for the working tracker: a short weekly report and a fuller monthly report, each drawn from the same rows; the report cadence is the system's heartbeat, and insights arrive on the beat.
Weekly, scan the percent-change column, log context events while they are fresh, and flag anything that moved beyond the usual band; the weekly report to the team can be three lines, and weekly reports that stay three lines get read.
Monthly, read the whole report: which trends held their slope, which trends reversed, and which search behaviors changed underneath them. The monthly report is also when new candidate trends earn rows and stalled trends earn the archive.
Quarterly, judge the tracker itself: are the trends tracked still the trends that matter, do the sources still deserve trust, and did any tracked trend change a plan? The tracker is a powerful tool exactly as long as the answers stay yes, and a powerful tool nobody reads is a spreadsheet.
Trends by Category
Categories keep the tracker readable as it grows: tech trends, consumer trends, finance trends, and regulatory trends behave differently, and the categories deserve different review dates.
Search trends move fastest and get analyzed weekly; social trends spike and die; economic trends drift for quarters. The category column lets each family of trends run its own clock.
Sort trends by category before every monthly report, and the report writes itself: three rising trends per category, three fading trends, and the trends that switched direction since the last date.
Pricing trends earn a special mention for commerce teams: competitors' pricing pages, tracked as trends, feed the pricing intelligence workflow directly, and pricing moves often lead demand trends by a quarter.
Cross-category trends are the jackpot: when search trends, hiring trends, and funding trends agree, the signal quality is as high as trend research gets.
From Tracker Rows to Research
The tracker feeds research; it doesn't replace it. Rows that keep rising graduate into proper research projects with real budgets.
Create a one-page brief per graduating trend: what the trends data shows, what the test showed, and what a bigger bet would cost; the research brief in our market research report template holds the structure.
Create the habit of quoting row numbers in meetings, and create some friction for trend claims without rows; performance against the tracker is the fairest way to grade anyone's market instincts.
Analyzed this way, the tracker becomes the team's shared research memory: every claim dated, every date sourced, every source checked for quality on schedule; the metrics stay honest because the system keeps them, and no person has to.
Analyzed trends also improve the sources themselves: when a source's flagged trends keep failing your tests, its quality score drops and its rows shrink; when a source keeps calling moves early, it earns more of the tracker's attention. Quality in, quality out, measured.
FAQ
What should a trend tracker include?
Trend name, category, source, values at consistent time intervals, the percent change, a status, context events, and a next review date; the free template holds all of it in one row per trend.
How do you track trends in Excel or Google Sheets?
One row per trend, one column per interval, the percent-change formula filled down, and a chart over the interval columns; import the XLSX above and the structure arrives built, with Power Query or Sheets feeds automating the refresh.
What is the trend percentage formula?
Current minus prior, divided by prior, times 100: the percent change between intervals. Sorted descending, it is the fastest read of any tracker.
Which trend tools are worth paying for?
Start free with Google Trends for validation; pay for Exploding Topics when discovery matters, Glimpse when absolute search volumes matter, and Semrush's add-on when the workflow already lives there. Our trend research rankings compare the field.
How often should trends be reviewed?
Update at the tracker's fixed interval, read weekly, prune monthly, and audit the sources quarterly; consistency beats frequency, because the longitudinal record is the product.
Bottom Line
Trend tracking is compound interest on attention: each interval logged makes every future comparison sharper, and the trends worth acting on announce themselves as slopes; a hunch never draws that clean a line. The tracker's report becomes the meeting, and the trends center the agenda.
Download the tracker, seed it with ten trends from your market, and hold the interval; the free tools cover the feeds, the formulas cover the math, and the report earns its keep the first time a rising trend reaches your roadmap before your competitors' press release announces theirs.