Small business statistics for 2026, and why the published counts disagree
 By Jan Suski. I go deep on every review, checking every number against its source and digging up details other coverage misses, a habit from six years of SEO and link building for tech companies. Bylines at Surfer, Brand24, and Senuto. How the scoring works.
The numbers U.S. small businesses, 2022 counts to August 2026 surveys, checked 1 October 2026
Small businesses make up nearly all businesses in the country, and the typical one has no payroll: 29,811,495 of the 36.2 million small businesses are nonemployer businesses.
New establishments close fastest in their first year (20.4% of the 2015 cohort), and from year six on the survivors close at 6% to 8% a year.
Credit and labor are the two tightest constraints in the 2026 data, with 22% of financing applicants getting nothing and 82% of hiring owners reporting few or no qualified candidates.
The U.S. has 36,207,130 small businesses, 99.9% of all businesses, according to the Frequently Asked Questions About Small Business 2026 from the U.S. Small Business Administration's Office of Advocacy. Small businesses employ 62.3 million people, or 45.9% of private sector employees in the U.S. economy. Both figures describe 2022, the latest year with a full Census Bureau count of businesses by size, so a 2026 headline rests on data four years old.
Fresher data on small businesses tells a split story. The Census Bureau logged 531,728 new business applications in August 2026, the Federal Reserve found that 42% of financing applicants got the full amount they asked for, and NFIB's Small Business Optimism Index sat at 98.7, above its 52-year average of 98.0 by a hair's breadth.
This report pulls small business statistics from the bodies that collect them: the SBA, the Census Bureau, the Bureau of Labor Statistics, the Federal Reserve, NFIB, the UK Department for Business and Trade and the European Commission.
It's written for entrepreneurs sizing up a new venture's market with a market sizing template, for lenders & analysts who need a sourced number on small businesses, and for anyone about to repeat the claim that 90% of new businesses fail. BLS survival tables put the real ten-year closure rate at 65.3%.
Small businesses in the U.S.: 36.2 million firms and 99.9% of all businesses
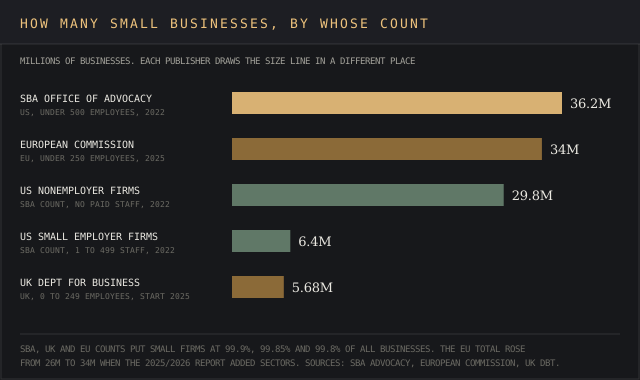
The Office of Advocacy counts any independent business with fewer than 500 employees as small, and the count of small businesses makes everything else look like a rounding error. Against 36,207,130 small businesses, the same 2022 data holds 21,041 large businesses. Advocacy builds the number from two Census Bureau programs, the Statistics of U.S. Businesses and Nonemployer Statistics.
Employer businesses and solo ventures
Most businesses in the U.S. never hire anyone, and most small businesses are one person. Advocacy's FAQ counts 29,811,495 nonemployer businesses, 82.3% of all small businesses, and 6,395,635 small employer businesses, 17.7%. Most nonemployer businesses are sole proprietorships (86.7%), the legal form of solo ventures such as freelancers who run operations without payroll.
Small employer businesses make up 99.7% of businesses with paid employees, and most are tiny: 55.7% of employer establishments had fewer than five employees in 2022, per the Census Bureau's Small Business Week roundup. Nonemployer businesses barely register in payroll data, so most job statistics below cover the 6.4 million employer businesses only.
Women, minority, veteran and family owned businesses
The most recent data on owner demographics comes from the Census Bureau's 20 November 2025 release covering 2023. It counts 36.4 million employer and nonemployer businesses with $50.0 trillion in receipts, and the split between employer and nonemployer businesses changes every ownership share:
- Women entrepreneurs owned 14.2 million businesses: 42.3% of nonemployer businesses and 22.9% (1.4 million) of the roughly 5.9 million employer businesses.
- Hispanic owners held 17.5% of nonemployer businesses (5.3 million) and 8.4% of employer businesses (496,000).
- Asian owners held 11.5% of employer businesses (685,000) and Black owners 3.4% (201,000).
- Veterans owned 1.6 million businesses, including 261,000 employer businesses, 4.4% of the total.
Advocacy's 2022 figures run close: women owned 40.4% of all classifiable businesses, veterans 1.7 million (4.8% of all businesses), and minority-owned businesses made up 23.5% of employer businesses, so racial minorities own close to one in four employer businesses. Family owned businesses play a significant role in hiring too. Advocacy puts family owned firms at 26.1% of employer businesses in 2022, with 15 employees per firm against 11 at non-family firms.
Small businesses employ nearly half of private sector employees and lead job creation
Small businesses employ 62.3 million people and pay 38.7% of private sector payroll, $3.5 trillion, per the SBA's 2026 FAQ. That's 45.9% of the private workforce on 38.7% of the wage bill. Small business statistics on job creation and economic growth come from different series: jobs from BLS Business Employment Dynamics, output from the SBA's GDP study. Employment counts for small businesses describe 2022; jobs data from BED runs to 2024.
Job creation and job growth since 1995
From January 1995 to December 2024, small businesses created 20.7 million net new jobs while large businesses created 13.2 million, Advocacy reports from BLS data. That's 61% of the 33.9 million net total, the same 61.1% Advocacy's 2024 FAQ gave for net new jobs since 1995.
Single years swing harder for small businesses. The 2025 U.S. Small Business Profile shows opening and expanding establishments added 14.4 million jobs between March 2023 and March 2024 while closing and contracting ones lost 13.0 million. Of the 1.4 million net gain in jobs, small businesses contributed 1.2 million, or 88.9%. One strong year can be a flash in the pan, so the 30-year 61% is the figure to quote.
Industries where small firms hold the largest share of jobs
Small firms play a critical role in hands-on industries and a smaller one in capital-heavy ones. The 2025 profile lists small business employees and their share of each industry's workforce for 2022:
| Industry | Small business employees | Small business share of industry employment |
|---|---|---|
| Health care and social assistance | 9,260,938 | 43.7% |
| Accommodation and food services | 8,657,489 | 62.8% |
| Construction | 5,942,593 | 80.7% |
| Professional, scientific and technical services | 5,622,799 | 55.4% |
| Retail trade | 5,452,297 | 34.2% |
| Manufacturing | 4,984,670 | 40.9% |
| Other services (except public administration) | 4,649,309 | 85.0% |
| Agriculture, forestry, fishing and hunting | 140,234 | 83.2% |
Health care and social assistance holds the most small business employees, 9.3 million, while other services has the highest share at 85.0%. Construction, at 80.7%, is the market our construction market report sizes from the spending side. Utilities sit at the bottom with 18.8%.
Small and large businesses compared on payroll, receipts and exports
Small businesses' share of output shrinks as the measure gets closer to money. They hold 45.9% of employees, 38.7% of payroll and 35.0% of private sector receipts ($17.8 trillion). In the export market the shape repeats for small businesses: 270,014 of them make up 97.2% of known exporters but ship $588.4 billion, 33.0% of known export value.
Small businesses by state: California has 4.3 million, and Montana's employ 66.3%
California has the most small businesses, 4.34 million, followed by Texas (3.52 million) and Florida (3.49 million), and Montana has the highest share of employment at small businesses, 66.3%, ahead of Wyoming (65.2%) and Vermont (62.1%), per Advocacy's June 2025 release. The 2025 state profiles behind it use 2022 counts and BLS job data for March 2023 to March 2024:
| State | Small businesses | Share of the state's businesses | Small business employees | Share of state employees | Small businesses' share of net new jobs, 2023 to 2024 |
|---|---|---|---|---|---|
| California | 4.34 million | 99.8% | 7.6 million | 47.4% | 99.7% |
| Texas | 3.52 million | 99.8% | 5.1 million | 44.4% | 84.0% |
| Florida | 3.49 million | 99.8% | 3.8 million | 39.6% | 77.4% |
| New York | 2.4 million | 99.8% | 3.9 million | 46.6% | 42.4% |
| Montana | 141,011 | 99.2% | 264,567 | 66.3% | 98.4% |
Texas and Florida hold almost the same number of small businesses, yet small businesses in Texas employ 5.1 million people against 3.8 million in Florida, 44.4% of state employment against 39.6%. California's small businesses added a net 86,885 jobs over the year, 99.7% of the state's net job growth, while New York's small businesses accounted for 42.4% of its net gain, 54,510 jobs.
How many small businesses fail: 34.7% of new establishments last 10 years
The claim that 90% of new businesses fail within ten years is wrong: the real ten-year survival rate is 3.5 times what it implies. BLS tracks every private establishment that opens, from startups and other new businesses to new branches of existing businesses. Of the 677,876 that opened in the year to March 2015, 235,071 were still operating in March 2025, a survival rate of 34.7%, so 65.3% closed.
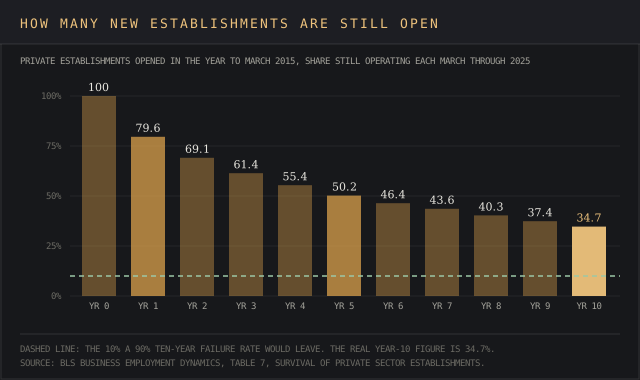
The cohort lost 20.4% in year one, 30.9% by year two and 49.8% by year five. Advocacy's FAQ averages the same BLS series across every cohort from 1994 to 2022 and gets 67.7% two-year survival, 49.2% five-year, 33.9% ten-year and 25.5% fifteen-year.
How many businesses fail in the first year
BLS tables back the common estimate that one in five new businesses closes in its first year. Establishments born in the year to March 2024 kept 77.9% of their number into March 2025, a first-year small business failure rate of 22.1%. The 2022 cohort kept 76.3% and the 2023 cohort 78.2%. BLS counts establishments, so a chain that shuts one store records a closure even when the parent companies stay open.
Survival rates by industry
BLS sector tables give valuable insights into which industries keep new establishments open, and accommodation and food services beat the all-industry average at every checkpoint for the 2015 cohort. Information and professional services did worse:
| Industry of new businesses (BLS sector table) | 1-year survival, 2015 cohort | 5-year survival | 10-year survival | 1-year survival, 2024 cohort |
|---|---|---|---|---|
| Retail trade | 90.2% | 61.7% | 44.2% | 84.4% |
| Construction | 83.3% | 57.5% | 42.6% | 79.7% |
| Accommodation and food services | 88.2% | 58.5% | 41.6% | 85.3% |
| Health care and social assistance | 84.6% | 57.3% | 36.4% | 82.1% |
| All private industries | 79.6% | 50.2% | 34.7% | 77.9% |
| Professional, scientific and technical services | 81.6% | 50.3% | 34.3% | 74.5% |
| Information | 80.8% | 46.8% | 30.0% | 71.6% |
New retail businesses posted the highest ten-year survival rate of the six sectors, 44.2%, which our retail industry statistics report pairs with market data on store counts and sales. New professional services businesses from the 2024 cohort lost 25.5% in year one, the worst first-year result in the table.
Survival odds rise with age
From year six to year ten, the 2015 cohort lost 6.1% to 7.6% of its remaining establishments each year, against 20.4% in year one. The 1994 cohort shows where that ends. Of its 569,387 openings, 71,595 were still running in March 2025, 12.6% after 31 years, and 95.7% of the previous year's survivors made it through each of the last two years.
Survival measures one thing: the establishment is still operating. A store kept open on its owner's personal savings counts as a survivor, and the BED tables record openings and closings with no field for the cause, so any claimed most common reason businesses fail comes from an owner survey.
New business applications: the Census Bureau logged 531,728 in August 2026
Business applications are a monthly read on entrepreneurship and on how many entrepreneurs try to start small businesses. The Census Bureau's Business Formation Statistics count applications to start new businesses and publish them monthly, seasonally adjusted. The latest data, the September 2026 release, shows 531,728 new business applications in August 2026, down 7.8% from July.
High propensity business applications and projected formations
Most new business applications never become employer businesses. The Census Bureau splits the August total into tiers. High propensity business applications made up 27.3% of August's business applications, and business applications from corporations 7.7%:
| Series, August 2026 (seasonally adjusted) | Count | Change from July 2026 |
|---|---|---|
| Total new business applications | 531,728 | -7.8% |
| High propensity business applications | 145,387 | -4.1% |
| Business applications with planned wages | 34,263 | -1.9% |
| Business applications from corporations | 41,075 | -8.1% |
| Projected business formations within 4 quarters | 28,501 | -4.6% |
| Projected business formations within 8 quarters | 39,292 | -3.4% |
Divide 28,501 projected formations by 531,728 business applications and 5.4% of August's new business applications are projected to become new business startups with payroll tax liabilities within four quarters.
That gap between new venture filings and startups with payroll explains why new business applications run in the millions while counts of employer businesses barely move. For entrepreneurs, projected formations are the best single read on entrepreneurship that turns into startups with payroll.
New business applications by region and industry
The South filed the lion's share of August's new business applications, 232,595 or 43.7%, and fell the most, 9.3%. The West filed 132,696 (down 6.3%), the Midwest 91,773 (down 8.2%) and the Northeast 74,664 (down 4.9%). Retail trade drove the monthly drop: retail business applications fell 26.0% to 104,087, seasonally adjusted. The Census Bureau also publishes state-level business applications in an interactive state tool for sizing one market.
The not seasonally adjusted BFS monthly file shows 4,345,310 new business applications from January through August 2026, of which 1,227,385 business applications, or 28.2%, were high propensity. Retail swings hardest in the raw counts, with 161,695 retail business applications in July against 90,197 in June.
Formation shows up in establishment counts too. Advocacy reports 1.3 million establishments opened for the first time in 2023 and about 1.2 million closed, and startups made up 14.2% of establishments in 2023, against 12.5% in 2019. Entrepreneurs filing new business applications in 2026 face a BLS first-year survival rate of 77.9% for the latest cohort, close to the 79.6% of 2015.
Small business financing: 42% of applicants got the full amount
The Federal Reserve's 2026 Report on Employer Firms collected 6,525 responses from a convenience sample of employer businesses between 3 September and 14 November 2025. Sixty percent of small businesses in the sample applied for financing in the past year, and 38% applied for a loan, line of credit or merchant cash advance.
How many small businesses get the financing they ask for
Of the applicants, 42% received the full amount they sought, 36% received some or most, and 22% received none. That leaves 58% of applicants short of what they asked for. Advocacy's FAQ lists where small businesses turn for financial support: banks, credit unions, finance companies and nonfinancial firms, plus family and friends and personal savings.
The most common reason for financial strain: rising costs
Small businesses face rising costs first. Rising costs of goods, services and wages, the inputs to daily operations, was the most common financial challenge in the Fed survey, more than four in 10 small businesses named tariff-related costs, and 77% reported one or both.
Revenue and employment growth held steady between the 2024 and 2025 surveys. Reaching customers and growing sales was the most common operational challenge, followed by hiring or retaining qualified staff. The revenue expectations index, the Fed's gauge of expected revenue growth, fell six points from 39 to 33, and the employment growth index fell from 26 to 23.
Many small businesses make ends meet on thin cash cushions. The JPMorgan Chase Institute's Cash is King study of 597,000 small businesses (September 2016) found the median small business holds 27 cash buffer days, the days of outflows its cash would cover, and 25% of small businesses hold fewer than 13 days of operations in cash. Cash management starts with an owner's own figure, which a burn rate calculator or a working capital calculator produces from two numbers.
Small businesses struggle to hire: 35% have openings they can't fill
NFIB's August 2026 survey of the small business labor market put the share of small business owners with jobs they couldn't fill at a seasonally adjusted 35%. Of the 56% of owners hiring or trying to hire, 82% reported few or no qualified applicants. For many small businesses, skilled workers are a needle in a haystack: the 82% counts owners who got few or no applicants qualified for the jobs on offer.
The wider labor market has cooled. The Bureau of Labor Statistics put open jobs at 7.1 million in August 2026, a 4.3% job openings rate. NFIB says labor quality and labor costs eased as owners' single most important problem in August. Small businesses report the shortage of skilled workers even so, at 82%.
Optimism, uncertainty and the most pressing problems
Owners sit on the fence. NFIB's Optimism Index, a monthly survey of small businesses, fell 1.1 points to 98.7 in August but stays above the 52-year average of 98.0. Its Uncertainty Index fell 2 points to 89, against a historical average of 68. Inflation and taxes tied as the single most important problem at 16% each, and a net 10% of owners expect better business conditions, down 5 points.
Future growth expectations are positive and shrinking. For economic health in the small business sector, the August read is optimism at the long-run average, uncertainty 21 points above its own average, and costs that owners grin and bear. Small businesses benchmarking their own hiring market can start with our labor market intelligence guide, which covers the BLS and private sources behind hiring forecasts.
Artificial intelligence and digital tools: adoption estimates run from 7.6% to 70%
AI use produces the widest spread of any technology or innovation figure about small businesses in this report. Four publishers' readings from 2024 to 2025 run from 7.6% to more than 70%, a gap of 62 points:
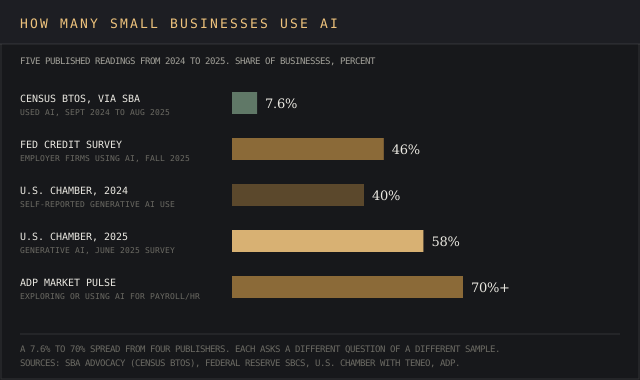
- Census Business Trends and Outlook Survey, as cited by Advocacy: 7.6% of businesses used artificial intelligence between September 2024 and August 2025. Businesses with more than 250 employees led at 11.4%, followed by businesses under five employees at 8.2%.
- Federal Reserve Small Business Credit Survey: 46% of employer businesses said the business or its employees use AI, and another 15% planned to start within 12 months.
- U.S. Chamber of Commerce with Teneo (3,870 small businesses, June 2025): 58% of small businesses use generative AI, up from 40% in 2024.
- ADP Market Pulse (November 2025): more than 70% of small businesses are exploring or already using AI for payroll and HR tasks.
Each technology survey asks a different question. BTOS counts businesses that used AI over a set period, the Fed counts use by the business or its employees, the Chamber counts self-identified generative AI use, and ADP's figure includes owners still exploring.
The Chamber's Empowering Small Business 2025 report found 99% use at least one of the technology platforms it tracks and 84% plan to increase their use. Its broadest technology and innovation question found 96% of small business owners plan to adopt emerging technologies, including AI and cryptocurrencies.
Digital tools are a dime a dozen among small businesses, while the Census reading of AI use, the closest measure of innovation in production, sits at 7.6%. Our AI statistics report tracks the same technology split for large companies.
Small business statistics outside the U.S.: the UK and EU draw the line at 250
Both the UK and the EU define a small or medium-sized enterprise as a business with fewer than 250 employees, against the U.S. research cutoff of 500.
The UK Department for Business and Trade's Business Population Estimates 2025 (2 October 2025) counted 5,690,265 private sector businesses at the start of 2025, of which 5,681,930 (99.85%) had 0 to 249 employees. About 75% of UK businesses had no employees beyond the owners.
SMEs held 60% of total employment in the UK economy, 16.9 million of 28.1 million jobs, and 51% of turnover outside finance and insurance. Our UK retail market report covers the retail market for those businesses in detail.
The European Commission's Annual Report on European SMEs 2025/2026 (22 June 2026) counts about 34 million SMEs, 99.8% of enterprises, employing 105.6 million people, nearly two-thirds of business economy employment. Micro enterprises with fewer than 10 employees make up 94.5% of the SMEs. On the Commission's economic growth measure, SME real value added grew 2.5% in 2025, with employment growth of 1.0% and growth of 1.8% in the number of enterprises.
Why the published small business estimates diverge
Most disagreement between small business statistics comes from definitions, data years and units, and the same handful of figures gets restated with the year stripped off. Houses and reasons, gap by gap:
| Measure | Figure A | Figure B | Why they differ |
|---|---|---|---|
| Number of small businesses | 36,207,130 small businesses (SBA, 2022, under 500 employees) | 36.4 million businesses of all sizes (Census Bureau, 2023) | Different years and scope; the Census total includes large businesses |
| Size cutoff | Small businesses under 500 employees (SBA research definition) | Businesses under 250 (UK DBT, European Commission) | A U.S. firm with 300 staff is small in Washington and large in Brussels |
| Share of GDP | 43.5% (SBA, still cited in 2026) | 48.0% (same series, 1998) | Both come from Advocacy's GDP study covering 1998 to 2014 |
| Ten-year survival | 33.9% (SBA, 1994 to 2022 cohort average) | 34.7% (BLS, 2015 cohort) | An average across cohorts against one cohort; both count establishments |
| Small business share of job creation | 61% of net new jobs from small businesses (1995 to 2024) | 88.9% (March 2023 to March 2024) | Thirty years against one year of BED data |
| Women-owned share | 40.4% of classifiable businesses (SBA, 2022) | 22.9% of employer businesses (Census Bureau, 2023) | All businesses against employer businesses only |
| AI use | 7.6% of businesses (Census BTOS via SBA) | 58% of small businesses, generative AI (U.S. Chamber) | Any AI use reported to Census against self-identified generative AI use in a survey run with Teneo |
The GDP figure is from 2014
The 43.5% share of GDP sits on Advocacy's 2026 FAQ page, but its source is the Small Business GDP, 1998 to 2014 study, which Advocacy summarized as small businesses generating 44 percent of U.S. economic activity in a January 2019 release. In 2014, small businesses generated $5.9 trillion in nominal GDP, 43.5% of the total, down from 48.0% in 1998.
Small business GDP growth ran 1.4% a year in real terms against 2.5% for large businesses, so small firms trailed overall economic growth across those 16 years, a gap a CAGR calculator shows compounding fast. Any 2026 claim about the small business economy's share of economic activity, or of the economy as a whole, that cites this figure is quoting 12-year-old data.
The EU count jumped by 8 million on a coverage change
The Commission's 2025/2026 report counts about 34 million SMEs, up from 26 million in the previous edition, because it added healthcare, education, financial services and creative industries to its coverage. Counting more sectors' small businesses makes comparisons across editions unreliable. The devil's in the details with any published market dataset, and our guide to secondary market intelligence covers how to check coverage notes before reusing one.
Frequently asked questions
Are small businesses struggling right now?
Partly. NFIB's Optimism Index read 98.7 in August 2026, above its 52-year average, but its Uncertainty Index sat at 89 against a 68 average, 35% of owners had openings they couldn't fill, and 22% of financing applicants in the Fed's 2025 survey got nothing.
What percentage of small businesses are successful?
Survival is the measurable proxy for small businesses. BLS data shows 79.6% of establishments opened in the year to March 2015 survived one year, 50.2% survived five and 34.7% survived ten.
What are some interesting facts about small businesses?
Small businesses make up 97.2% of known U.S. exporters, family owned businesses average 15 employees against 11 at other businesses, 4,345,310 new business applications were filed in the first eight months of 2026, and retail establishments have the best ten-year survival rate of the six sectors in our table, 44.2%.
What business has a 90% success rate?
Among small businesses, retail trade comes closest, and only for year one: 90.2% of retail establishments opened in the year to March 2015 survived their first year, per BLS. By year ten that fell to 44.2%. A 90% figure holds for a single year in one sector, and it's a long shot beyond that.
What is the success rate of small businesses?
Measured by survival, about half of new establishments reach year five (50.2% for the 2015 cohort; 49.2% averaged across 1994 to 2022 cohorts) and about a third reach year ten (34.7%; 33.9% averaged).
How much is a business worth with $1,000,000 in sales?
Around $700,000 at the market average. BizBuySell's Q2 2026 Insight Report put the average revenue multiple at 0.7 and the average cash flow multiple at 2.7 across 2,117 businesses sold, with a median sale price of $349,250. A seller with thin cash flow gets less at the 2.7 cash flow multiple, so run the owner's earnings through an enterprise value calculator before quoting a number.
Bottom line
Small businesses are 99.9% of businesses in the U.S. and employ 45.9% of private sector employees, but the counts behind those numbers describe 2022 and the GDP share describes 2014. Treat any 2026 headline that omits the data year as a red flag.
The survival data on small businesses beats its reputation. About one new establishment in five closes in year one, 50.2% are open at year five, and 34.7% reach year ten, so the 90% failure claim matches no BLS table. For small business owners, the binding constraints in the 2026 data are credit, with 42% of applicants fully funded, and hiring, with 82% of hiring owners short of qualified candidates, while new business applications ran at 531,728 in August.
Where each small business figure was published, and what no agency counts
Counts, jobs and payroll: advocacy.sba.gov, for Frequently Asked Questions About Small Business 2026 (February 2026), the 2024 FAQ (December 2024), the 2025 U.S. Small Business Profile and state profiles (June 2025), the state release of 30 June 2025 and the GDP release of 30 January 2019. census.gov, for the Small Business Week roundup (May 2025) and the business owner characteristics release (20 November 2025).
Survival and formation: bls.gov, for Business Employment Dynamics Table 7 and the BED sector tables (establishments tracked to March 2025), and census.gov, for Business Formation Statistics (release of 11 September 2026, August 2026 data), the BFS monthly file and the interactive state tool.
Credit, labor and cash: fedsmallbusiness.org, for the 2026 Report on Employer Firms (3 March 2026); nfib.com, for the August 2026 survey release (8 September 2026); bls.gov, for the August 2026 JOLTS reading; jpmorganchase.com, for Cash is King (September 2016); bizbuysell.com, for the Q2 2026 Insight Report.
Technology and outside the U.S.: uschamber.com, for Empowering Small Business 2025 (June 2025 survey); adp.com, for ADP Market Pulse (November 2025 survey, article of March 2026); gov.uk, for Business Population Estimates 2025 (2 October 2025); single-market-economy.ec.europa.eu, for the Annual Report on European SMEs 2025/2026 (22 June 2026). The BTOS AI figure comes via advocacy.sba.gov.
Every figure on this page was checked against its source on 1 October 2026. No publisher cited here prints a small business share of U.S. GDP newer than 2014 or a full U.S. count of businesses by size newer than 2022, and the BED tables that count closures carry no field for the cause.