
The numbers Global construction, checked 5 August 2026
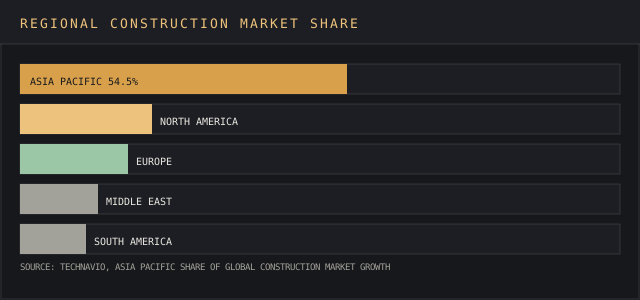
Growth sits in two places. Asia Pacific takes 54.5% of the market's expansion, and data center work moves 20% in 2026 while commercial development lags.
Output per worker has halved since the 1960s, which is why capital keeps going into BIM, modular methods and robotics.
A market worth over 10% of global GDP still has no agreed size. Technavio, Mordor Intelligence and The Business Research Company each publish their own.
Check what a market size figure covers, residential only or all three sectors, before you compare two analyst numbers.
I'll write a 2,500+ word report on the market you name, every figure linked to its source. Yours to publish, from $200.
The Construction Market in Numbers
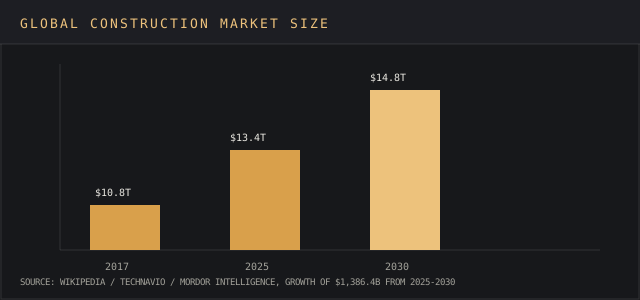
This construction market report opens with scale: the construction market was valued at $10.8 trillion globally in 2017 and is projected to reach $14.8 trillion by 2030, per Wikipedia's summary of Technavio and Mordor Intelligence data, with the construction market expected to grow by $1,386.4 billion between 2025 and 2030 alone.
Total spending in the construction market is projected to hold roughly steady at $2.2 trillion in 2026, per Burns & McDonnell, Corfix, and Glass Magazine's construction industry outlooks, even as the longer forecast period points toward continued growth.
Construction accounts for over 10% of global GDP and employs around 7% of the global workforce, a scale that makes even small percentage shifts in the construction market worth billions in absolute terms.
Residential building is its own large slice of that market size: the residential building construction market carried a market size of $4,505.05 billion in 2025, projected to reach $6,243.07 billion by 2030 at a 7.1% compound annual growth rate over that forecast period, per The Business Research Company and Technavio.
Construction Processes, Procurement, and Regulation
Construction processes run through a fairly standard sequence regardless of country: land acquisition and design, permitting against local building regulations, procurement of materials and specialty labor, then the build itself under a general contractor's oversight.
Local building regulations shape schedules and costs more than most market research acknowledges directly, since a jurisdiction's permitting timeline alone can add months to a project before a single foundation is poured, and construction materials sourcing has become a project-management discipline of its own since global supply chains started producing price swings that older procurement processes were never built to absorb.
Four inputs separate construction companies that win competitive bids from ones that lose money on schedule overruns.
- Key data on construction processes for the project type being bid.
- Average permitting time in the jurisdiction.
- Forecasted materials lead time.
- Labor availability by trade.
Teams that build permitting knowledge and materials forecasting into their bidding process hold an advantage over general contractors treating every project's procurement as a fresh problem.
How the Construction Industry Is Structured
The construction industry has three main sectors, per Wikipedia's structural breakdown: buildings, infrastructure, and industrial. Building construction, the largest of the three by market size, splits further into residential construction and non-residential buildings, while civil engineering construction covers roads, bridges, dams, and other civil works, and industrial construction covers factories and energy installations.
Design-bid-build remains the most common procurement method across the sector, though alternative delivery models are gaining ground on complex civil engineering projects where speed matters more than sequential handoffs.
Specialty trade contractors, electrical, plumbing, HVAC, and finishing trades, sit underneath the general contractors on most projects, and this layered structure is a major reason construction productivity per worker has declined by roughly half since the 1960s: coordination overhead across so many specialty trade contractors on a single site eats into the efficiency gains other industries captured through automation.
Construction companies that manage that coordination well hold a real competitive advantage over ones that treat each trade as a separate procurement exercise.
Global Construction Market Regional Breakdown
Copy these lines into an email, fill them in and send. I reply with scope and a price within 2 to 3 business days.
Open the emailAsia Pacific is expected to dominate growth in the construction market worldwide, accounting for roughly 54.5% of the construction market's expansion, per Technavio, driven by continued urbanization, public-works investment, and a construction industry in China and India that dwarfs most national markets outright.
South Korea shows up repeatedly in regional breakdowns as a smaller but fast-growing Asia Pacific construction market in its own right, distinct from the China-driven headline figures that dominate most global market summaries.
North America remains a large, mature share of the construction market, with the US construction industry historically the largest single national market even as its percentage share of global market growth trails Asia Pacific; North America's construction industry leans more heavily on renovation and asset replacement than on new housing compared with faster-growing regions.
Middle East construction activity, backed by government projects and continued economic development spending, keeps growing on the back of public-works and energy-sector work, with Middle East power plants and civil engineering construction megaprojects drawing many of the same major players named elsewhere in this report.
South America shows a more uneven construction market, with growth concentrated in specific countries, and South America's construction companies increasingly compete for the same international capital chasing Asia Pacific and Middle East infrastructure work.
South Korea's construction industry punches above its size relative to its economy, with South Korean firms among the more export-oriented major players for civil engineering construction and industrial plant construction abroad.
Together, Asia Pacific, North America, the Middle East, and South America account for most of the worldwide construction market's total, with Europe and Africa splitting a smaller remaining share, and China state construction activity alone shapes a meaningful share of the Asia Pacific regional total given the scale of domestic building construction and public-works programs underway.
Major Players and Key Companies
The construction industry's major players span a genuinely global set of key companies. China State Construction Corporation is among the largest by revenue and project volume, a scale advantage tied directly to the sheer size of the domestic Chinese construction market.
Alongside it, ACS, AECOM, Bechtel Corporation, Jacobs Solutions Inc, Larsen and Toubro Limited, and Skanska AB round out the list of major players that appear across nearly every analyst firm's key players section for this construction market report.

Want a key-players chart like this for the contractors in your region? Send the country.
Email a briefThese major players compete across different segments of the construction market: Bechtel Corporation and Jacobs Solutions Inc lean heavily into large-scale and industrial megaprojects, including power plants and large civil engineering construction, while Skanska AB and Larsen and Toubro Limited maintain a broader mix across building construction, infrastructure, and specialty project types.
Each of the largest names wins work for a different reason.
- Jacobs Solutions Inc: a reputation built on engineering-heavy public contracts.
- Skanska AB: a Nordic and North American building construction portfolio, a narrower regional footprint than Bechtel Corporation's more globally distributed industrial work.
- China State Construction Corporation: a domestic pipeline few other major players can match, a home-market density that lets China state construction outbid smaller rivals on unit economics alone.
Industry leaders at this scale compete on project management capability and balance-sheet strength as much as on raw construction capacity. A multi-year megaproject can strain even a well-capitalized construction company's working capital once project management slips.
Larsen and Toubro Limited and Jacobs Solutions have both pushed beyond pure construction into engineering consulting, spreading risk across more than one revenue line when a single construction market segment slows.
End User Segmentation: Residential, Commercial, and Industrial
Reading the construction market by end user clarifies why aggregate growth numbers can mislead: a residential end user segment cooling under high interest rates can sit alongside an industrial end user segment expanding rapidly on data center and energy demand, and a single blended growth figure hides that divergence completely.
Residential building remains the largest end user category by unit volume in most national markets, housing construction specifically accounting for the bulk of that residential total, while commercial and industrial end user categories are smaller in unit count but often larger in dollar value per project given the specialized building construction and civil engineering construction those projects require.
Business decision makers evaluating where to compete should treat end user segmentation as the first filter, ahead of geography, since a construction company's services and focus areas usually map to one or two end user categories.
A residential construction specialist and an industrial civil engineering construction firm are effectively different businesses that happen to share the word "construction," and market research that lumps them into one undifferentiated category obscures more than it reveals about either business's real demand.
Market Size, Market Share, and Market Opportunities
Market size figures for the construction industry vary by scope the same way most large industries do: a market total that includes every sector reads differently from a market size figure scoped to just building construction or just civil engineering construction.
Buyers doing real market research on this construction market report should always confirm if a headline market size includes residential construction, infrastructure, and industrial work together, or only one segment, before comparing two analyst firms' numbers as if they measured the same thing.
Market share within the construction industry is fragmented at the project level even where major players dominate headline market size rankings; most individual construction companies, outside the handful of major players named above, hold single-digit percentage market share nationally and compete on regional relationships and project management track record.
Market opportunities in the current cycle skew toward data center construction, expected to grow roughly 20% in 2026 on AI-driven demand, and toward the energy transition, where investment in renewable energy projects is driving new industrial work that did not exist at this scale five years ago.
Key Drivers Behind Construction Market Growth
Economic growth and continued economic development in emerging economies remain the steadiest key drivers behind construction market expansion, since rising incomes and urbanization both translate directly into new building construction and infrastructure demand.
Three more forces are pushing construction demand in the same direction:
- Public spending on infrastructure projects, and public-private partnerships specifically, provide a stable foundation for construction demand that holds up even when private housing construction cools, which is part of why the construction industry as a whole has avoided the sharper cycles some other sectors see.
- Investment in renewable energy projects is driving new industrial and infrastructure work across many countries at once, and demand for energy-efficient, low-carbon buildings is increasing as both regulation and corporate sustainability commitments push new building construction toward stricter environmental issues compliance. Investors track those commitments through raters such as MSCI and CDP, both covered in our ranking of ESG ratings providers.
- Decision makers at construction companies now weigh environmental issues alongside cost and schedule far more than they did a decade ago, a shift in decision making that shows up in how new projects get specified from the earliest design stage.
Market Challenges Facing the Construction Industry
High borrowing costs from elevated interest rates are pressuring developers across nearly every segment of the construction market, and a critical lack of skilled field leadership remains the biggest obstacle to growth industry-wide, per Deloitte, Construction Dive, and ABC Carolinas' construction industry outlooks.
Labor shortages drive up wages and intensify competition for skilled workers across the construction industry, compounding the field-leadership gap, since supervisors with years on the job are exactly the role hardest to backfill quickly.
Material prices fluctuate due to inflation and supply chain disruptions, per Deloitte and Construction Dive, adding volatility to project budgets that decision makers have to price into every bid.
High interest rates have been cooling residential construction and housing starts since 2022, per ConstructConnect and IBISWorld. That's the clearest headwind facing homebuilders, and it hasn't touched data centers or energy facilities, which keep expanding.
Historical Data and the Current Market Landscape
Historical data on the construction industry, going back to Wikipedia's figures on the global construction market's $10.8 trillion 2017 valuation, shows a construction market that has shifted meaningfully in recent years: worker fatalities in construction accounted for 20% of all private-industry deaths in 2019, per Wikipedia and MarketsandMarkets, a safety statistic that has pushed regulation and technology investment in equal measure across many countries.
That historical data also shows productivity per worker declining by roughly half since the 1960s, the single statistic industry leaders cite most often to explain why USD billion after USD billion of capital keeps flowing into construction technology. The software side of that spend, tools that compare 360 site captures against the schedule and the BIM model, is ranked in our construction intelligence platforms page.
Competition among contractors today reflects that history directly: general contractors and specialty trade contractors alike are under pressure to show strong growth in output without proportional headcount growth, and marketing strategies across the construction industry increasingly emphasize technology adoption and safety records alongside raw project completion numbers, since institutional clients now screen bidders on both.
Existing infrastructure replacement needs, aging bridges, water systems, and utilities across several regions, add a steady baseline of contractor competition that exists independent of new housing or commercial building cycles.
Technology and Market Trends Reshaping Construction
- The sector, region or trend to cover
- Regions, years and segments
- Where it runs: blog, white-label, gated or lead magnet
- Whose byline goes on it
- Deadline
- 2,500+ words, human-written
- Every figure linked to its source
- Yours to publish, under your name or none
- Hosting here for +$200, with your sponsored links
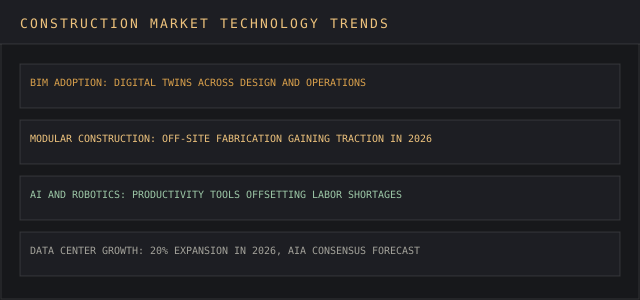
Increased adoption of AI, robotics, and 3D printing aims to improve productivity amid persistent labor shortages, and construction companies are increasingly adopting Building Information Modeling and digital twins to catch coordination errors before they become expensive field problems.
Construction productivity per worker has declined by roughly half since the 1960s, per Wikipedia and Technavio. Decades of manual processes never closed that gap.
Modular construction is expected to gain significant traction in 2026 as a way to improve efficiency, moving more building construction work off weather-dependent job sites and into controlled factory environments.
Data center construction stands out as one of the fastest-growing construction segments, expected to grow by roughly 20% in 2026 driven by AI-related demand, per the AIA Consensus Construction Forecast, alongside continued strong growth in healthcare and education sectors that the same forecast flags as unusually resilient parts of the construction market.
Sector Performance: Buildings, Infrastructure, and Industrial
The construction market's uneven growth pattern is one of the more important market trends for 2026: infrastructure, energy, and industrial facilities are outperforming traditional commercial development, per Turner & Townsend's Global Construction Market Intelligence report, a divergence that rewards construction companies positioned in the right sector over ones chasing overall construction industry growth.
Housing remains a massive absolute category within building construction even during a slower stretch, since population growth and existing infrastructure replacement needs do not pause for an interest-rate cycle.
Government projects and public-private partnerships continue anchoring civil engineering construction and public-works upgrades across many countries, giving construction companies a baseline that private commercial development lacks right now.
Companies spread across buildings, infrastructure, and industrial work weather market challenges better than ones concentrated in a single segment. Industry leaders make that resilience argument to investors weighing construction sector exposure.
Housing and Building Construction Demand
Housing remains the largest single line item inside building construction almost everywhere, and housing demand tracks population growth, household formation, and mortgage rates more tightly than any other construction market segment.
Development activity in housing has slowed since 2022 in markets with the sharpest interest-rate increases, but the underlying business case for new housing construction has not disappeared, it has shifted timeline: several regions facing housing shortages that predate the current rate cycle will need the same building construction eventually, once financing costs ease enough for development to pencil out again.
Compound annual growth rate projections for housing-focused building construction vary widely by country because permitting rules, land availability, and labor costs differ so much market to market, but the forecast period every major research house uses, typically five to ten years, consistently shows housing construction growth resuming even in markets currently cooling.
Construction companies with services spanning both housing and commercial building construction report more stable revenue through this cycle than housing-only specialists, since commercial and industrial demand has partly offset the residential slowdown.
Market Research Methods for Tracking the Construction Sector
Good market research on the construction sector combines historical data, current project pipelines, and forward-looking indicators like permitting volume and architectural billings, which tend to lead actual construction activity by several months.
Market research firms covering this construction sector, Technavio, Mordor Intelligence, The Business Research Company, and MarketsandMarkets among them, each publish their own market size and compound annual growth rate estimates, and buyers doing serious market research should expect those numbers to diverge the same way estimates diverge in any large, fragmented industry.
Economic growth forecasts feed directly into construction sector projections, since GDP growth, business investment, and government spending on infrastructure-adjacent programs all move construction demand in the same direction at once.
A construction company or investor tracking economic growth, compound annual growth rate estimates across research houses, and its own regional pipeline together gets a far more reliable read on where the construction market and the broader construction industry are headed than relying on any single data point in isolation. Focus on triangulating those three inputs.
Chasing the single most optimistic market size figure a vendor happens to publish leads nowhere, since the global construction industry's own history shows headline numbers get revised more often than most buyers expect.
Using Construction Market Data for Bidding and Strategy
Construction companies that treat market research as a standing capability make better decisions on which projects to bid and where to expand than ones that only buy a report once. Reading market size, market share, and market opportunities together tells a construction company where demand is shifting versus where a single large contract is skewing one year's data.
Key data on competitor positioning and industry leaders' project pipelines gives buyers a real edge over competitors relying only on their own bid history.
Three published sources remain the standard for tracking which construction projects are underway by sector and stage.
- Dodge MarketShare.
- The ACA national forecast.
- GlobalData's construction coverage, one of the broadest project-level data sources in the category, covered in our GlobalData review.
Our construction market intelligence guide covers how contractors and suppliers combine those feeds with their own data into a working market research practice.
Building Types and Market Size by Category
Not all buildings carry the same weight in construction market size data, and this report breaks the largest categories out individually because each behaves differently across a forecast period.
Single-family and multifamily residential buildings dominate unit counts, but office buildings, retail buildings, and industrial buildings often carry higher construction cost per square foot, which is why a market size figure weighted by dollars can look different from one weighted by number of buildings completed.
Institutional buildings, schools, hospitals, and government facilities, add a steady floor to building construction that tracks population and public budgets, and this report's healthcare and education data point reflects exactly that resilience.
Data center buildings are the fastest-growing category this report tracks, a narrow slice of total buildings by count but an outsized one by dollars given the specialized mechanical and electrical systems those buildings require.
Warehouse and logistics buildings expanded rapidly alongside e-commerce growth in prior years and have since moderated, one more case where a blended market size number hides both the strength and the weakness.
Companies bidding across multiple building types report needing separate cost models for residential buildings, commercial buildings, and industrial buildings, since labor mix, materials, and regulatory review differ enough between categories that a single estimating template rarely serves all of them well.
This construction market report's regional data reinforces the same pattern by geography: North America's buildings skew toward renovation of an aging stock, South America's buildings skew toward new residential development in a handful of expanding cities, and Middle East buildings skew toward large institutional and hospitality projects tied to national development plans.
South Korea's building construction sector, smaller in absolute terms than its larger regional neighbors, still reports meaningful growth in industrial and data-center buildings, echoing the same AI-driven demand pulling data center work up worldwide.
Buyers planning market entry should match their building type focus to a region's actual demand mix. No two markets want the same buildings in the same proportions.
What This Construction Market Report Covers
This report opened with global and residential market size, and every section since has tried to answer the question those headline numbers raise on their own: which part of the market is driving that market size, and which major players and companies are positioned to benefit.
The report's regional section showed where market size growth concentrates by geography; its companies section named the major players, China State Construction, ACS, AECOM, Bechtel Corporation, Jacobs Solutions, Larsen and Toubro, and Skanska AB, that account for a disproportionate share of major project volume even in a market this fragmented at the smaller end.
This report's building-type breakdown showed why a single market size figure hides more than it reveals: residential buildings, commercial buildings, and industrial buildings each carry different growth trajectories, and this report's data on data-center and healthcare buildings specifically shows where near-term growth is strongest.
This report's technology section covered the tools, BIM, modular methods, AI-assisted design, reshaping how companies deliver projects, and this report's market-challenges section covered the labor, financing, and materials pressures working against that progress at the same time.
Readers using this report for bidding decisions, investment screening, or market entry planning should treat every market size and growth figure here as a starting point for their own market research. This report, like every construction market report, ages the moment new project data lands.
Our companion construction market intelligence guide is built for exactly that ongoing tracking, updating the data sources this report cites as new figures publish, say the underlying change is a new building construction start, a residential permitting shift, or a fresh batch of buildings entering an already-tight regional pipeline.
One more note on scope before the FAQ: this report, like most published market size research, blends buildings of every size into national and regional totals, so a reader focused on a single city or a single building category should treat every figure here as a ceiling to adjust downward against local conditions.
The major players section named global companies for a reason: smaller regional companies rarely publish the kind of market size data this report relies on. Visible construction data skews toward the largest buildings and the largest companies.
Readers working at a smaller scale should discount the headline market size figures and lean harder on the regional and building-type breakdowns.
Key Players, Services, and Company Scale
Beyond the handful of major players this report has named repeatedly, the broader field of key players includes national and regional companies whose services rarely appear in a global market size report at all: local general contractors, specialty trade contractors, and design-build firms whose combined revenue across many countries likely rivals the largest single major player even though no analyst firm aggregates them cleanly.
This report's market size figures, drawn from Technavio, Mordor Intelligence, and the other research houses cited throughout, necessarily emphasize the largest key players because that data is easiest to collect and publish; the long tail of smaller companies offering the same core services is real but harder for any market report to size precisely.
Company scale matters most in how key players bid. Bechtel Corporation and China State Construction Corporation can self-finance a megaproject's working-capital needs; smaller companies chasing the same forecast period's growth need external financing lined up before bidding.
That gap keeps major players winning the largest civil and industrial contracts even in markets where hundreds of smaller companies compete for everything else.
This report's data consistently shows that gap widening every year as project sizes grow and financing requirements scale with them.
Residential Building Trends This Report Is Tracking
Residential building construction deserves its own closing note because this report's numbers on the residential segment move faster than the commercial and industrial figures elsewhere in this report.
Residential construction starts respond to interest-rate changes within a single quarter in most markets, while commercial and industrial building construction, tied to multi-year corporate and government planning cycles, lags rate changes by a year or more; this report's forecast period assumptions should be read with that lag difference in mind, especially for readers comparing residential and non-residential market size growth side by side.
Buyers using this report to time residential investment should watch permitting data and housing starts as leading indicators well before the market size headline this report cites gets revised to reflect them, since published market size and market share figures for residential building construction typically trail the underlying activity by a full reporting cycle.
Readers comparing North America's residential buildings pipeline against Asia Pacific's should expect that lag to differ by region too, since permitting and reporting speed for new buildings varies as much across countries as construction costs do.
This report's building construction figures should be read with that reporting lag in mind whenever the underlying buildings data crosses more than one country's statistical office: new buildings counted this quarter in one country's data may reflect buildings started two quarters earlier in another, and buildings permitted are not the same as buildings completed, a distinction that matters most for readers tracking residential and institutional buildings specifically.
Forecast Period Summary Across Regions
Pulling the regional threads of this report together over one forecast period: Asia Pacific is expected to add the most new buildings in absolute terms, North America is expected to add fewer new buildings but more renovation and asset-replacement services, and the Middle East and South America are each expected to post strong growth off a smaller base of existing buildings.
South Korea's expected contribution stays modest in absolute buildings count but outsized in export-oriented civil engineering services, a pattern this report's regional section flagged earlier and repeats here because it shapes how major players allocate capital across regions differently than raw market size rankings suggest.
Expansion of building construction services, design, engineering, financing, and facilities services layered onto pure building work, is one of the clearer trends this report tracks across every region: major players increasingly sell services alongside buildings, since services carry better margins and steadier revenue than construction contracts that end the day the last building is handed over.
Trends in North America and South America both point toward more bundled services, even as the underlying pace of new buildings diverges sharply between the two regions, and this report expects that services-led expansion trend to continue through the rest of the current forecast period regardless of which region's building count grows fastest.
Delivered for your site and your byline. Hosting here is optional.
FAQ
How big is the construction market?
The global construction market was valued at $10.8 trillion in 2017 and is projected to reach $14.8 trillion by 2030, growing by $1,386.4 billion from 2025 to 2030 alone, per Wikipedia, Technavio, and Mordor Intelligence, all cited throughout this report.
Total 2026 spending is projected near $2.2 trillion, per Burns & McDonnell and Corfix, figures this report treats as directional given how widely construction market size estimates vary by source.
Who are the major players in construction?
China State Construction Corporation, ACS, AECOM, Bechtel Corporation, Jacobs Solutions Inc, Larsen and Toubro Limited, and Skanska AB are the key companies this report and most analyst firms name most often across their major players and key players sections, though thousands of smaller companies and specialty trade contractors handle the bulk of residential and light-commercial buildings this report also tracks.
Is construction slowing down in 2026?
Unevenly, per every source this report cites. Residential construction has cooled since 2022 under high interest rates, but data center construction, energy infrastructure, healthcare, and education segments are all showing strong growth, so this report recommends segment-level analysis over a single headline growth number for any building type or region.
Sources: Wikipedia construction industry overview; Technavio construction market analysis; Mordor Intelligence; The Business Research Company residential building construction market report; MarketsandMarkets building and construction research; Deloitte, Construction Dive, and ABC Carolinas construction industry outlooks; AIA Consensus Construction Forecast; Turner & Townsend Global Construction Market Intelligence; ConstructConnect and IBISWorld, 2025 to 2026.
Contech vendors, building suppliers and construction consultancies use reports like this one in bids and investor material.
A report on your topic for a blog page, gated content or a lead magnet.
Written for your client and published under their brand, with my name left off.
Your report on marketintelligencetools.com, with 2 to 3 CTAs carrying your sponsored links.
Default terms: the report is yours to publish, and I keep the right to republish it on this site behind a gate, outside Google's index.