SMS marketing statistics 2026: 89% of consumers opt in, campaign texts get 5.6% clicks
 By Jan Suski. I go deep on every review, checking every number against its source and digging up details other coverage misses, a habit from six years of SEO and link building for tech companies. Bylines at Surfer, Brand24, and Senuto. How the scoring works.
The numbers SMS reach, engagement and costs, checked 7 October 2026
Automated texts converted at more than six times the campaign rate on Omnisend's 2025 data, measured across 321 million messages from 150,000 brands.
U.S. text volume grew by 42 billion messages in 2024 while UK volume fell 21.3% in a year, so the two markets are moving in opposite directions.
The two research houses that size SMS marketing alone land $240 million apart; houses sizing all business texting land five times higher.
Nine in ten U.S. consumers have signed up for texts from a business, and the average campaign text gets clicked by 5.6% of the customers who receive it. EZ Texting's 2026 survey of 959 U.S. consumers put the opt-in share at 89% in April 2026. Klaviyo's SMS benchmarks, drawn from more than 183,000 customer accounts and updated September 24, 2026, put the campaign click rate at 5.6% and the automated-flow rate at 9.65%.
Read rates come from Mobilesquared, the UK research firm that has measured SMS engagement since 2010. Its 2022 data put the share of texts read at 55% and the share viewed at 100%.
This report collects 2026 SMS marketing stats on reach, consumer opt-in, click & conversion rates, market size, sending costs and TCPA rules, each dated and linked to the body that published it. It's written for ecommerce teams setting an SMS marketing strategy, marketers weighing text message marketing against email marketing, and analysts sizing the market.
SMS marketing statistics on reach: 98% of U.S. adults own a mobile phone
Almost every American adult can receive SMS messages on a mobile phone. Pew Research Center found 98% of U.S. adults own a cellphone and 91% own a smartphone, from a survey of 5,022 adults fielded February 5 to June 18, 2025. A text message needs no app, so the 7-point gap between those two figures is reach that RCS, WhatsApp and app push notifications miss, since all three need a smartphone.
The carriers' trade body counts the traffic. CTIA's 2025 Annual Survey, published September 10, 2025, recorded nearly 2.2 trillion SMS and MMS messages in 2024, 42 billion more than in 2023 and more than any year except 2020. Its 2026 highlights, released September 10, 2026, reported 603 million wireless connections in 2025, about 1.8 for the average American.
Worldwide, GSMA's Mobile Economy 2026 counts 5.8 billion unique mobile subscribers in 2025, around 70% of the global population, who rely on mobile devices to stay connected. The same report puts more than 3 billion people, just under 40% of the world, outside mobile internet use. Smartphone users and internet users trail the count of phones that take text messages by that margin.
UK text message volumes fell 21.3% in a year
Britain is heading the other way, a decline that stays under the radar in most SMS marketing trends roundups. Ofcom's telecoms market data, published 23 July 2026, shows UK mobile messages fell 1.25 billion, or 21.3%, to 4.61 billion in the first quarter of 2026. Q4 2025 was down 26.5% and Q3 2025 down 24.3%: three straight quarters of decline above 20%.
Ofcom publishes nearly four months after each quarter closes, so its series tracks the market's direction, and a sender's real time analytics come from its own platform.
Consumer opt-in: 85.6% to 89% receive text messages from businesses
Two 2026 vendor surveys put opt-in in the high 80s. EZ Texting polled 959 U.S. consumers from January 20 to 23, 2026 and found 89% have signed up to receive text messages from a business. SimpleTexting's 2026 report, whose data collection ran January 7 and 8, 2026 across 1,000 consumers, put the share at 85.6%.
What the average person in EZ Texting's sample said about texts from businesses:
- 87% of Americans check a new text within 15 minutes, and 32% check immediately.
- Text messages beat email, phone and social media as the preferred channel for 9 of the 10 message types the survey tested.
- 46% of customers prefer texting when they contact a business, ahead of the 43% who prefer phone calls.
- 67% are more likely to buy from a business whose texts they subscribe to, and 64% are more likely to click or buy when a promotional text includes an image.
- 54% are comfortable with automated text assistants.
- 40% name the frequency of SMS marketing messages as the top reason they opt out.
SimpleTexting's consumer numbers line up: 74% check notifications within five minutes, and 33% prefer texting a business with questions, against 28% for email and 21% for live chat. Both surveys rank texting first for two-way messaging with a business. EZ Texting's 54% comfort figure for automated text assistants pairs with the usage data in our chatbot statistics report.
EZ Texting's 67% purchase-intent figure is a positive perception measure, self-reported to a vendor that sells texting software. The 40% frequency figure is the red flag for any marketing strategy built on volume.
Postscript's 2025 benchmarks, from more than 17,000 Shopify stores, show a median of about 1.91 SMS marketing messages per subscriber a month, so the average person on a store's customer contact list hears from it about twice a month. The median store keeps 93.1% of SMS subscribers after 30 days; our customer retention statistics report covers retention in other channels.
Capture is the weak spot. The median Postscript store turns about 1.06% of new orders into SMS subscribers, so roughly 99 in 100 customers check out without opting in.
SMS click-through rates and conversion rates by publisher
Platform benchmarks measure what customers do, and three vendors publish their own. Klaviyo and Omnisend split broadcast campaigns from automated flows, which fire when existing customers take an action such as abandoning a cart. Postscript reports flow results by type.
| Publisher and sample | Metric | Campaigns | Automated flows |
|---|---|---|---|
| Klaviyo, 183,000+ customers, updated Sept. 24, 2026 | SMS click rate | 5.6% | 9.65% |
| Klaviyo | SMS conversion (order) rate | 0.27% | 1.9% |
| Omnisend, 321 million texts from 150,000 brands, 2025 | SMS click-through rate | 12.39% | 20.34% |
| Omnisend | SMS conversion rate | 0.12% | 0.77% |
| Omnisend | Revenue per message | $0.15 | $0.74 |
| Postscript, 17,000+ Shopify stores, 2025 | Back-in-stock click-through rate | Not split | 36% to 58% |
| Klaviyo, same sample | Email click rate, for comparison | 1.69% | 5.58% |
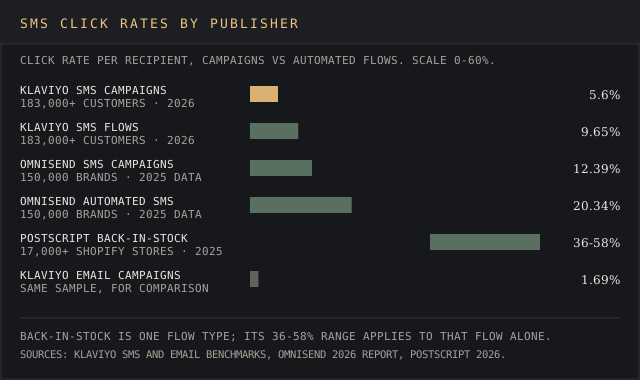
Klaviyo's top 10% of customer accounts reach 10.44% on campaigns and 16.6% on flows, a fair ceiling for an average click through rate target. Omnisend's campaign rate runs about twice Klaviyo's. The two count different merchant bases, 183,000-plus Klaviyo customers against 150,000 Omnisend brands, so compare each sender against one platform's numbers.
Automated texts against broadcast SMS campaigns
Automation is where the money sits. Omnisend's automated texts converted at 0.77% in 2025, more than six times the 0.12% campaign average, and earned $0.74 per send against $0.15. Klaviyo found flows make up 7.6% of SMS messages sent and drive 45.2% of SMS revenue.
A product launch announcement or promotional offers go out to every customer on a list as a campaign; a back-in-stock alert fires only for customers who asked for it. Postscript's back-in-stock flows hit 36% to 58% click-through rates and 7% to 13.8% conversion rates in 2025. Postscript's sample is Shopify stores only, the merchant base our Shopify statistics report sizes.
Brands that segment a target audience before sending marketing campaigns can run SMS flows from the same profile they use to email customers. Our ranking of marketing segmentation software covers platforms that send marketing SMS, email & push from one customer record.
SMS benchmarks by industry
Klaviyo publishes revenue per recipient from its ecommerce customers in 12 categories. Six of them:
| Industry | Campaign revenue per recipient | Flow revenue per recipient |
|---|---|---|
| Automotive | $0.35 | $6.15 |
| Hardware and home improvement | $0.26 | $4.57 |
| Home and garden | $0.32 | $3.74 |
| Electronics | $0.28 | $3.48 |
| Health and beauty | $0.32 | $2.09 |
| Food and beverage | $0.34 | $1.83 |
Campaign revenue per recipient barely moves, $0.26 to $0.36 across all 12 categories. Flow revenue spans $1.83 to $6.15, so the industry gap in SMS marketing campaigns comes almost entirely from automation.
Against email marketing and other channels, SMS draws more clicks per recipient. Klaviyo's email benchmarks, measured on the same customer base, show a 1.69% campaign click rate against 5.6% for SMS, about 3.3 times higher engagement per send. Email open rates on those campaigns run 31%; our email marketing statistics report covers how open rates are counted.
What businesses report: 4.99 times higher odds of marketing success
SimpleTexting's business survey is the source behind most claims about SMS return. It polled 400 U.S. business owners and digital marketing managers on January 7 and 8, 2026 and published the results May 26, 2026. Every figure is self-reported to a texting-software vendor:
- Businesses using SMS to text customers have 4.99 times higher odds of reporting digital marketing success than businesses that don't.
- 76% agree text message marketing is an effective way to drive revenue.
- Most businesses attribute 21% to 30% of their revenue to SMS.
- 71% say AI has improved their SMS marketing success.
- 66.2% report an average SMS click-through rate of 20% or higher.
The 66.2% figure sits well above platform data. Klaviyo measures a 5.6% campaign average and 16.6% for its top 10% of flows, so most self-reported rates of 20% exceed what the sending platforms record.
The 71% AI figure comes from the same self-reported survey, and our AI statistics report tracks adoption across the wider economy. Businesses that offer SMS to reach customers and increase sales should treat the 4.99 figure as a correlation from one survey of 400 firms.
Black Friday SMS and mobile commerce
Peak season shows where spend on SMS marketing campaigns is heading. Attentive's Cyber Week 2025 data, covering November 24 to December 1, 2025 across more than 8,000 brands, counted 5.7 billion SMS and email messages, up 46% year on year, and nearly $2 billion in revenue. SMS revenue per brand grew 42%, and customer orders placed from a text averaged $143, up 13%.
Klaviyo's BFCM 2025 release of December 2, 2025, filed with the SEC, reported text revenue up 25% as text send volume rose 34% over the five days from Thanksgiving to Cyber Monday. Volume outpaced revenue by 9 points, so each text earned a little less than in 2024. Klaviyo also found customers who received both email and text placed 11% more orders.
Smartphone usage carries the checkout too. Adobe tracked $257.8 billion in U.S. online holiday spending from November 1 to December 31, 2025, and 56.4% of online transactions ran through a smartphone. Our Black Friday statistics break down the peak days.
SMS marketing market size: $14.15 billion to $74.8 billion, depending on scope
Market size is the most contested of all SMS marketing statistics, because the five houses below don't size the same thing.
| Research house | Market defined | Base-year value | Forecast | CAGR | Published |
|---|---|---|---|---|---|
| Mordor Intelligence | SMS marketing services | $14.15B (2025) | $26.05B (2031) | 10.77% | Aug. 3, 2026 |
| Fortune Business Insights | SMS marketing | $14.39B (2025) | $36.62B (2034) | 10.93% | Sept. 14, 2026 |
| The Insight Partners | A2P SMS | $72.48B (2024) | $91.59B (2031) | 3.4% | Feb. 12, 2025 |
| Grand View Research | A2P messaging | $74.3B (2025) | $125.8B (2033) | 7.2% | June 2026 |
| IMARC Group | A2P messaging | $74.8B (2025) | $102.0B (2034) | 3.4% | June 5, 2026 |
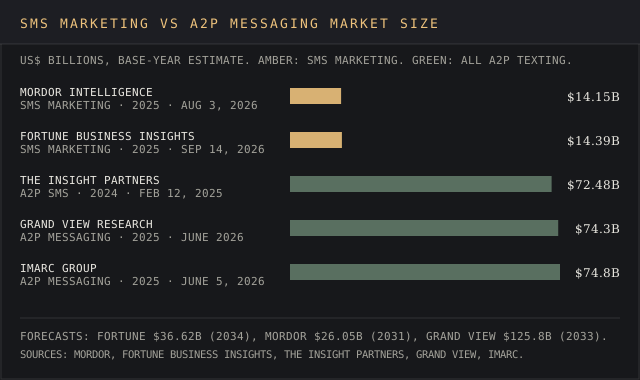
The two houses sizing SMS marketing alone differ by a hair's breadth: $14.15 billion and $14.39 billion for 2025. Both name the same five vendors at the top, Twilio, Sinch, Infobip, Vonage and Route Mobile, and Fortune gives Twilio 14% of the market and Sinch 11%.
Large enterprises take the lion's share, 61% of spend in Fortune's model and 60.53% in Mordor's. Retail and e-commerce is the largest end-user industry at 27% (Fortune) and 29.33% (Mordor), and Mordor puts North America first with 32.31% of revenue against Fortune's 26%. Mordor expects small and medium-sized businesses to grow fastest, at 14.51% a year to 2031, a segment our small business statistics report counts.
Why the published SMS marketing estimates diverge
The fivefold gap comes from scope. Mordor and Fortune size SMS marketing services. Grand View, IMARC and The Insight Partners size application-to-person (A2P) messaging, which counts every text a business system sends: one-time passcodes, appointment reminders, fraud alerts and delivery notices sit alongside marketing SMS.
Growth rates split along the same line. The marketing-only houses forecast 10.77% and 10.93% a year, while IMARC and The Insight Partners forecast 3.4% for all A2P traffic and Grand View 7.2%. That spread follows from scope: IMARC lists one-time-passcode demand among its growth drivers and gives Asia-Pacific 44.5% of revenue, and Grand View names promotional campaigns as its fastest-growing application.
Base years and horizons differ too: The Insight Partners' $72.48 billion is a 2024 figure, and forecasts end anywhere from 2031 to 2034.
Recycled SMS marketing stats and where they trace
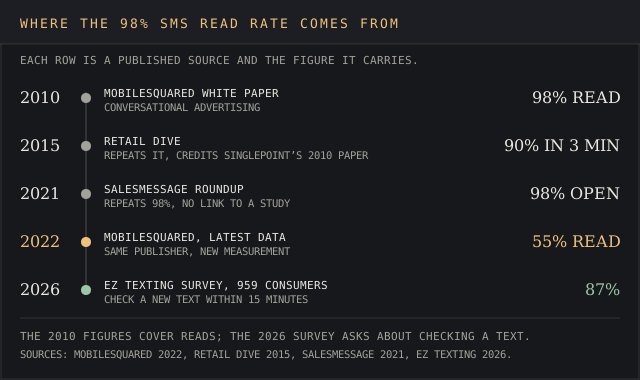
The most repeated SMS marketing statistics on open rates and response rates come from one 2010 white paper or from roundups that link no study. The 98% read rate and the 90%-within-three-minutes figure both trace to Conversational Advertising, a 2010 white paper from Mobilesquared. Straight from the horse's mouth, founder Nick Lane wrote on August 24, 2022 that the firm's latest data shows 55% of SMS messages read and 100% viewed.
Retail Dive repeated the three-minute figure in June 2015, crediting SinglePoint's 2010 Conversational Advertising whitepaper. By 2021 the figures had moved into vendor roundups with no link at all, and that chain of copies is how most marketers hear them on the grapevine.
| Statistic as quoted | Earliest traceable source | Date |
|---|---|---|
| SMS open rates of 98% | Mobilesquared, Conversational Advertising white paper (98% read); Mobilesquared's 2022 figure is 55% of messages read | 2010 |
| 90% of text messages are read within 3 minutes | Mobilesquared and SinglePoint, Conversational Advertising | 2010 |
| 45% average response rate for SMS against email response rates of 6% | Credited to Statista in a Salesmessage roundup, no link to a study | Feb. 12, 2021 |
| SMS response rates run 209% higher than phone, email or Facebook | Credited to Mobile Xco in the same roundup, no link; RingCentral cites TechJury, a compilation | 2021 |
| Customers respond to a text in 90 seconds | Credited to SMS Comparison in the same roundup, no link | 2021 |
| Retail SMS gets 6 to 8 times the engagement rates of email | Credited to Retail Dive in the same roundup, no link | 2021 |
| SMS coupons are redeemed 10 times more than printed coupons | Same roundup, no study linked; the claim compares a promotional code sent by text with paper coupons | 2021 |
| 6 billion people will text by 2025 | Credited to Statista, MobileMonkey and SlickText in the same roundup, no links | 2021 |
What SMS costs: per-message prices, carrier fees and 10DLC registration
What makes SMS cheap is a sub-cent base rate, and the devil's in the details of the carrier fees. Twilio charges $0.0083 per outbound U.S. SMS segment of up to 160 characters, then passes through a carrier fee: $0.0035 for AT&T, $0.0045 for T-Mobile and $0.005 for Verizon. An MMS costs $0.022 before carrier fees, and RCS rich text is priced at the same $0.0083 as SMS.
Registering a 10-digit long code for business texting adds one-time and monthly fees, per Twilio's A2P 10DLC fee schedule updated August 1, 2025:
- Brand registration: $4.50 for sole proprietors and low-volume standard brands, $46 for standard brands with secondary vetting included.
- Campaign vetting: $15 per campaign.
- Monthly campaign fee: $10 for standard campaigns, $2 for sole proprietors, $1.50 for low-volume mixed use.
Twilio blocks SMS messages sent to U.S. numbers from a 10DLC number that isn't tied to an approved A2P 10DLC campaign (error 30034). Registration is the price of delivery, and delivery tops out below 100%: Omnisend's campaign texts reached 96.6% deliverability in 2025 and automated texts 92.8%.
For 10,000 texts to Verizon customers, the math comes to $83 in Twilio fees plus $50 in carrier fees, $133 in all. The $4.50 brand fee and $15 vetting fee are a drop in the bucket next to $10 a month per campaign, $120 a year. At about 1.3 cents a text message, sending messages is cost effective against Omnisend's $0.15 average campaign revenue per send.
Sales teams using SMS add it as one step in an outbound sequence. lemlist's Multichannel plan bundles SMS with LinkedIn steps and a call dialer, covered in our lemlist review, and our cold calling statistics measure the phone side of those sequences.
TCPA rules and the legal risk in SMS marketing messages
Texting without consent lands a sender in hot water fast. Under the Telephone Consumer Protection Act, 47 U.S.C. § 227(b)(3) lets a recipient recover $500 per violation, and a court can triple that to $1,500 when the violation is willful or knowing. A 10,000-message send without consent carries $5 million in statutory exposure at the base rate.
The FCC rules that govern SMS marketing messages in 2026:
- Quiet hours: 47 CFR 64.1200(c)(1) bars telemarketing to residential subscribers before 8 a.m. or after 9 p.m. local time.
- Opt-out: recipients can revoke consent by any reasonable method, including replying stop or unsubscribe, and senders must honor it within 10 business days.
- Revoke-all: the rule that an opt-out from one message type covers all future robotexts on unrelated matters was waived again on January 6, 2026 in FCC order DA 26-12, with compliance now due January 31, 2027.
- One-to-one consent: the Eleventh Circuit vacated the FCC's rule limiting consent to one identified seller on January 24, 2025, in Insurance Marketing Coalition v. FCC.
The revoke-all date has moved twice, from April 11, 2025 to April 11, 2026 and then to January 31, 2027, so it isn't set in stone.
Fraud shapes how carriers treat the channel. The FTC reported that consumers lost $470 million to scams that started with a text in 2024, five times the 2020 figure. FTC testimony on March 25, 2026 named a text message as the top reported contact method for fraud in 2025, a year with $15.9 billion in reported losses. That traffic is what carrier spam filters and 10DLC registration exist to catch, and legitimate SMS messages share the inbox with it.
Every publisher behind these SMS figures, and the engagement numbers no carrier releases
Consumer surveys and platform benchmarks: eztexting.com (2026 Consumer Texting Behavior Report, 14 April 2026), simpletexting.com (2026 texting and SMS marketing report, 26 May 2026), klaviyo.com (SMS and email benchmarks, updated 24 September 2026), omnisend.com (13 July 2026) and postscript.io (2026 benchmarks, 2025 data).
Reach and volume: pewresearch.org (mobile fact sheet, 2025 survey), api.ctia.org (Annual Survey highlights, 10 September 2025 and 10 September 2026), gsma.com (The Mobile Economy 2026) and ofcom.org.uk (telecoms market data update, 23 July 2026).
Market size: mordorintelligence.com (3 August 2026), fortunebusinessinsights.com (14 September 2026), grandviewresearch.com (June 2026), imarcgroup.com (5 June 2026) and prnewswire.co.uk (The Insight Partners, 12 February 2025). Peak season: businesswire.com and attentive.com (Cyber Week 2025), sec.gov (Klaviyo BFCM release, 2 December 2025) and news.adobe.com (2025 holiday season, January 2026).
Costs and law: twilio.com and support.twilio.com (US SMS pricing, A2P 10DLC fees updated 1 August 2025, error 30034), law.cornell.edu (47 U.S.C. 227), ecfr.gov (47 CFR 64.1200), docs.fcc.gov (DA 26-12, 6 January 2026), media.ca11.uscourts.gov (24 January 2025), ftc.gov (16 April 2025 release; testimony of 25 March 2026), cisa.gov (18 December 2024) and signal.org (April 2016).
Figure trail: mobilesquared.co.uk (24 August 2022), retaildive.com (June 2015), salesmessage.com (12 February 2021) and ringcentral.com.
Every figure was checked against its source on 7 October 2026. Carriers publish message volumes and no read or response rate for marketing texts, so engagement on this page is measured as clicks and orders inside each platform's own customer base.
Frequently asked questions
How much does SMS marketing cost?
Per message, using SMS in the U.S. costs $0.0083 on Twilio plus a $0.0035 to $0.005 carrier fee, about 1.2 to 1.3 cents. Registration adds $4.50 to $46 per brand, $15 per campaign vetting and $1.50 to $10 a month per campaign.
What are the SMS benchmarks by industry?
Klaviyo publishes revenue per recipient for 12 ecommerce industries. Automotive leads flows at $6.15 and food and beverage trails at $1.83, while campaign revenue sits between $0.26 and $0.36 in every category.
What is the average response rate for SMS?
The 2026 platform benchmarks measure clicks: 5.6% for Klaviyo's campaign texts, 9.65% for its automated flows and 12.39% for Omnisend's campaigns. The 45% response figure on SMS marketing stats pages traces to a 2021 roundup that credits Statista without a link.
Is SMS safer than WhatsApp?
WhatsApp encrypts messages end to end; SMS doesn't. CISA's December 18, 2024 guidance states that SMS messages are not encrypted and tells users not to rely on SMS as a second authentication factor. WhatsApp has encrypted every message between users since April 2016, when Signal announced its protocol integration was complete.
What are some interesting statistics about digital marketing?
Our sibling reports cover the other forms of digital marketing: social media statistics count 5.79 billion users, content marketing statistics found 92.4% of bloggers use AI, and B2B marketing statistics track budgets & buyers. For SMS, the 2026 figure to test against your own list is Omnisend's 0.77% automated conversion rate against 0.12% for campaigns.
Bottom line
SMS marketing statistics in 2026 run on two sets of numbers. The measured set: 89% of consumers opted in, 5.6% to 12.39% campaign click rates, 0.12% to 0.27% campaign conversion and 0.77% to 1.9% for automated flows. The recycled set, 98% open rates, 90% read in three minutes and 45% responses, dates to 2010 or to unlinked 2021 roundups.
Build a marketing strategy on the measured set. A U.S. text costs about 1.3 cents after carrier fees, automated flows earn several times what broadcasts do, and customers opt out over frequency. The TCPA's $500-per-message exposure and the January 31, 2027 revoke-all deadline belong in any plan for marketing campaigns that adds volume.
Market sizing depends on the house: about $14 billion for SMS marketing, $72 billion to $75 billion for all business texting. Match the scope to the question before quoting either.