Amazon statistics 2026: revenue, Prime, sellers, AWS and market share
 By Jan Suski. I go deep on every review, checking every number against its source and digging up details other coverage misses, a habit from six years of SEO and link building for tech companies. Bylines at Surfer, Brand24, and Senuto. How the scoring works.
The numbers Amazon.com Inc., checked 16 October 2026
AWS produced 21% of Amazon's Q2 2026 sales revenue and 60% of its operating income.
Advertising grew 22% in 2025, ahead of AWS at 20%, and reached $76.1 billion over the 12 months to June 2026.
Amazon's share of U.S. online spending sits near 40% by eMarketer's count, against e-commerce's 17.1% share of all U.S. retail.
Amazon.com Inc. booked $716.9 billion of net sales in 2025, up 12% on 2024, and $77.7 billion of profit, according to its fourth-quarter 2025 earnings release (5 February 2026). In Q2 2026 Amazon generated $200.6 billion of sales revenue, its first quarter above $200 billion. The 2025 total edged past the $713.2 billion Walmart reported for its latest fiscal year.
This page collects the Amazon statistics analysts, sellers and investors quote most: revenue by segment and by revenue line, advertising, Prime membership, third-party sellers, AWS and its cloud computing market share, traffic, employees and capital spending. Every figure comes from Amazon's Form 10-K, its quarterly releases and aboutamazon.com, or from the named research house that published it.
Where trackers disagree, as they do on Prime member counts, seller counts and Amazon's share of U.S. e-commerce, the page names each publisher and shows which unit it counts. Many Amazon statistics in circulation trace back to a 2021 shareholder letter or to seller signup counts; those get flagged as such.
It's written for sellers sizing the channel, investors checking a quarter and marketers pricing Amazon ads, who need a sourced number for a model or a pitch deck. The numbers matter because Amazon sets the fees and ad prices that 1.65 million active sellers work under.
Amazon revenue and net income in 2025 and 2026
Amazon revenue grew from $638.0 billion of net sales in 2024 to $716.9 billion in 2025. Net sales are Amazon's total revenue; the company reports no separate top line. Operating income rose from $68.6 billion to $80.0 billion and net income from $59.2 billion to $77.7 billion, per the Q4 2025 release. Over the past few years growth has held near 11% to 12% a year: 2024 net sales rose 11%, per the Q4 2024 release, and 2025 rose 12%.
The first half of 2026 ran hotter. Q1 2026 net sales were $181.5 billion, up 17%, per the Q1 2026 release filed with the SEC. Q2 added $200.6 billion, up 20%, with operating income of $27.5 billion.
Q2 2026 net income came to $62.6 billion. Read between the lines before quoting it: $53.4 billion of that was non-operating income, mainly gains on Amazon's Anthropic investments. Operating income is the cleaner measure of how the business performed.
Amazon reports sales revenue in seven lines. The table below sums the four 2025 quarters from the supplemental tables; the totals reconcile to the $716,924 million Amazon reported.
| Revenue line | 2025 net sales | Share of total | Q2 2026, growth y/y |
|---|---|---|---|
| Online stores | $269.3 billion | 37.6% | $70.4 billion, +15% |
| Third-party seller services | $172.2 billion | 24.0% | $46.8 billion, +16% |
| AWS | $128.7 billion | 18.0% | $42.2 billion, +37% |
| Advertising services | $68.6 billion | 9.6% | $19.8 billion, +26% |
| Subscription services | $49.6 billion | 6.9% | $13.7 billion, +12% |
| Physical stores | $22.6 billion | 3.1% | $5.8 billion, +4% |
| Other | $5.9 billion | 0.8% | n/a |

Online stores is the line people picture when they think of Amazon sales: products Amazon sells itself as a first-party retailer, plus digital media. It produced the lion's share of revenue at $269.3 billion. Third-party seller services counts only the commissions, fulfillment and shipping fees Amazon charges sellers on the Amazon marketplace; the value of the goods those independent businesses move is far larger and stays out of Amazon's net revenue.
Physical stores, which include Whole Foods Market and Amazon Fresh locations, are a drop in the bucket at 3.1% of net sales. Amazon's online stores line grew 15% in Q2 2026, faster than the physical stores line at 4%.
Amazon sales by segment: North America, International and AWS
Amazon reports three operating segments. In 2025 North America produced $426.3 billion of net sales (up 10%), International $161.9 billion (up 13%) and AWS, Amazon Web Services, $128.7 billion (up 20%), per the 2025 Form 10-K. North America carried 59.5% of Amazon revenue by segment.
Profit runs the other way. In Q4 2025 North America earned $11.5 billion of operating income, International $1.0 billion and AWS $12.5 billion. By Q2 2026 AWS operating income had reached $16.6 billion against $9.1 billion for North America and $1.7 billion for International.
- North America, Q2 2026: $116.2 billion of net sales, up 16%
- International, Q2 2026: $42.2 billion, up 15%
- AWS, Q2 2026: $42.2 billion, up 37%, its fastest growth in 18 quarters
- Amazon Business: a $60 billion annualized gross sales run rate, per the Q2 2026 release
Amazon's Q3 2026 guidance calls for net sales of $197.0 billion to $202.0 billion, up 9% to 12%. The release says Prime Day timing trims that growth by nearly 400 basis points, because the 2026 event fell in Q2 while the 2025 event sat in Q3. Keep an eye on that base effect when Q3 results arrive.
Amazon advertising revenue
Amazon generated $46.9 billion of advertising revenue in 2023, summed from the quarterly figures in the Q4 2023 earnings release, about 24% above 2022. It reached $56.2 billion in 2024 per the Q4 2024 release, then $68.6 billion in 2025, a 22.1% gain.

Advertising has been on a roll. Q2 2026 brought $19.8 billion of advertising services revenue, up 26% from $15.7 billion a year earlier. Amazon ads sit on the store's search engine results and product listings, and inside Prime Video.
The Prime Video ads page claims a 315 million-plus average monthly ad-supported reach worldwide, measured across 2025 by Amazon's internal data. Those ads play on connected TV devices as well as phones and browsers.
For comparison with the rest of the ad market, the site's advertising industry statistics report sizes total U.S. and global ad spend, and the PPC statistics page covers sponsored search pricing. Amazon advertising is retail media: advertisers pay to appear next to the purchase button. Amazon sellers buy Amazon ads to increase sales on new listings, which is why many treat ad spend as a cost of selling on Amazon's platform.
Amazon Prime subscribers, membership and subscription revenue
Amazon says Amazon Prime has "more than 200 million paid members worldwide," a figure repeated in its Prime Day 2025 release. Amazon first reported that mark in Jeff Bezos's 2020 letter to shareholders, published April 2021. The count has been parked at "200 million" for over five years since, which is par for the course for a company that discloses Prime only in round numbers.
A U.S. Amazon Prime membership costs $14.99 a month or $139 a year. The same release lists free Prime shipping on more than 300 million items and Same-Day Delivery in more than 140 U.S. metro areas. Amazon Prime members also get Amazon Prime Video and Amazon Music with 100 million songs ad-free, per the same release.
Amazon subscription revenue reached $49.6 billion in 2025, up 12% from $44.4 billion in 2024. That line counts Prime fees plus audiobook, digital video, e-book, music and other subscriptions, so dividing it by 200 million doesn't produce a Prime price. Q2 2026 subscription services came to $13.7 billion.
Delivery speed is the main product an amazon prime subscription sells. Amazon ships more items same day each year: nearly 70% more in the U.S. in 2025 than in 2024, per the Q4 2025 release, and nearly 100 million Amazon customers used Same-Day Delivery. In the first half of 2026 it delivered over 40% more items same day or overnight.
Prime Video and Amazon Music
Amazon Prime Video and Amazon Music draw on one content budget: total video and music expense reached $22.4 billion in 2025, per the 2025 Form 10-K. That figure covers licensed and produced video plus music, so the "Prime Video content spend" number quoted on many statistics pages also includes Amazon Music. Apple Music advertises the same catalog size, over 100 million songs, at $11.99 a month for an individual plan.
Streaming rivals' budgets and subscriber counts sit in the site's streaming statistics report.
Amazon Prime Day sales
Amazon publishes no dollar total for Prime Day. Its 2025 release reported record sales and more items sold than any previous four-day period with a Prime Day event; independent sellers sold a record number of items too. The dollar figures that circulate belong to Adobe Analytics and cover all U.S. retailers:
- Prime Day 2024 (16 to 17 July): $14.2 billion of U.S. online sales, up 11.0%, per Adobe Analytics; mobile devices drove 49.2% of online purchases
- Prime Day 2025 (8 to 11 July): $24.1 billion across four days, up 30.3%, per Adobe
Adobe's totals include Walmart, Target and every other site running a rival event the same week, so they measure the Amazon Prime Day sale season across U.S. online shopping and never Amazon's takings. Adobe tracks Cyber Week the same way; the Black Friday statistics report uses its holiday figures.
Amazon sellers and the Amazon marketplace
Third party sellers handle most of the volume in the Amazon store. Independent sellers accounted for 61% of worldwide paid units in Q4 2025 and 60% in Q1 2026, per the supplemental tables. Amazon sells its own inventory alongside them, so the other 39% of Q4 2025 units were first-party. Amazon's 2025 Small Business Empowerment Report (30 April 2026) says selling partners account for more than 60% of sales in Amazon's store.
The same report says more than 75,000 independent sellers passed $1 million in sales in 2025, up 36% from 2024, and average annual sales per U.S. independent seller topped $375,000. Most of those are small and medium-sized businesses, and Amazon credits them with supporting more than 2 million U.S. jobs.
How many Amazon sellers are there? Marketplace Pulse counted 1.65 million active sellers on the Amazon marketplace at the end of 2025, down from 2.4 million in 2021, in its January 2026 analysis. Only 165,000 new sellers listed a first product in 2025, the lowest total since it began tracking in 2015 and 44% below 2024. China supplied 59.9% of new launches and the U.S. 16.3%.
Fees set what a sale is worth to Amazon sellers. Amazon's seller pricing page lists a $39.99 monthly Professional plan or $0.99 per item on the Individual plan, plus referral fees that run from 5% to 45% by category, with 15% the most common rate. The Beauty, Health and Personal Care category charges 8% on items priced at $10.00 or less and 15% above that, so a $20 personal care item pays a $3 referral fee.
A $100 sale in a 15% category costs $15 in referral fees before Fulfillment by Amazon charges or ad spend.
Amazon sellers who want figures on products sold by rivals won't find them in Amazon's filings. Third-party Amazon tools estimate unit sales, keyword volume and pricing history; the site's Amazon market intelligence guide covers how those estimates work, and the ecommerce analytics tools ranking compares the platforms. Amazon also competes with its own sellers through private label brands such as Amazon Basics.
AWS sales and cloud computing market share
AWS is the market leader in cloud infrastructure services. Synergy Research Group put the Q2 2026 worldwide market at $143.4 billion, up 43%, the highest growth rate in eight years, with Amazon at 28%, Microsoft at 20% and Google at 15%. Trailing 12-month market revenue reached $500 billion.
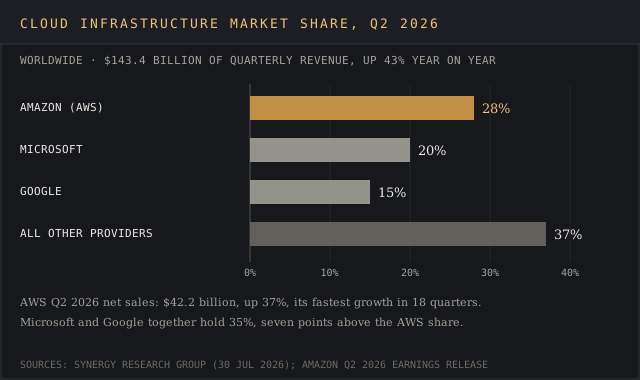
Amazon Web Services sales hit $42.2 billion in Q2 2026, up 37%, with $16.6 billion of operating income, up from $10.2 billion. On the Q2 2026 call Andy Jassy put the AWS backlog at $496 billion, per Nasdaq's summary of the call. Amazon generated $128.7 billion from AWS in full-year 2025.
Amazon traffic, shoppers and users
Similarweb's September 2026 profile of amazon.com credits the site with about 2.6 billion visits a month, ranks it ninth worldwide and fourth in the U.S., and puts 84.8% of amazon's traffic in the United States. The site's Similarweb review covers how its panel models traffic. Visitors view 8.95 pages per visit and stay 5 minutes 45 seconds on average.
The same profile reports an audience of Amazon shoppers that's 50.6% female and 49.4% male, with 25 to 34 year olds the largest age group. Those are panel-based estimates of Amazon users on one domain; amazon.co.uk, amazon.de and the mobile app each sit outside the count.
How many people shop on Amazon daily? Amazon doesn't publish a count of daily Amazon customers or active Amazon users. At 2.6 billion monthly visits, amazon.com averages roughly 85 million visits a day, and one Amazon shopper often makes several. For U.S. Prime reach, CIRP estimates 201 million U.S. Amazon customers had Prime in the December 2025 quarter, up about 4% from 194 million a year earlier, in its January 2026 report.
Amazon's share of the U.S. e-commerce market
U.S. online shopping through e-commerce channels reached $340.2 billion in Q2 2026, seasonally adjusted, or 17.1% of total retail sales, per the Census Bureau's quarterly e-commerce report (18 August 2026). E-commerce grew 12.2% year over year while total retail grew 6.7%.
eMarketer's US Amazon Ecommerce Forecast 2025 puts Amazon at 40.5% of U.S. retail e-commerce sales in 2025, counting gross merchandise sold by Amazon and by its marketplace sellers. That makes Amazon the largest online marketplace and e-commerce platform in the U.S. ecommerce space by a wide margin; Walmart's U.S. eCommerce sales were $99.6 billion in its latest fiscal year, per the site's Walmart statistics report.
Across the whole ecommerce market and physical retail combined, the two companies are now close in size. Amazon's $716.9 billion of 2025 net sales edged past Walmart's $713.2 billion of revenue for the year to 31 January 2026, but $128.7 billion of Amazon's total is AWS. The ecommerce statistics and retail industry statistics reports carry the wider market figures, and Shopify statistics covers the e-commerce platform behind many brands' own stores.
Why published Amazon estimates diverge
The devil's in the details: most Amazon statistics that disagree are counting different units. The table pairs the figure circulating on statistics pages with what the primary source says.
| Circulating figure | What the primary source shows | Why they differ |
|---|---|---|
| 200 million Prime members | Amazon: "more than 200 million paid members worldwide"; CIRP: 201 million U.S. Amazon customers with Prime | Amazon counts paid memberships worldwide; CIRP counts U.S. customers in its survey who have Prime |
| 1.9 million active sellers | Marketplace Pulse: 1.65 million active sellers at end-2025 | 1.9 million is Amazon's count of small and medium-sized businesses from the 2020 letter |
| 1 million new sellers a year | 165,000 new sellers in 2025 | Registrations include dormant accounts; Marketplace Pulse counts sellers who list a product |
| 36% to 40% of U.S. e-commerce | eMarketer: 40.5% for 2025 | Share of gross merchandise, including Amazon marketplace sales Amazon books only as fees |
| Amazon Prime Day sale total of $14.2 billion (2024) | Adobe: $14.2 billion spent at all U.S. online retailers | Adobe measures the whole U.S. market during the event |
| Prime Video content spend $22.4 billion | 10-K: $22.4 billion total video and music expense | The 10-K figure combines video and music |
The Amazon seller count gap is the widest. Jeff Bezos wrote in the 2020 letter that more than 1.9 million small and medium-sized businesses sell in the store and "make up close to 60% of our retail sales." The "one million new sellers a year" figure is six times Marketplace Pulse's 2025 count of 165,000, which leaves out dormant signups and counts only sellers who listed a product.
U.S. share depends on the denominator. Census reports total U.S. e-commerce and names no companies. eMarketer builds a gross merchandise estimate. Amazon's third-party seller services line, $172.2 billion in 2025, reports fees, so it can't be divided by Census totals to get a share. Dividing fee revenue by merchandise totals misses the mark, and so does any market share estimate built that way.
Employees, logistics and capital spending
Amazon employed about 1,576,000 full-time and part-time workers on 31 December 2025, up 1% in a year, and 1,575,000 at the end of Q1 2026. The 2025 10-K lists 726 million square feet of fulfillment, data center and other space, 660 million of it leased. Amazon Logistics runs the delivery network behind the same-day figures above.
Capital spending is where the cash goes. Cash capital expenditures were $128.3 billion in 2025, up from $77.7 billion in 2024, per the 10-K. Amazon guided to about $200 billion for 2026 in February; on the Q2 call Jassy raised that to approximately $220 billion, citing higher memory costs.
- Free cash flow, 2025: $11.2 billion, down from $38.2 billion
- Free cash flow, 12 months to June 2026: an outflow of $7.6 billion
- Operating cash flow, 12 months to June 2026: $161.4 billion, up 33%
- Purchases of property and equipment, 12 months to June 2026: $173.0 billion gross
Amazon chose to bite the bullet on free cash flow to build AI data center capacity, and the Q2 release attributes the $66.1 billion year-over-year rise in property purchases mainly to that.
Amazon company history in numbers
Jeff Bezos started Amazon in 1994. In July 1995 Amazon.com opened as an online bookstore run out of his Bellevue, Washington home, according to aboutamazon.com; the first book sold was Douglas Hofstadter's Fluid Concepts and Creative Analogies. Within the first month it had shipped to all 50 states and 45 countries.
The everything store Brad Stone described in his 2013 book grew through deals as well. Amazon acquired Twitch, then "the leading live video platform for gamers," in a deal announced 25 August 2014; the live streaming service had 55 million unique visitors that July. Amazon's Whole Foods Market purchase closed on 28 August 2017, and Amazon owns both today.
Amazon had 12,165 shareholders of record on 28 January 2026, per the 10-K, with a far larger number of beneficial owners holding through brokers.
Frequently asked questions
Is Amazon making profit or losing money?
Amazon is profitable. Amazon reported $80.0 billion of operating income and $77.7 billion of profit after tax in 2025, and $27.5 billion of operating income in Q2 2026. Free cash flow turned negative over the 12 months to June 2026 because of AI capital spending.
How much does Amazon take from a $100 sale?
For Amazon sellers in a category with the common 15% referral fee, Amazon takes $15 of a $100 sale, plus the $39.99 Professional plan fee spread across a seller's monthly orders. Fulfillment by Amazon and advertising add more.
Who is Amazon's #1 competitor?
In U.S. retail it's Walmart, the other ecommerce giant, whose $713.2 billion fiscal 2026 revenue sits within $4 billion of Amazon's 2025 net sales. In cloud computing it's Microsoft, at 20% of Q2 2026 infrastructure spend against Amazon's 28% market share.
Is Amazon Prime membership declining?
No published count shows Amazon Prime shrinking. CIRP's U.S. estimate rose from 194 million to 201 million customers in 2025, and Amazon's subscription revenue grew 12% to $49.6 billion.
Which country buys most from Amazon?
The United States. North America produced 59.5% of 2025 net sales, and 84.8% of amazon's traffic on amazon.com comes from U.S. visitors, per Similarweb.
How can I see Amazon sales figures?
Company-level Amazon statistics come from the quarterly releases on ir.aboutamazon.com and the annual Form 10-K on SEC EDGAR, which break net sales into segments and seven revenue lines. Amazon publishes no sales figures for individual products or sellers, so those come from third-party estimators.
Bottom line
Amazon is the largest e-commerce platform in the U.S., and financially it's three businesses sharing a balance sheet, with AWS calling the shots on profit. Retail generates most of the $716.9 billion of net sales, advertising grew 22% in 2025 against 20% for AWS, and AWS earned 60% of Q2 2026 operating income while AI capacity drives a 2026 capital budget of roughly $220 billion.
Treat any of the Amazon statistics in circulation that lack a filing date with suspicion. The Prime count dates to 2021, seller totals mix registrations with active accounts, and Prime Day dollars belong to Adobe's whole-market tally. Amazon revenue, the Amazon marketplace and Amazon Prime all show up in the 10-K and the quarterly releases, and a named tracker such as Synergy, Marketplace Pulse or eMarketer settles almost every remaining number on this page.
The filings, trackers and research houses behind each Amazon figure, and which sums are our own
Company filings and releases: ir.aboutamazon.com and sec.gov (Amazon Q2 2026, Q1 2026, Q4 2025, Q4 2024 and Q4 2023 earnings releases and supplemental tables; 2025 Form 10-K), aboutamazon.com (2020 shareholder letter, 2025 Small Business Empowerment Report, company history), businesswire.com (Prime Day 2025 release) and press.aboutamazon.com (Twitch acquisition).
Seller and advertiser pages: sell.amazon.com (seller plans and referral fees) and advertising.amazon.com (Prime Video ads reach).
Trackers and research houses: srgresearch.com (Synergy Research Group, Q2 2026 cloud market), emarketer.com (US Amazon Ecommerce Forecast 2025), marketplacepulse.com (seller registrations, January 2026), cirpamazon.substack.com (CIRP Prime membership, January 2026), similarweb.com (amazon.com profile, September 2026).
Market totals: census.gov (Quarterly Retail E-Commerce Sales, 18 August 2026), blog.adobe.com and business.adobe.com (Prime Day 2024 and 2025) and nasdaq.com (Q2 2026 call summary).
Every figure was checked against its source on 16 October 2026. Annual advertising and subscription totals for 2023 to 2025 are our sums of Amazon's quarterly figures, because the releases print no annual totals for those lines.