PPC statistics 2026: Google paid clicks up 13% and Amazon ads at $19.8 billion a quarter
 By Jan Suski. I go deep on every review, checking every number against its source and digging up details other coverage misses, a habit from six years of SEO and link building for tech companies. Bylines at Surfer, Brand24, and Senuto. How the scoring works.
The numbers Google, Amazon and Microsoft paid search, checked 7 October 2026
These PPC statistics point one way for Google, whose search revenue now grows on click volume. Paid clicks rose 13% in each of the first two quarters of 2026 while CPC growth slowed from 7% to 3%.
Amazon's ad business grew 26% in Q2 2026, against 17% for Google's Search & other line.
An 8% Google Ads conversion rate sits at the median of an SMB lead-gen panel and at more than double the median of an ecommerce one.
Google sold 13% more paid clicks in the second quarter of 2026 than a year earlier, and each click cost 3% more, according to Alphabet's Form 10-Q for the quarter to 30 June 2026. Amazon's advertising line reached $19.8 billion in the same quarter, up 26%. Microsoft's search advertising revenue, excluding traffic acquisition costs, grew 10%.
This report collects PPC advertising statistics from the three companies that sell most pay per click advertising, plus the benchmark panels advertisers use to judge their own PPC campaigns: WordStream by LocaliQ, Optmyzr, Triple Whale, Skai and Tinuiti. Google, Amazon and Microsoft each get a section, and one section explains why the published benchmarks disagree.
It's written for PPC managers, digital marketing teams and anyone setting next year's marketing budget for paid ads. Every figure links to the filing, help page or study behind it, with its date. These figures feed the CPC and lead-cost assumptions in a 2027 paid search plan. Market-wide search data sits in the search engine marketing statistics report.
PPC ad spend by platform: Google, Amazon and Microsoft compared
Three companies report the revenue from their PPC ads in public filings, and the latest quarters differ threefold. Google's Search & other line brought in $63.27 billion in the quarter to 30 June 2026, three times Amazon's $19.81 billion. Microsoft's search advertising revenue for its whole fiscal year to June 2026 came to $15.18 billion, less than one Amazon quarter.
| Platform | Line in the filing | Latest period | Revenue | Growth |
|---|---|---|---|---|
| Search & other | Q2 2026 | $63.27B | +17% | |
| Amazon | Advertising services | Q2 2026 | $19.81B | +26% |
| Microsoft | Search advertising | Fiscal year to 30 June 2026 | $15.18B | +9% (+12% ex-TAC) |
Each line counts different inventory. Amazon's covers sponsored ads, display and video ads sold to sellers, vendors, publishers and authors. Google's Search & other includes ads on Gmail, Google Maps and Google Play. Microsoft's PPC ads, per its FY2026 Form 10-K, run across Bing, Copilot, Microsoft News, Edge and third-party affiliates.
US totals come from the IAB and PwC Internet Advertising Revenue Report for 2025, published in April 2026. Search brought in $114.2 billion, up 11%, which was 38.8% of the $294.6 billion US digital advertising total. Social media took $117.7 billion and 40.0%, the first year social passed search, as the social media statistics report tracks.
Google is losing share of that pool of search ads. eMarketer's US Search Advertising Forecast 2026 gives Google 48.5% of US search ad spending this year, and the chart attached to it pairs the drop with Amazon's continued rise.
AI answers are the newest PPC advertising inventory. WPP Media's This Year Next Year midyear forecast of 16 June 2026 puts generative search advertising at $5.1 billion in 2026, a drop in the bucket next to $114.2 billion of US search, and projects it past $100 billion by 2030.
Google PPC statistics on paid clicks, CPC and Search revenue
Alphabet reports two PPC metrics every quarter. Paid clicks count ad clicks on Google's own search pages plus Gmail, Google Maps and Google Play. Alphabet's CPC is click-driven revenue divided by paid clicks, the average amount Google charges an advertiser for each click. Both appear as year-over-year changes in each filing, straight from the horse's mouth.
- Paid clicks +2% and CPC +7% in Q1 2025 (10-Q)
- Paid clicks +4% and CPC +8% in Q2 2025 (10-Q)
- Paid clicks +7% and CPC +7% in Q3 2025 (10-Q)
- Paid clicks +6% and CPC +7% for full year 2025 (10-K, which reports the year as a whole)
- Paid clicks +13% and CPC +5% in Q1 2026 (10-Q)
- Paid clicks +13% and CPC +3% in Q2 2026 (10-Q)
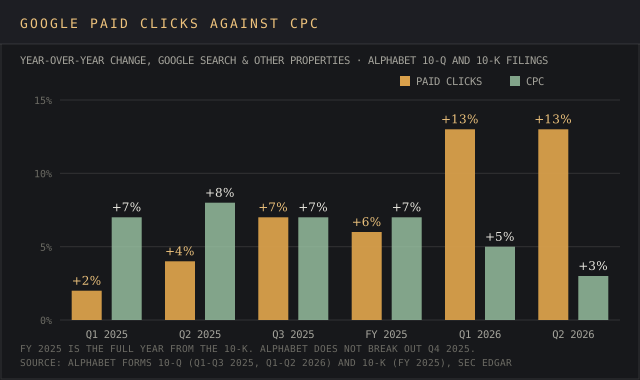
The mix flipped inside 18 months. In early 2025 Google grew revenue from search ads mostly by charging more per click. By mid-2026 volume carried it, and Search & other revenue rose 19% in Q1 to $60.40 billion and 17% in Q2 to $63.27 billion. Alphabet's 10-Q names growth in search queries from "usage on mobile devices" among the drivers.
For the full year 2025, Search & other revenue reached $224.53 billion, up 13% from $198.08 billion in 2024. In Q2 2026, search made up 77.5% of Google's $81.63 billion in advertising revenue, with YouTube ads at $11.06 billion and the Google Network at $7.30 billion.
The 13% click growth is the fastest of the six periods listed, so keep an eye on the Q3 filing due in late October. The Google search statistics report covers query volume and zero-click rates on the organic side of the same results pages.
Google Ads features behind PPC performance, from Quality Score to Performance Max
Google's help center defines the levers that set the price and reach of PPC ads. Four of them shape the ad performance numbers in the benchmarks below.
- Quality Score is a 1 to 10 diagnostic at keyword level, built from expected click through rate, ad relevance and landing page experience, which measures how useful the landing pages are to people who click. Google states it "is not an input in the ad auction."
- Smart Bidding covers four bid strategies, Target CPA, Target ROAS, Maximize conversions and Maximize conversion value, that set a bid in every auction from signals including device, location, time of day, remarketing lists, operating system and the query.
- Performance Max runs one campaign across YouTube, Display, Search, Discover, Gmail and Maps ad placements, with advertiser audience signals guiding its learning, so audience targeting becomes an input to the bidder.
- Responsive search ads take up to 15 headlines of 30 characters and 4 descriptions of 90 characters, and Google tests the combinations against each query, an automated A/B test of ad creatives. Crafting ads now means writing ad copy in parts for the system to assemble.
Advertisers have jumped on the bandwagon of automated campaign types. Google told AdExchanger on 30 April 2026 that 4 million advertisers run Performance Max campaigns, and that AI Max for search had added hundreds of thousands of advertisers in a year. All 4 million are eligible to serve ads in AI Overviews, one of the newest ad formats on the page.
Ad extensions, which Google Ads now files under assets, add sitelinks, callouts and images to a text ad shown in the search results. Google's assets help page says ad extensions often increase an ad's total clicks. Checkout sits on the same results pages too: since 13 November 2025, Google can buy an item for a shopper on an eligible merchant's site using Google Pay.
Google counts its policy enforcement in billions. Its 2025 Ads Safety Report lists:
- 8.3 billion ads blocked or removed, and 4.8 billion restricted
- 24.9 million advertiser accounts suspended, 4 million of them for scam-related activity
- 602 million ads removed under the policies most closely tied to scams
- 480 million web pages blocked or restricted on the publisher side
- Over 99% of policy-violating ads stopped before anyone saw them, and incorrect advertiser suspensions down 80%
Google Ads benchmarks by industry for CPC, conversion rates and lead costs
WordStream by LocaliQ's 2026 Google Ads benchmarks, published 19 May 2026, sampled 13,474 US search advertising campaigns run between 1 April 2025 and 31 March 2026. Its "averages" are medians across those PPC campaigns. The overall figures were a 6.64% click-through rate, a $5.42 CPC, an 8.18% conversion rate and a $66.69 cost per lead.
The advertising industry statistics report sets that 6.64% average click through rate against two other 2026 panels. The industry split below shows how far a single average sits from the ad performance of any one account.
| Industry | CPC | Conversion rate | Cost per lead |
|---|---|---|---|
| Attorneys & legal services | $9.87 | 5.55% | $131.63 |
| Home & home improvement | $8.33 | 8.05% | $90.92 |
| Dentists & dental services | $8.00 | 10.67% | $72.97 |
| Personal services | $7.17 | 12.34% | $54.60 |
| Business services | $5.87 | 4.85% | $93.69 |
| Animals & pets | $4.06 | 16.22% | $31.50 |
| Finance & insurance | $3.39 | 2.64% | $74.44 |
| Real estate | $3.22 | 3.70% | $102.51 |
| Travel | $2.14 | 5.83% | $44.70 |
| Arts & entertainment | $1.63 | 5.91% | $26.84 |
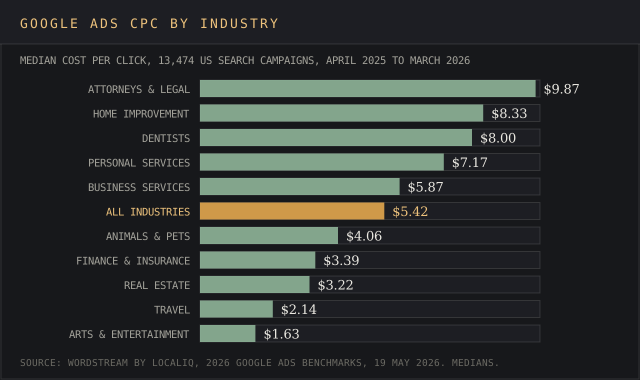
Price and conversion rates move independently. Finance & insurance pays $3.39 a click and converts 2.64% of them, so its leads cost $74.44. Animals & pets pays $4.06 and converts 16.22%, so its leads cost $31.50. For a law firm, a $131.63 lead is par for the course.
The year-over-year moves were small at the top line and large inside it:
- Conversion rates rose in 87% of industries.
- Cost per lead fell for the first time in five years, with travel down 39.35% and beauty & personal care down 34.95%.
- Real estate CPC rose 27.27%, and education & instruction CPC fell 22.79%.
Ten years of these PPC statistics show the long climb. WordStream's first edition in 2016 put the averages at a 1.91% CTR, a $2.32 CPC, a 2.70% conversion rate and $59.18 per action. The CPC has since more than doubled. The same article says nearly half of the small businesses in its latest survey run paid search campaigns.
Amazon PPC stats on advertising revenue, Sponsored Products and retail media
Amazon reports its PPC advertising as part of one revenue line, advertising services, which covers sponsored ads, display and video advertising. The quarterly figures in its Q2 2026 earnings release of 30 July 2026:
- $13.92 billion in Q1 2025
- $15.69 billion in Q2 2025
- $17.70 billion in Q3 2025
- $21.32 billion in Q4 2025
- $17.24 billion in Q1 2026
- $19.81 billion in Q2 2026, up 26% and also 26% excluding currency effects
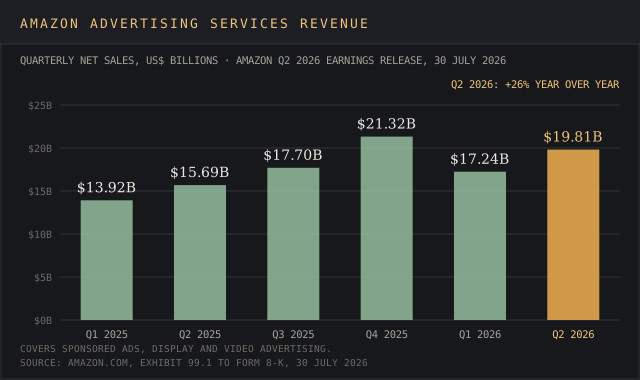
The four 2025 quarters add up to $68.64 billion. Advertising made up 9.9% of Amazon's $200.61 billion in Q2 2026 net sales, and its growth ran ahead of the 20% rise in total sales.
Agency panels show where the money for Amazon PPC ads goes. MediaPost's 16 July 2026 coverage of Tinuiti's Q2 2026 Digital Ads Benchmark Report gives these Amazon PPC stats:
- Sponsored Products spend up 38% year over year
- Sponsored Brands spend growth up from 3% in Q1 to 20% in Q2
- Amazon DSP spend growth up from 41% to 67%
- Prime Video ads spend up 48%
Skai's Q2 2026 Digital Marketing Quarterly Trends Report of 28 July 2026, built on about $10 billion of platform spend and 10 billion clicks from PPC campaigns, put retail media and paid social spend up 26% year over year. Its retail media CPC "has held near a dollar for the seventh straight year." Prime Day's blended CPC hit a record low of $1.63, and DSP's share of Amazon Ads spend rose from 17.9% to 25.5% during the event.
Amazon's own Sponsored Products page prices the paid ads per click with no monthly fee. It reports that Sponsored Products campaigns with video ad creatives saw a 67% higher click-through rate and a 9% higher conversion rate than campaigns without video, from Amazon internal US data for June 2026.
Two companies take the lion's share of new retail media money. eMarketer's H2 2025 retail media forecast has US retail media ad spending rising from $58.79 billion in 2025 to $69.33 billion in 2026, with $9.42 billion of the $10.53 billion increase going to Amazon and Walmart. Seller-side data sources are covered in Amazon market intelligence.
Microsoft Advertising statistics, from Bing Ads to Copilot
Microsoft's PPC advertising business ran as Bing Ads until it became Microsoft Advertising on 29 April 2019. Microsoft's FY2026 10-K reports search advertising revenue of $15.18 billion for the year to 30 June 2026, up 9% from $13.88 billion, and up 12% excluding traffic acquisition costs. That auction flies under the radar next to Google's, whose Search & other line earned $224.53 billion in calendar 2025.
Microsoft's PPC statistics show growth slowing from 21% to 10% in six quarters, per its quarterly earnings releases (search advertising revenue excluding traffic acquisition costs, year over year):
- +21% in the quarter to December 2024 (release)
- +21% in the quarter to March 2025 (release)
- +21% in the quarter to June 2025 (release)
- +16% in the quarter to September 2025 (release)
- +10% in the quarter to December 2025 (release)
- +12% in the quarter to March 2026 (release)
- +10% in the quarter to June 2026, or 9% in constant currency
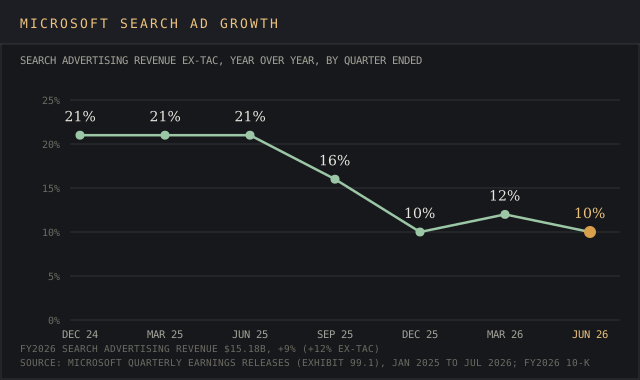
Prices on Microsoft's auction moved the other way. Tinuiti's Q2 2026 data, in the same MediaPost report, had advertisers spending 7% more on Microsoft Advertising while paying 19% more per click. Google's search CPC rose 1% on nearly 14% more spend in the same panel, figures that match the CPC section of the search engine marketing report.
A 19% CPC rise on 7% more spend means advertisers bought fewer Microsoft clicks than a year earlier, a red flag for anyone who moved advertising budgets to Microsoft's search ads to escape Google's prices.
Why published PPC benchmarks disagree
Ask for the average Google Ads conversion rate and the published PPC statistics run from 2.70% to 8.18%. Each one is accurate for the accounts it counts. The table below lists six readings from three publishers.
| Publisher and edition | Panel | Data period | Conversion rate |
|---|---|---|---|
| WordStream, first report (2016) | US search accounts | 2016 edition | 2.70% |
| WordStream industry benchmarks, page updated 6 July 2026 | 14,197 US accounts, $200M+ spend, search network | August 2017 to January 2018 | 3.75% |
| Triple Whale, updated 20 August 2026 | 21,000+ ecommerce brands, Performance Max included | August 2025 to July 2026 | 3.11% |
| LocaliQ 2024 | 17,998 US search campaigns | April 2023 to March 2024 | 6.96% |
| LocaliQ 2025 | 16,446 US search campaigns | April 2024 to March 2025 | 7.52% |
| LocaliQ 2026 | 13,474 US search campaigns | April 2025 to March 2026 | 8.18% |
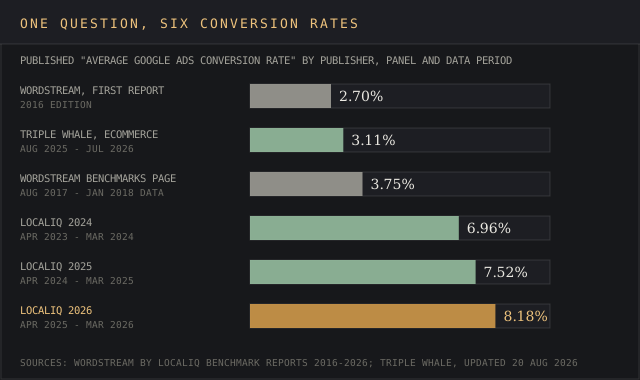
Three things split the numbers, and the devil's in the details of each:
- The conversion. LocaliQ's panel counts leads from small and local businesses, such as a form on one of their landing pages, a call or a booking. Triple Whale counts ecommerce purchases.
- The campaign mix. LocaliQ samples search campaigns. Triple Whale blends Performance Max, Shopping and video ads into one set of performance data, and its average click-through rate reads 1.65% against LocaliQ's 6.64%.
- The year. WordStream's 2016-era benchmarks page, updated in July 2026, still shows 2017 to 2018 data at 3.75%. The 6.96% often quoted as current comes from the 2024 LocaliQ edition.
CPC figures split the same way. WordStream's $5.42 is a median price for SMB accounts. Alphabet's +3% is a change across every Google advertiser. Tinuiti's +1% covers its managed spend. Skai's panel saw paid search spend up 17% on flat clicks, which implies CPCs up by about the same amount.
For PPC performance comparisons, zero in on the panel whose advertisers look like yours. A local plumber benchmarks against LocaliQ, a Shopify store against Triple Whale, and a large consumer brand against Skai, whose panel spans about $10 billion of quarterly spend across multiple platforms.
Mobile devices, internet users and paid search clicks
Device splits are the oldest PPC statistics on this page. Merkle's Q4 2020 Digital Marketing Report, announced on Business Wire on 26 January 2021, found phones produced 64% of total paid search clicks in Q4 2020, "returning to pre-pandemic levels." Treat it as a 2020 reading for PPC ads on phones.
Current traffic data puts mobile devices ahead on the open web. StatCounter measured mobile at 58.99% of worldwide page views in September 2026, desktop at 39.26% and tablet at 1.76%.
DataReportal's Digital 2026 Global Overview Report, published with Meltwater and We Are Social, counts 6.04 billion global internet users, 73.2% of the world's population, and 5.78 billion unique mobile users. Smartphones make up 86.9% of the mobile handsets those internet users carry.
Device mix feeds straight into the auction. Smart Bidding prices each click by device type, so mobile users and desktop users get different bids for the same keyword in the same PPC campaigns. Mobile optimization of landing pages shows up in the conversion rate the bidder learns from.
Desktop panels show how thin the paid click share is. Datos' Q1 2026 State of Search, as reported by PPC Land, measured clicks on search ads at 2.1% to 2.3% of US desktop searches in March 2026, against 44.9% for organic results. Informational queries reached 64.55% of Google searches in that panel.
Older PPC statistics that still circulate
Four widely repeated figures trace to studies between 2009 and 2018. Each is real, and each comes with a date a reader should see:
- "$2 for every $1." Google's Economic Impact methodology assumes businesses make an average $2 in profit for every $1 spent on Google Ads, an estimate from Hal Varian's May 2009 American Economic Review paper "Online Ad Auctions." Google adds organic clicks at 70% of an ad click's value to reach $8 in profit per $1.
- 89% incremental clicks. A 2011 Google research paper by David Chan, Yuan Yuan, Jim Koehler and Deepak Kumar found that, across verticals, 89% of paid search clicks went away when ads were paused.
- 75% find information faster. Clutch's December 2018 survey of 506 people who had clicked a paid search ad found 75% said those ads make it easier to find information, and 33% clicked because the ad answered their search directly.
- 3.75% conversion rate. WordStream's August 2017 to January 2018 search benchmark, still live on its benchmarks page.
The same Clutch survey found 63% of respondents clicked Google ads, 14% Amazon, 9% YouTube and 6% Bing. Read it as a 2018 snapshot of search behavior and brand recognition across ad platforms. Amazon's ad line alone reached $68.64 billion in 2025.
Google's $2 assumption is a long shot as a forecast for any one account. Its own methodology page says the figure was built from observed CPC activity across a large sample of advertisers, and the LocaliQ industry spread of $26.84 to $131.63 per lead shows how far one account can sit from a sample average.
PPC strategy and PPC management steps the benchmark data supports
The same studies carry practical findings for PPC efforts of any size. Each ties to a published number, and together they cover most of a PPC funnel from query to lead.
- Build the PPC strategy on conversion value. LocaliQ's 2026 data shows CPC and conversion rates up while cost per lead fell, and Microsoft ad product liaison Navah Hopkins, quoted in the report, called that combination the case for conversion value tracking. Data driven insights from value tracking feed Smart Bidding directly.
- Cut wasted ad spend with negatives. WordStream's 2026 benchmarks article, citing its analysis of more than 15,000 Google Ads accounts, says adding one negative keyword can triple conversion rates. A negative keyword reduces wasted ad spend on queries that never convert.
- Give changes 30 days. The same report says most PPC campaign changes take 30 days to stick, so audit even successful campaigns monthly before going back to the drawing board.
- Fix the Quality Score inputs. Quality Score rests on three of them, and expected click through rate, ad relevance and landing page experience come down to ad copy, ad extensions, keyword grouping and landing pages that load fast on a phone.
- Split brand and non-brand terms into separate campaigns, so each gets its own budget and bid strategy and campaign performance on brand terms stays visible on its own.
Ad targeting decides where the money goes, starting with location targeting. Smart Bidding reads physical location and location intent as auction signals, so location targeting settings change the price of every click a local business buys.
LocaliQ's Stephanie Scanlan describes the shift in the 2026 report as a move from a wide net to custom audiences, remarketing lists, interest and demographic lists and lookalike audiences, the most relevant audience segments for each target audience. Smart Bidding then uses those lists in audience targeting as data driven bidding signals.
A PPC strategy also depends on the auction it buys into. A Google click at $5.42, a Sponsored Products click near $1 on Skai's panel, and a Microsoft click 19% dearer than a year ago each need different bid strategies, ad formats and advertising strategies. Video ads on Amazon earned a 67% higher CTR, and social ads beat search on price in Skai's Q2 data, with clicks up 53% and CPC down 18%.
Competitor research is part of PPC management, and campaign management tools pull campaign data from multiple ad accounts into one view. The SpyFu review covers keyword and ad history, the Semrush review covers its advertising research toolkit, and the ad intelligence software ranking compares nine tools that track ad copy, ad creatives and ad placements across digital advertising channels.
Display and video ad campaigns are often bought per thousand impressions, and the CPM calculator converts those rates into a price per click or per result. For data driven digital marketing teams weighing paid search ads against organic work, the SEO ROI calculator runs the same arithmetic for organic traffic, and the content marketing statistics report tracks what content marketing programmes cost.
Frequently asked questions
What are the latest PPC statistics for 2026?
Google paid clicks rose 13% in Q2 2026, Amazon ad revenue rose 26% to $19.81 billion, and Microsoft search ad revenue ex-TAC rose 10%. WordStream by LocaliQ's median Google Ads CPC is $5.42.
What does PPC stand for, and how does CPC differ from PPC?
PPC stands for pay per click. Pay per click advertising is the online advertising model in which an advertiser pays when someone clicks an ad, and PPC advertising covers search, shopping and retail media paid ads. CPC, cost per click, is the price of each click. Alphabet defines it as click-driven revenue divided by paid clicks, and WordStream's 2026 median is $5.42.
Which platform is most used for PPC advertising?
Google runs the largest PPC advertising auction. eMarketer gives it 48.5% of US search ad spending in 2026, and its Search & other line earned $63.27 billion in Q2 2026. In Clutch's 2018 survey, 63% of people who clicked paid search ads clicked Google ads.
Is a ROAS of 4 good?
Optmyzr's Q2 2026 data from more than 20,000 managed Google Ads accounts puts median ecommerce ROAS at 5.57x, down 3.75% on the quarter. Triple Whale's ecommerce panel reads 3.27. A ROAS of 4 sits between the two medians, close but no cigar on Optmyzr's panel.
Are Google Ads still worth it in 2026?
For the median LocaliQ account, cost per lead fell to $66.69 in 2026, the first decline in five years, and conversion rates rose in 87% of industries. Leads still cost from $26.84 in arts & entertainment to $131.63 in legal services.
Is PPC better than SEO?
The two buy different clicks on the same page. Google's 2011 study found 89% of paid clicks were incremental, and Datos measured organic results taking 44.9% of US desktop searches against 2.1% to 2.3% for ads in March 2026. The SEO ROI calculator prices the organic side of that comparison, and most PPC efforts run next to organic work on the same keywords.
How much does Google Ads cost per 1,000 views?
Triple Whale's 2026 panel puts the average Google Ads CPM at $15.35, up 13.34% year over year, across more than 21,000 ecommerce brands. That's the price an advertiser pays for 1,000 impressions, and it's the main input to the CPM calculator in the strategy section.
How do you measure PPC performance?
Day-to-day PPC management starts with the key metrics the benchmark panels report, which are click-through rate, cost per click, conversion rate, cost per lead and ROAS. Read campaign data against a panel that matches the account, judge campaign effectiveness on leads and revenue, then move bids, bid strategies, ad copy and ad content from that account's own performance data.
Bottom line
PPC advertising in 2026 is three businesses of different sizes moving at different speeds. Google sells more clicks at slowly rising prices, Amazon grows its ad line at 26% with clicks near $1, and Microsoft's growth has halved while its CPCs climb, a bitter pill to swallow for anyone who shifted budget there.
The benchmarks that advertisers judge themselves against disagree because they count different advertisers, conversions and years. The 8.18% conversion rate and $5.42 CPC describe US small-business search campaigns. An ecommerce brand running Performance Max should expect numbers closer to Triple Whale's.
The figures worth watching next are Alphabet's paid-click growth in its Q3 filing, Microsoft's CPC trend in the next Tinuiti report and Amazon's Q3 advertising line. Each publishes on a fixed quarterly schedule, so these PPC statistics, and any PPC strategy set on them, can be checked again within weeks by any digital marketing team.
The filings, benchmark panels and forecasts behind each PPC figure, and the Q3 numbers due next
Company filings: sec.gov (Alphabet Forms 10-Q for Q1 to Q3 2025 and Q1 and Q2 2026, and its 2025 Form 10-K; Amazon's Q2 2026 earnings release, 30 July 2026; Microsoft's quarterly earnings releases from January 2025 to 29 July 2026 and its FY2026 Form 10-K).
Google and Amazon documentation: support.google.com (Quality Score, Smart Bidding, Performance Max, responsive search ads and assets help pages), services.google.com (2025 Ads Safety Report, April 2026), blog.google (13 November 2025), economicimpact.google (methodology page), research.google (2011 incremental clicks paper) and advertising.amazon.com (Sponsored Products page).
Benchmark panels: wordstream.com (Google Ads benchmarks for 2024, 2025 and 2026, the last published 19 May 2026; industry benchmarks page updated 6 July 2026), triplewhale.com (updated 20 August 2026), optmyzr.com (Q2 2026), skai.io (28 July 2026), mediapost.com (Tinuiti Q2 2026 coverage, 16 July 2026) and ppc.land (Datos Q1 2026 coverage).
Forecasts, market totals and surveys: iab.com (Internet Advertising Revenue Report, April 2026), emarketer.com (14 May 2026 and the H2 2025 retail media forecast), wppmedia.com (16 June 2026), businesswire.com (Merkle, 26 January 2021), gs.statcounter.com (September 2026), datareportal.com (Digital 2026), clutch.co (December 2018), adexchanger.com (30 April 2026) and thedrum.com (29 April 2019).
Every figure was checked against its source on 7 October 2026. Alphabet, Amazon and Microsoft report the third quarter of 2026 in late October. Tinuiti and Datos keep their full reports behind a form, so their figures here come from the trade press coverage named above.