Industrials industry trends for 2026: what the October data shows
 By Jan Suski. I go deep on every review, checking every number against its source and digging up details other coverage misses, a habit from six years of SEO and link building for tech companies. Bylines at Surfer, Brand24, and Senuto. How the scoring works.
The numbers US industrials, data to September 2026, checked October 2026
Purchasing managers report expansion while capacity utilization sits under its long-run average, so the recovery is real in orders and thin in output.
Input prices are rising faster than new orders: the ISM Prices index is 22.6 points above New Orders at 55.3%.
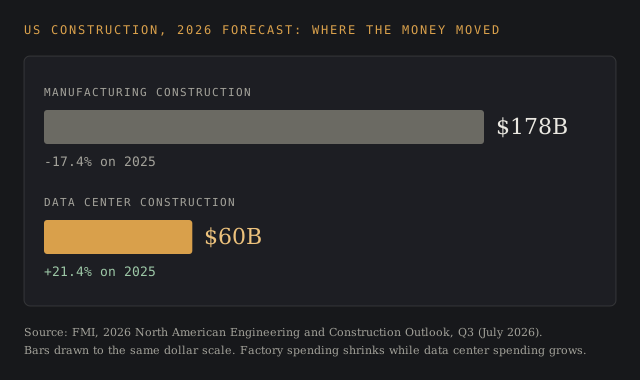
Construction money is moving from factories to AI computing sites, with FMI forecasting a 17.4% drop for one and a 21.4% gain for the other.
Equipment makers, distributors and consultancies quote PMI and capex numbers in every outlook. Send the segment and I'll source a version you own.
US factories are expanding again, and the hard data hasn't caught up with the mood. The ISM Manufacturing PMI read 54.5% in September 2026, its ninth straight month above 50, while the Federal Reserve measured manufacturing output only 1.1% above a year earlier and plant capacity utilization at 75.9%, still 2.3 points under its long-run average.
That gap is the story of industrials this year. Surveys, earnings guidance and stock returns price in a boom led by AI computing, power equipment and defense. Production statistics show a recovery that's narrower, with utilities and semiconductors carrying the index and motor vehicles dragging on it.
This report covers the sector performance numbers, smart manufacturing adoption, labor, global supply chains, the energy transition and M&A. It's written for analysts, operators and investors who need an industrials sector outlook built on figures they can check.
Industrials sector snapshot: five trends in the industrial sector
The industrials industry overview for late 2026 comes down to five trends. Each one has a published number behind it, and each one changes how companies engaged in capital goods, transportation services and engineering services spend money in 2027. Industrials are in a digital and structural transformation at once, so operational agility, re-planning production fast when tariffs or orders shift, decides who gains.
- Orders recovered before output did. ISM's New Orders index rose to 55.3% in September, while manufacturing output grew 0.3% on the month.
- Data center demand is pulling ahead of every other end market in the sector. Utilities output is up 8.7% on the year, and semiconductor output jumped 28.4% in the third quarter.
- Costs are back. Raw material prices have risen for 24 straight months on ISM's count, so increases are par for the course, and manufacturers expect input costs to climb another 5.0% over the next year.
- Trade policies set the price of every imported part. The average statutory US tariff rate stood at 11.0% on 24 August 2026.
- Smart manufacturing is the default capex line. 80% of manufacturing executives in Deloitte's survey plan to put at least a fifth of their improvement budgets into it.
For capital allocation, the lion's share of new money is following the second trend. Companies whose customers build power, cooling and grid capacity are approving investment decisions in 2026, while FMI's forecast shows companies shelving new general-purpose plants.
Sector performance and what the market priced in
S&P 500 industrials returned 27.3% in the year to 30 June 2026, five points ahead of the full index at 22.3%, according to Fidelity's quarterly sector update. Its three-year annualized return was 21.8%, and the sector carried an 8.8% weight in the index.
Fidelity wrote that "the information technology and the industrials sectors led the S&P 500 index in the second quarter of 2026," ahead of nine other sectors, and its strategists kept industrials at overweight. For sector exposure without picking stocks, the Industrial Select Sector SPDR (XLI) and Vanguard Industrials ETF (VIS) both track the GICS industrials definition.
Capital markets have been rewarding a narrow set of leading companies inside the sector. Suppliers of data center infrastructure components, such as Vertiv with 24.1% second-quarter sales growth, sit at one end. At the other, PwC describes engineering and construction as two-speed, with infrastructure-linked assets beating rate-sensitive construction.
Performance drivers and risk signals
Three economic conditions move industrial stocks and factory output together: demand cycles, the cost of capital, and trade policies.
- Cyclical demand. Twelve of the manufacturing industries in ISM's September survey reported growth, led by electrical equipment, primary metals, computer and electronic products, machinery and transportation equipment.
- Interest rates and capex. High capital costs slow long-cycle projects, and FMI forecasts manufacturing construction down 17.4% this year.
- Tariffs and geopolitical risks. One electrical equipment respondent told ISM that "new tariffs against Canada have drastically increased costs for capital expenses as well as assemblies."
Read between the lines of the National Association of Manufacturers' Q3 2026 Manufacturers' Outlook Survey and the risk list is short and expensive: rising raw material costs ranked first for the second straight quarter, with health care costs and trade uncertainty close behind. Economic uncertainty shows up in that list as cost pressure.
Why the published industrials sector outlooks disagree
The sources measure different things at different points in the value chain, so the industrial sector outlook a reader gets depends on which one they open first.
| Signal | Latest reading | Publisher | What it measures |
|---|---|---|---|
| Manufacturing PMI | 54.5% | ISM, Sept 2026 | Share of purchasing managers reporting improvement |
| Manufacturers positive on outlook | 78.9% | NAM, Q3 2026 | Sentiment about the respondent's own company |
| All-industry output, year on year | +2.2% | Federal Reserve G.17 | Physical output, all industry |
| Manufacturing output, year on year | +1.1% | Federal Reserve G.17 | Physical output, factories only |
| Utilities output, year on year | +8.7% | Federal Reserve G.17 | Power and gas delivered |
| Manufacturing employment, September | +9,000 | Bureau of Labor Statistics | Monthly change in factory payrolls |
Copy these lines into an email, fill them in and send. I reply with scope and a price within 2 to 3 business days.
Open the email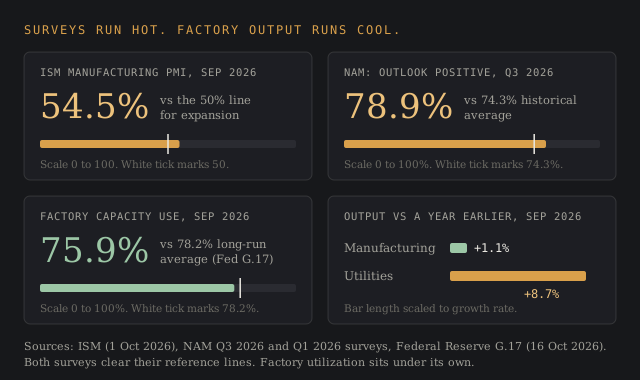
Survey indexes count how many respondents saw improvement, and they say nothing about how much. A purchasing manager whose orders rose 1% counts the same as one whose orders doubled. NAM's 78.9% sits above the 74.3% historical average it reported with its Q1 2026 survey. The Fed's production index weighs actual output, so a strong data center month and a weak auto month cancel out.
The utilities line is the tell. Utilities output grew 8.7% on the year and capacity utilization at utilities is still only 73.8%, against an 84.0% long-run average, according to the Fed's 16 October release. That's grid and power demand from AI computing showing up in the hard data before factory output follows.
The devil's in the details for anyone building a forecast, and our industrial production database rankings compare the sources that publish these series.
Manufacturing industry: smart manufacturing adoption
In Deloitte's 2026 Manufacturing Industry Outlook, 80% of 600 surveyed executives plan to spend at least 20% of their improvement budgets on smart manufacturing, and 92% call it the main driver of competitiveness, up from 86% in 2019.
Manufacturers that implemented smart manufacturing reported gains of 10% to 20% in production output, 7% to 20% in employee productivity, and 10% to 15% in unlocked capacity, per the same Deloitte survey. Those operational efficiencies are what turn advanced technologies from a slide into a capex approval.
Artificial intelligence is the fastest-moving piece. Deloitte expects agentic AI adoption to grow considerably and found that 22% of manufacturers plan to use physical AI within two years, up from 9% today. AI agents are moving from the front office, where they draft quotes for customers and answer service tickets, onto the plant floor for scheduling and quality checks.
Collaborative robots made up 11% of global industrial robot installations in 2025, per the IFR figures collected in our robotics statistics report. Companies building connected smart factories pair those cobots with advanced technologies such as sensors, cloud computing and data analytics.
AI adoption raises output per worker and frees capacity in plants companies already run: the uses below belong to the same factory programs whose adopters reported 7% to 20% higher employee productivity and 10% to 15% unlocked capacity, per Deloitte.
Where artificial intelligence earns its keep today:
- Predictive maintenance, which flags a failing bearing before the line stops
- Vision-based quality control on high-volume lines
- Demand and production forecasting, covered in our manufacturing forecasting software ranking
Digital tools for the factory floor and design
Digital twins are the design-side tool with the clearest return in a digital transformation program. A twin lets engineers simulate a line change, a new product or a maintenance window without interrupting production, so many industrial companies test a change before committing capital. Overall equipment effectiveness (OEE) dashboards are the floor-side counterpart, covered in our industrial data analytics software ranking.
Connected plants carry a cost. RSM's 2026 manufacturing trends report says 18% of middle market companies surveyed experienced a data breach in the previous year, down from a record 28% in the 2024 survey. The FBI's 2025 IC3 report names critical manufacturing among the sectors ransomware groups hit hardest.
The fix is ongoing work, run against the clock. Manufacturers that connect operational technology to IT networks need segmented networks, access controls that get reviewed every quarter, and backups of production recipes and drawings kept offline. Our cybersecurity statistics page tracks breach costs by sector.
Industrial manufacturers: competitive edge and talent
The competitive edge for manufacturers in 2026 is people who can run the new equipment. Deloitte and The Manufacturing Institute estimated that the US could need as many as 3.8 million new manufacturing employees between 2024 and 2033, and that 1.9 million of those jobs could go unfilled.
The workforce is getting older at the same time. McKinsey's July 2025 analysis found the share of manufacturing employees over 55 has more than doubled in 20 years, and that productivity gaps between strong and weak performers reach 125% in high-complexity jobs.
Manufacturing payrolls rose by 9,000 in September 2026 and are up 72,000 since a December 2025 low, according to the Bureau of Labor Statistics. Middle market companies feel this most, especially those still running traditional manufacturing lines, since RSM found many lag larger competitors in tech adoption and workforce capabilities.
What works:
- An upskilling roadmap that trains existing operators on AI and OT systems before hiring outside, which keeps a plant ahead of the curve
- Talent acquisition aimed at data-literate technicians, since data-driven operations need people who can read the output
- Partnerships with software vendors and consulting services companies for the first deployments
Building products and construction linkages
Building products sit where industrial manufacturing meets construction, and construction is split. Total US construction spending ran at a $2,203.1 billion annual rate in August 2026, down 1.7% from a year earlier, per the Census Bureau.
FMI's Q3 2026 engineering and construction outlook shows where the money moved: manufacturing construction is forecast to fall 17.4% to $178 billion in 2026, while data center construction rises 21.4% to $60 billion. Our construction market report covers the wider market.
Suppliers of electrical gear, HVAC and specialty materials whose customers build AI computing sites face strong demand, and suppliers to new factory shells face higher costs and fewer bids.
Distribution is consolidating around that split. Tim Webb, co-head of the Industrials Group at Harris Williams, says in the bank's 2026 industrials outlook: "We continue to see rapid consolidation in building products distribution as large players broaden their aperture." The same outlook says infrastructure-exposed businesses are performing well.
Want a construction split like this for your own region? Send the region and the years.
Email a briefGlobal supply chains and emerging markets
Geopolitical tensions keep forcing companies to redraw global supply chains. The average statutory US tariff rate stood at 11.0% on 24 August 2026, according to the Yale Budget Lab, and scheduled increases would lift it to 11.8% by year end. Importing companies sit between a rock and a hard place, since every rate change reprices a bill of materials and decides how much of the increase reaches customers.
In NAM's Q3 survey, 77.3% of manufacturers cited freight rates and 74.1% cited fuel costs as transportation challenges, and 33.2% of those asked about the conflict in the Middle East said conditions had worsened. Supply disruptions in one region reach companies at every tier of supply chains.
Companies are responding in three ways:
- Nearshoring to Mexico and Canada, which shortens lead times and carries its own tariff risk
- Partner diversification, adding a second supplier for every critical part so no one country holds the whole order
- Digitized supply chains with live supplier risk scoring, the kind of software ranked in our supply chain risk management roundup
Putting all your eggs in one basket used to be the cheap option. Now risk management means paying for redundancy. Emerging markets in Asia Pacific are the main beneficiaries: PwC estimates the region is the only one where industrial deal volumes are growing in 2026, at about 2%.
Lux Research adds a warning for anyone retooling for new regions: separate real market formation from speculative momentum before committing a plant.
Data center demand and supply chain impacts
The AI computing buildout is the single biggest demand driver in industrial statistics this year. Vertiv, which sells power and cooling infrastructure for AI computing sites, reported second-quarter 2026 net sales of $3,274.3 million, up 24.1%, and guided full-year 2026 sales to a $14.0 billion midpoint in its SEC filing.
Vertiv's second-quarter 2026 net sales rose 24.1% to $3,274.3 million, according to its SEC filing.
Vertiv second-quarter 2026 net sales growth
Source: Vertiv SEC filinge.g. order growth at the suppliers in your segment
Source: linked, checked, datedThat demand reaches deep into supply chains. A machinery respondent told ISM in September that "due to booming demand of AI and data centers, domestic steel capacity has been stretched and pushed." The Fed recorded a 28.4% third-quarter gain in semiconductor and related component output.
The companies most exposed sit upstream in the value chain: makers of transformers, switchgear, cooling units, cable and backup generators. Transformer and switchgear makers hold the bargaining power. Technology and infrastructure buyers can lock in multi-year frame agreements and hold safety stock of critical components. Keep an eye on transformer lead times.
Energy transition and decarbonization strategies
Decarbonization remains the dominant innovation priority across industrials, according to Lux Research's June 2026 trend report. Lux describes a shift from ambition to execution, as high capital costs, policy uncertainty, infrastructure gaps and delayed projects make companies rethink the speed and order of their investments.
The pragmatic version is a portfolio: low-risk efficiency retrofits plus a few bets on transformational technologies. Companies are biting the bullet on the retrofits first, since they carry less risk than a first-of-a-kind plant. Hydrogen hubs, low-carbon fuels and storage still attract interest, and Lux notes that delays and policy uncertainty have exposed the risk of leaning on large infrastructure bets.
Energy efficiency now counts as a cost line. The World Economic Forum's Energy Transition Index 2026 counts $2.3 trillion of clean energy investment inside a record $3.3 trillion of global energy investment. At $2.3 trillion, clean energy is a customer segment, and sustainability has become a revenue line for industrial products makers that sell into it.
Lux lists four more levers:
- Resource security, from critical minerals to water management, as a competitive advantage
- Circular manufacturing and recycling, which cut industrial products makers' exposure to raw material price swings
- Next-generation materials and manufacturing, from specialty materials to additive manufacturing, which Lux calls the fastest-growing innovation priority
- Carbon management and low-carbon fuels for emerging markets
Our energy market intelligence guide lists the data sources for the energy transition side.
Commercial models, services and deal making
The way industrial companies operate is shifting toward services sold around the machines they ship. Service contracts, monitoring subscriptions and integrated solutions bundle hardware, controls and support, which keeps customers paying across the cycle. Professional services and engineering services companies are the integrators that make those bundles work.
Deal making follows the same logic. PwC's June 2026 industrials and services deals outlook estimates global deal values up 9% and volumes down 7% for the year, based on announced deals through 31 May 2026. Engineering and construction deal values are up 64%, and aerospace and defence volumes are up 14%, which PwC ties to rising defence budgets and geopolitical tensions that push buyers toward resilient supply chains.
Buyers want companies with specialized industrial platforms. IMAP's 2026 industrials M&A note says buyers prioritize "certification barriers, proprietary engineering, embedded OEM relationships." IMAP adds water, grid modernization and refrigerant technologies, where regulatory changes drive demand.
Private equity sponsors are rolling up regional distributors and service companies, and private equity firms remain focused on adjacent markets that add technical capability.
For a growth strategy, both sources agree. Partnerships with software vendors, new tools for predictive service, and acquisitions in fragmented niches are supporting growth, while companies sell off commodity manufacturing assets. The growth opportunities buyers pay for sit in recurring service revenue.
How to track industrial statistics yourself
Every figure on this page comes straight from the horse's mouth. These are the primary sources, and the day each one updates:
- Federal Reserve G.17, output and capacity utilization, mid-month. The annual revision lands 24 November 2026 with 2022 as the new base year.
- ISM Manufacturing PMI, first business day of each month.
- BLS Employment Situation, first Friday of each month.
- Census Bureau construction spending, first business day of each month, two months in arrears.
- National Association of Manufacturers Outlook Survey, quarterly.
Our guide on how to write an industry report from primary data covers the method, and our supply chain intelligence ranking covers paid tools that track industrials sector trends from these series.
Delivered for your site and your byline. Hosting here is optional.
Frequently asked questions
What industries fall under industrials?
Under the GICS classification used by S&P and MSCI, industrials spans companies in three industry groups: capital goods (aerospace and defense, building products, construction and engineering, electrical equipment, machinery), commercial and professional services, and transportation.
What is the industrials sector's outlook for 2026?
Growth with cost pressure. ISM's PMI has been above 50 for nine months, 78.9% of NAM respondents are positive, and total output is up 2.2% on the year. Prices are the risk, with ISM's Prices index at 77.9%.
What are the current trends in manufacturing?
Manufacturers are adopting smart manufacturing and AI, nearshoring suppliers, reskilling staff, and moving construction budgets from factories to server facilities. In Deloitte's survey, 80% of executives plan to put at least 20% of improvement budgets into smart manufacturing.
Why are industrials down?
As a group, industrials are up: S&P 500 industrials returned 27.3% in the year to June 2026. The weak spots are motor vehicles, where output fell 3.0% in September, a red flag for auto suppliers, and rate-sensitive building products.
What industry is going to boom in 2026?
Power and cooling equipment for AI computing. FMI forecasts 21.4% growth in data center construction, and utilities output is up 8.7% on the year. Long-term growth opportunities sit with power, cooling and grid equipment suppliers and their customers.
Bottom line
The trends in the industrial sector for the rest of 2026 point one way. Orders, sentiment and stock returns have recovered, and physical output growth is following slowly, carried by utilities and semiconductors.
The risks are costs and policy. Input prices have risen for 24 straight months, tariffs reprice imported parts, and labor shortages cap how fast plants can add shifts. Companies that tie investment decisions to output data will spend their 2027 budgets where customers' orders already show up in the Fed's numbers.
Industrial suppliers, distributors and advisory firms use reports like this one in board packs and client briefings.
A report on your topic for a blog page, gated content or a lead magnet.
Written for your client and published under their brand, with my name left off.
Your report on marketintelligencetools.com, with 2 to 3 CTAs carrying your sponsored links.
Default terms: the report is yours to publish, and I keep the right to republish it on this site behind a gate, outside Google's index.
Where each industrials figure comes from, and the one number no publisher prints
Output, orders, jobs and construction: federalreserve.gov (G.17 release on output and capacity utilization, 16 October 2026), prnewswire.com (ISM Manufacturing PMI report for September 2026, 1 October 2026), bls.gov (Employment Situation for September 2026), census.gov (construction spending for August 2026) and fmicorp.com (2026 North American Engineering and Construction Outlook, third quarter).
Sentiment, returns and policy: nam.org (Manufacturers' Outlook Surveys for Q1 and Q3 2026), fidelity.com (Quarterly Sector and Investment Research Update Q3 2026, sector table as of 30 June 2026), budgetlab.yale.edu (State of U.S. Tariffs, 24 August 2026) and msci.com (GICS structure).
Technology and labor: deloitte.com (2026 Manufacturing Industry Outlook), themanufacturinginstitute.org (Deloitte and The Manufacturing Institute workforce estimate), mckinsey.com (July 2025 workforce analysis), rsmus.com (2026 manufacturing trends) and ic3.gov (2025 IC3 report).
Companies, energy and deals: sec.gov (Vertiv Q2 2026 results, exhibit 99.1), luxresearchinc.com (June 2026), weforum.org (Energy Transition Index 2026), pwc.com (June 2026 industrials and services deals outlook), imap.com (2026 industrials M&A note) and harriswilliams.com (2026 industrials outlook).
No publisher sizes the industrials sector as one dollar market, so this page tracks output, orders, prices, jobs and returns. The Fed's annual G.17 revision on 24 November 2026 moves the base year to 2022 and will restate the output and utilization figures above.