Robotics statistics 2026: installations, robot density, market size and jobs
 By Jan Suski. I go deep on every review, checking every number against its source and digging up details other coverage misses, a habit from six years of SEO and link building for tech companies. Bylines at Surfer, Brand24, and Senuto. How the scoring works.
The numbers Industrial and service robots, checked 14 October 2026
China installed 354,200 robots in 2025, more than nine times the 38,400 installed in the United States, the second-largest market; that represents 59% of global demand.
South Korea runs 1,220 robots per 10,000 manufacturing employees, 9.2 times the world average of 132.
Cobots made up 11% of global installations and 19.6% of North American units ordered in 2025, because the IFR counts installations worldwide and A3 counts orders in one region.
Robot makers, integrators and investors quote IFR numbers in every deck. Send the country or the robot type and I'll source a version you own.
Factories installed more than 600,000 industrial robots in 2025, 11% more than in 2024, and the global operational stock reached a record 5 million units, according to the International Federation of Robotics, World Robotics 2026 (24 September 2026). China took 354,200 of those units, 59% of the world total, per the IFR's U.S. market release issued the same day.
The money figures are far less settled. Published estimates of the robotics market run from the IFR's $50 billion a year for robot systems to GlobalData's $90.2 billion, and two forecasts climb past $200 billion. Every number on this page comes straight from the horse's mouth: it links to the body that published it, with the report title and date.
The page is written for analysts, investors and operations teams interested in robotics statistics they can quote in models, budgets and board decks. It covers robot installations by country, robot density, automation technologies across industries, collaborative robots, North American orders, service and medical robots, the companies behind the numbers, productivity and employment data, and the forecasts.
Global robot installations in 2025
The robotics industry has now topped 500,000 annual installations for five years running. The IFR counted 542,000 in 2024 in World Robotics 2025 (25 September 2025), the fourth straight year above that line and double the count of ten years earlier. The organization had expected 575,000 for 2025; reality beat that forecast by at least 25,000 units.
The installed base compounds on top of each year's figure. Operational stock stood at 4,281,585 units in 2023 in World Robotics 2024, 4,664,000 in 2024 and 5 million in 2025. That's a 17% rise in the total number of working industrial robots in two years.
Asia took 74% of 2024 installations, Europe 16% and the Americas 9%. Europe installed 85,000 units that year, down 8%, and the Americas 50,100, down 10%. Factories in Asia are accounting for nearly three of every four new industrial robots, and Chinese factories alone for more than half.
Chinese robot manufacturers are winning their home market. Their share of installations in Chinese manufacturing rose from about 28% a decade ago to 57% in 2024, the IFR reported, then eased to 55% in 2025. That domestic supplier ecosystem now installs more robots inside China each year than Japan, the United States and Germany install combined.
Industrial robots by country
China took the lion's share again in 2025: 354,200 units and 59% of global demand, up from 295,000 units and 54% in 2024. The United States climbed to second place with 38,400 installations, up 12%, pushing Japan (36,200) to third. The IFR puts South Korea and Germany each between 25,000 and 38,000 units for the year.
| Country | 2024 installations | 2025 installations |
|---|---|---|
| China | 295,000 (54% share) | 354,200 (59% share) |
| United States | 34,200 | 38,400 |
| Japan | 44,500 | 36,200 |
| South Korea | 30,600 | 25,000 to 38,000 corridor |
| Germany | 26,982 | 25,000 to 38,000 corridor |
| India | 9,100 | Sixth-largest market |
Copy these lines into an email, fill them in and send. I reply with scope and a price within 2 to 3 business days.
Open the emailThe 2024 column comes from World Robotics 2025. The 2025 column comes from the IFR's 24 September 2026 U.S. release, which places South Korea and Germany in a corridor between 25,000 and 38,000 annual installations. India installed 9,100 robots in 2024, up 7%.
Japan's drop from 44,500 to 36,200 units is the largest fall among the top five markets. The domestic count says little about Japanese companies: Fanuc alone booked ¥378.6 billion of robot division sales in the year to 31 March 2026, compared with ¥329.6 billion a year earlier. The robot division represents 44.1% of its ¥857.8 billion total, per its FY2025 results reference.
Robot automation across industries
Automotive remains the largest customer for industrial robots in the U.S.: 13,500 of the 38,400 installations in 2025, down 1%, which represents 35% of the national total. Food and beverage plants have grown under the radar, adding 2,900 robots, up 30%, compared with 3,000 for metal and machinery, which fell 15%. Our automotive industry statistics track the car sector's own production numbers.
Automation demand is spreading to many industries at once. A3's release titled Robot Orders Increase in Q2 as Automation Demand Broadens Across Industries shows non-automotive industries taking 56% of North American units in the second quarter of 2026. First-half orders rose 35% from semiconductor and electronics plants, 32% from life sciences, 24% from automotive components, 17% from food & consumer goods and 6% across all other industries.
The tasks being automated follow the same pattern. Interact Analysis, in its 24 June 2026 shipment forecast, expects robot automation of material handling tasks to grow 7.0% a year and assembly tasks 6.9% through 2030. For example, cobots accounted for 43.7% of first-half 2026 robot orders from life sciences buyers and 36.5% from electronics buyers in A3's order data, the two industries A3 singles out for cobot adoption.
Robot density by country
Robot density, the number of industrial robots per 10,000 manufacturing employees, is the International Federation of Robotics' measure of factory automation in a country's manufacturing sector. South Korea leads at 1,220 for 2024, followed by Singapore at 818, Germany at 449 and Japan at 446. The world average is 132.
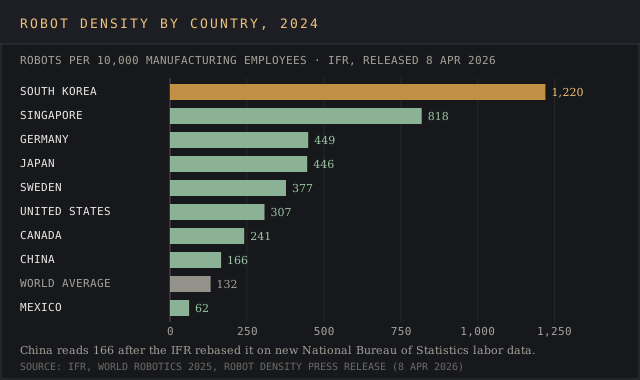
Want a robot density chart like this for the countries you sell into? Send the list.
Email a briefThe United States ranks eighth at 307, two places higher than a year earlier. Canada sits at 241 and Mexico at 62. By region, Western Europe averages 267, the EU-27 231, North America 204 and Asia 131.
China's figure is the one to read carefully. The IFR's November 2024 density release put China at 470 robots per 10,000 employees for 2023, ahead of Germany (429) and Japan (419), with the United States at 295 in 11th place and a world average of 162.
The April 2026 release lists China at 166, 22nd worldwide, "based on updated labor market data issued by China's National Bureau of Statistics." The denominator changed, so 470 and 166 sit on different bases. On the new basis China's density rose 17% in a year. Analysts who rely on the older figure have to go back to the drawing board and use one basis throughout, since China's count drives the world average too: it moved from 162 to 132 between the two releases.
Collaborative robots
Collaborative robots are designed to work in a shared environment with people, and they're a small share of units and a smaller share of money. The IFR's World Robotics 2026 press conference put cobots at 11% of global industrial robot installations in 2025. In North America, A3 counted 7,212 cobots ordered in 2025, worth $241 million, accounting for 19.6% of units and 10.7% of order revenue.
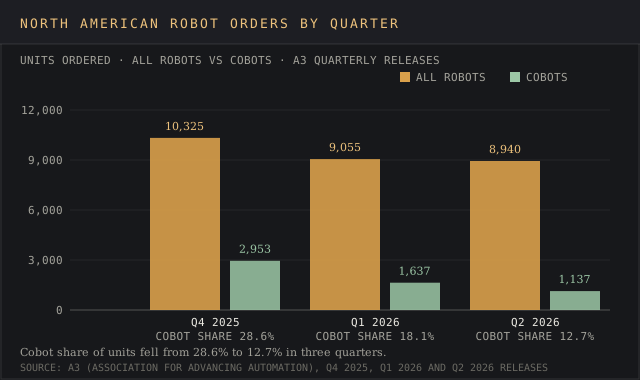
Quarterly cobot data swings hard. Cobot orders jumped 55.6% in units and 78.2% in revenue in the first quarter of 2026, to 1,637 units and 18.1% of all robots ordered, in A3's Q1 release. In the second quarter the share fell to 12.7% on 1,137 units, after a fourth quarter of 2025 that ran at 28.6%. Keep an eye on the full-year data before reading a trend into one quarter of cobot adoption.
- The robot type, industry or region to cover
- Regions, years and segments
- Where it runs: blog, white-label, gated or lead magnet
- Whose byline goes on it
- Deadline
- 2,500+ words, human-written
- Every figure linked to its source
- Yours to publish, under your name or none
- Hosting here for +$200, with your sponsored links
MarketsandMarkets values the cobot market at $1.42 billion in 2025, rising to $3.38 billion by 2030 at an 18.9% CAGR. Interact expects automation demand to lift cobot shipments 17.4% a year from 2025 to 2030, compared with 5.0% for articulated arms and 5.9% for SCARA robots in manufacturing.
Teradyne, which owns Universal Robots and MiR, says its robotics unit has sold over 110,000 cobots worldwide, in its 10-K for 2025. Universal Robots' own blog claims "the fastest payback in the industry at only 195 days." A plant buying a cobot for the first time should model payback from its own labor rates, operating costs, production volume and process cycle times, since the vendor figure is a marketing claim.
North American robot orders
A3, the Association for Advancing Automation, publishes North America's quarterly robot order count. Its release Robot Orders Grow 6.6% in 2025 as General Industries Drive Broader Automation Adoption puts 2025 at 36,766 robots worth $2.25 billion, up 6.6% in units and 10.1% in revenue. Fourth-quarter orders reached 10,325 units and $579 million.
The first quarter of 2026 was flat, in A3's words Robot Orders Hold Steady in Q1 2026 as Demand Broadens Across Non-Automotive Industries: 9,055 units, down 0.1%, and $543 million, down 6.4%. Automotive OEM orders fell 35.1% in units and 48.2% in revenue against the same period a year earlier.
The second quarter brought 8,940 robots worth $622 million, up 4.3% in units and 21.3% in value, so revenue grew almost five times faster than units. Read between the lines and the buyers changed: automotive OEM orders fell 25% in the first half, while non-automotive industries, accounting for 56% of second-quarter units, ordered more.
First-half orders totaled 17,995 units and $1.166 billion, up 2.0% and 6.6% on the same period of 2025.
Robotics market size: why the published estimates diverge
Five published figures for the robotics market span $50 billion to $90.2 billion for the latest year, and two forecasts land above $200 billion. That spread is par for the course in market sizing, and the devil's in the details of each definition: what counts as a robot, which year is the base, and if software, integration and consumer devices are in.
| Publisher | Report and date | Scope | Latest estimate | Forecast |
|---|---|---|---|---|
| IFR | World Robotics 2026 press conference (Sep 2026) | Industrial robot systems, software and peripherals | $50B a year (2025) | Units only |
| Mordor Intelligence | Robotics Market Size & Share, 2026 to 2031 (23 Jul 2026) | Industrial, service, cobots and AMRs; hardware, software and services | $73.64B (2025); $88.27B (2026) | $218.56B by 2031, 19.86% CAGR |
| GlobalData | Robotics, Strategic Intelligence (Oct 2025) | Industrial ($24.6B) and service ($65.6B) robots | $90.2B (2024) | $205.5B by 2030, 15% CAGR |
| MarketsandMarkets | AI Robots Market | AI-enabled robots | $6.11B (2025) | $33.39B by 2030, 40.4% CAGR |
| MarketsandMarkets | Collaborative Robot Market | Cobots | $1.42B (2025) | $3.38B by 2030, 18.9% CAGR |
| Interact | Industrial robot shipments (24 Jun 2026) | Industrial robot units | 549,555 units (2025) | 761,303 units by 2030 |

GlobalData's $90.2 billion includes $65.6 billion of service robots and names drones, exoskeletons, logistics and consumer robots as its fastest-growing segments. Its industrial slice, $24.6 billion for 2024, is less than half the IFR's $50 billion turnover figure for 2025, which adds software and peripherals to the arm itself. Europe, Asia and the Americas are all inside both totals.
Mordor draws its line around the robot system: it excludes standalone sensor sales, generic software licenses and machinery sold outside a robot system, and includes defense, healthcare and consumer settings. Its $88.27 billion for 2026 and $218.56 billion for 2031 sit on that definition.
The unit counts disagree too. Interact counted 549,555 industrial robot shipments in 2025, up 5.1%, which represents more than 50,000 fewer robots compared with the IFR's 600,000-plus installations, up 11%. Interact forecasts 761,303 units by 2030; the IFR said in 2025 that installations would pass 700,000 by 2028.
Investors interested in the money figures need a key working rule, and so does any automation investment plan that would rely on a forecast: quote the IFR for units and density, A3 for North American orders, and a research house only with its scope and base year attached. A budget built on one house's forecast puts all your eggs in one basket.
A single market research report costs real money, and a $218.56 billion forecast and a $50 billion turnover figure measure different things.
Service, medical and consumer robots
Professional service robot sales rose 24% to almost 250,000 units in 2025, per the IFR's World Robotics 2026 Service Robots release (30 September 2026). Transport and logistics was the top application at 117,000 units, the category that holds autonomous mobile robots working in warehouse operations and fulfillment hubs.
The IFR counted almost 250,000 professional service robots sold in 2025, up 24%, with transport and logistics the top application at 117,000 units.
Growth in professional service robot sales, 2025
Source: IFRe.g. warehouse robot adoption in your country
Source: linked, checked, datedMedical robot sales grew 19% to 15,300 units, and consumer service robots climbed 37% to 34.2 million units, according to the International Federation of Robotics' press conference deck.
Humanoids are a drop in the bucket next to that. The IFR counted nearly 7,000 full-size humanoid robots sold in 2025 and 174 humanoid manufacturers, so humanoid development is concentrated in China, home to more than half of them. The jury's still out on humanoids capable of factory work: BMW tested Figure's humanoid at its Spartanburg plant for several weeks in 2024, then said no Figure robots were at the plant and no timetable was set.
Intuitive Surgical's filings give the medical side a company-level check. It reported 18% growth in worldwide da Vinci procedures in 2025, 1,721 systems placed, with da Vinci 5 accounting for 870 of them, and preliminary revenue of $10.06 billion, up 21%, in its 14 January 2026 release.
Robotics companies and deals
| Company | Figure | Period | Source |
|---|---|---|---|
| Fanuc | ¥378.6B robot division sales, 44.1% of ¥857.8B | Year to 31 Mar 2026 | FY2025 results reference |
| ABB Robotics | $2.279B revenue; 7,000 employees | 2024 | SoftBank release, 8 Oct 2025 |
| SoftBank | $5.375B to buy ABB Robotics; closing planned mid-to-late 2026 | Signed 8 Oct 2025 | SoftBank release |
| Teradyne | 110,000+ cobots sold | Cumulative to 2025 | Form 10-K, FY2025 |
| Intuitive Surgical | $10.06B revenue, up 21% | 2025, preliminary | Release, 14 Jan 2026 |
ABB Robotics' revenue moved from $2.258 billion in 2022 to $2.452 billion in 2023 and back to $2.279 billion in 2024, the pro forma figures SoftBank published with the deal. SoftBank's $5.375 billion price works out to 2.4 times that 2024 total revenue, and closing is expected in mid-to-late 2026 after a regulatory approval process in the EU, China and the U.S.
Productivity, jobs and the workforce
Academic estimates of robots' productivity effect are modest. Graetz and Michaels found that increased robot use contributed 0.36 percentage points to annual labor productivity growth across 17 countries from 1993 to 2007, in the Review of Economics and Statistics (2018). They also reported improvements in total factor productivity, the efficiency of all inputs combined, and lower output prices.
Manufacturer surveys run higher. The 2019 Deloitte and MAPI Smart Factory Study, covering more than 600 executives at U.S. manufacturers, reported average improvements of 10% in production output, 11% in factory capacity utilization, an efficiency measure, and 12% in labor productivity from smart factory technologies.
The study measured smart factory programs as a whole, so robots are one input among several new technologies. Its one quality figure is a case study: a U.S. tools maker cut defects per million by 16%.
Robot users employ more people than their count suggests. Statistics Canada found that robotics adopters were 2.0% of businesses in 2022 and accounted for 7.5% of employment and 11.5% of revenue. The same article cites Dixon (2020), who found Canadian firms that adopted robots grew their workforce by nearly 20% on average.
Skills are the main brake on adoption. Canadian enterprises rated these as significant obstacles to robotics technologies:
- Difficulty recruiting qualified staff: 25.2%
- Low return on investment or a long payback period: 21.4%
- Difficulty accessing financial support: 19.6%
In the U.S., Census Bureau researchers using the 2019 Annual Business Survey of over 300,000 firms found adoption of AI and robotics technologies concentrated in large and young firms, with 12% to 64% of U.S. workers and 22% to 72% of manufacturing workers exposed to those technologies. Our AI adoption statistics carry the wider survey data.
Robotics adoption in Canada
Statistics Canada's Survey of Advanced Technology gives a national adoption rate for robotics technologies that unit counts can't. In 2022, 2.0% of Canadian enterprises in surveyed industries used robotics technologies. Manufacturing firms adopted at 8.4%, a sign of how concentrated robots are in factories, almost three times the next sector, retail trade, at 3.3%.
Most Canadian companies that adopt robotics and automation buy their technologies. 73.0% sourced them only from external providers, 7.4% developed them in-house only, and 19.6% did both. Adopters also innovate more: 77.7% introduced an innovation, compared with 42.9% of non-adopters, in the release of 28 August 2024. In-house development of robotics technologies is rare in Canada.
Canada's economy runs at a robot density of 241 per 10,000 manufacturing employees in the IFR's April 2026 ranking, above the North American average of 204.
Robotics forecasts for the next few years
The IFR expects future robot installations to keep growing, with global demand led by Asia. Its World Robotics 2026 deck projects 2026 growth of 11% in Asia, 0% in Europe and 2% in the Americas, followed by compound annual growth of 8%, 6% and 2% for 2027 to 2029.
Interact's base case is 6.7% average annual growth from 2025 to 2030, to 761,303 shipments, with India growing 12.5% a year and Germany 3.7%. China launched its national robotics development strategy ten years ago, and its 15th Five-Year Plan covers 2026 to 2030, the IFR noted in June 2026, and China's domestic suppliers already hold 55% of their home market.
AI technologies, machine learning first among them, sit behind the fastest forecasts, and AI development is where the growth rates run highest. MarketsandMarkets' AI robots forecast grows 40.4% a year, more than twice the 18.9% it projects for cobots. Our AI statistics report covers the model side of that spend.
How robotics statistics are collected
Each publisher counts a different event, and the counting process is the key difference between them. The IFR counts robots installed, by country and customer industries, in its annual World Robotics reports, with robot density calculated against national manufacturing employment.
A3, the automation trade group, counts robots ordered from its reporting companies in North America each quarter across industries, and the organization adjusts growth rates for matching reporting cohorts.
National statistics offices measure adoption at the business level. Statistics Canada asks enterprises which advanced technologies they use. The U.S. Census Bureau's Annual Survey of Manufactures collects plant-level robotics data for 2018 to 2021, with tables released on 29 February 2024. Research houses publish revenue estimates for robot systems under their own scope definitions, which is why their totals range from $50 billion to $90.2 billion.
For any statistical analysis across sources, keep installations, orders and revenue in separate columns. Treat the IFR's unit series as the reliable anchor, since it covers every major market by country.
Delivered for your site and your byline. Hosting here is optional.
Frequently asked questions
What are the big 4 of robotics?
The name usually refers to the four industrial-arm makers Fanuc, ABB, Yaskawa and KUKA. Fanuc booked ¥378.6 billion in robot sales in its year to March 2026, and ABB agreed to sell its robotics division, with $2.279 billion of 2024 revenue, to SoftBank for $5.375 billion.
What kind of math is used in robotics?
Linear algebra and calculus for motion, and probability and statistics for sensing and planning under uncertainty. Stanford teaches a full course on the second, CS 226, Statistical Techniques in Robotics.
What are 10 interesting facts about robotics?
- Factories installed more than 600,000 industrial robots in 2025.
- 5 million industrial robots were working at the end of 2025.
- China installed 354,200 robots in 2025, 59% of the world total.
- South Korea runs 1,220 robots per 10,000 manufacturing employees.
- The United States moved to second place in installations with 38,400.
- U.S. food and beverage installations rose 30% in 2025.
- Professional service robot sales rose 24% to almost 250,000.
- Consumer robot sales reached 34.2 million units.
- Nearly 7,000 full-size humanoids were sold in 2025.
- Teradyne has sold over 110,000 cobots.
Is robotics in high demand?
Yes, and the IFR and A3 counts support that answer. Installations rose 11% in 2025, North American order value rose 21.3% in the second quarter of 2026, and the top obstacle Canadian enterprises reported was recruiting qualified staff, at 25.2%. That 25.2% is a skills gap in robotics jobs, and it outranks the 21.4% who cited payback, while cobot orders rose 55.6% in the first quarter of 2026.
Bottom line
Robot automation is at record levels and still climbing: more than 600,000 installations in 2025 and 5 million robots working in factories, with China installing 59% of them. The unit and density data from the International Federation of Robotics and A3 are reliable enough to build on, as long as you use one density basis and keep orders separate from installations and adoption rates.
The market value figures deserve less trust. Five houses span $50 billion to $90.2 billion for the latest year and $205.5 billion to $218.56 billion for the forecasts, because each defines the market differently. Quote them with the publisher, the base year and the scope, or quote units.
For manufacturing operations teams the useful numbers are the narrow ones: cobot share of orders, robot density in your own country, and the payback your own plant can prove.
Robot makers, system integrators and industrial investors use reports like this one in sales decks and investor updates.
A report on your topic for a blog page, gated content or a lead magnet.
Written for your client and published under their brand, with my name left off.
Your report on marketintelligencetools.com, with 2 to 3 CTAs carrying your sponsored links.
Default terms: the report is yours to publish, and I keep the right to republish it on this site behind a gate, outside Google's index.
The federations, trade groups and filings behind each robotics figure, and the country counts still to come
Installations and density: ifr.org (World Robotics 2026 releases of 24 and 30 September 2026 and the press conference deck; robot density release, 8 April 2026; U.S. release, June 2026; World Robotics 2025, 25 September 2025; World Robotics 2024) and businesswire.com (IFR density release, 20 November 2024).
Orders, shipments and market sizes: automate.org (A3 releases for full-year 2025, Q1 2026 and Q2 2026), interact-analysis.prezly.com (shipment forecast, 24 June 2026), mordorintelligence.com (Robotics Market, 23 July 2026), globaldata.com (Robotics, October 2025) and marketsandmarkets.com (AI Robots and Collaborative Robot markets).
Companies: fanuc.co.jp (FY2025 results reference), sec.gov (Teradyne Form 10-K for 2025), blog.universal-robots.com, investor.intuitivesurgical.com (14 January 2026), group.softbank (8 October 2025) and press.bmwgroup.com.
Productivity and adoption: cep.lse.ac.uk (Graetz and Michaels, Review of Economics and Statistics, 2018), deloitte.com (2019 Deloitte and MAPI Smart Factory Study), www150.statcan.gc.ca (Survey of Advanced Technology release, 28 August 2024), census.gov (working paper CES-WP-22-12; Annual Survey of Manufactures robotics tables, 29 February 2024) and cs226.stanford.edu.
Every figure was checked against its source on 14 October 2026. The IFR gives South Korea and Germany a 2025 range of 25,000 to 38,000 installations until the full World Robotics volume lists each country, and China's density figures before and after April 2026 sit on different labor data.