How to write a report on industry from primary data
 By Jan Suski. I go deep on every review, checking every number against its source and digging up details other coverage misses, a habit from six years of SEO and link building for tech companies. Bylines at Surfer, Brand24, and Senuto. How the scoring works.
The short version 11 points · 40 seconds
- 01An industry report measures the producers in one NAICS codeCustomers and demand go to market research
- 02Pick the NAICS code before touching any figure2022 edition: 20 sectors, 1,012 industries
- 03Scope moves US auto employment from 285,800 to 967,100BLS 2025 averages, NAICS 3361 vs 3361 to 3363
- 04Seven sections carry the report, in a fixed orderDefinition opens it, the outlook closes it
- 05The Economic Census represents over eight million locations2022 edition fully released in March 2026
- 06BLS QCEW covers over 95% of US jobs every quarterBEA adds quarterly GDP by industry
- 0710-K filings describe each company's competitive conditionsRequired by SEC Regulation S-K Item 101(c)
- 08Five forces, SWOT and PESTEL go in after the dataThey sort what the numbers already show
- 09Report measured change first and forecasts secondIEA: over 20 million electric cars sold in 2025
- 10A single IBISWorld US industry report lists at $2,850Spotlight reports cost $800 for 10 to 20 pages
- 11Mixing NAICS scopes is the most common report flawCensus revenue vs BEA value added comes next
An industry report is a structured document that measures one group of producers: how many establishments it has, what it ships, who holds the market share, what feeds its supply chain and where it's heading. The good industry reports share one habit. They pin the industry to a classification code before touching a figure.
This guide is for analysts, consultants, business owners and students who've done market research on buyers and now need the supply side in a form a lender, a board or a professor will accept. It covers the build order, from definition through industry analysis to forecast: which free federal statistics supply each section, how SEC filings fill in the competitive landscape, where paid industry reports earn their price, and the mistakes that break one.
It matters because the definition alone can move a headcount by a factor of three. The worked example is the US automotive industry, where that gap shows up in official BLS data.
What an industry report measures, and where market research takes over
Industry reports are focused on supply. Their unit is the producer: the establishment, the firm, the plant. NAICS, the classification most US industry data hangs on, groups establishments by how they produce, so a car assembler and a tire maker sit in different codes even when they sell to the same customers.
Market research points at customers, their consumer behavior and their willingness to pay. The two meet at market size and market share, and that's where most confusion starts. The guide to market intelligence vs market research lays out the wider split. For a report on one industry, supply-side questions stay here and demand-side questions go to market research methods such as surveys and interviews.
Industry analysis is the interpretation layer, turning figures into insights on margins, entry strategies and rivalry between companies. Industry research is the collection work underneath it. Keep the two labelled separately in your notes, and a reviewer can trace each claim in the analysis back to the row of industry data it came from. The market intelligence fundamentals page places both, and the industry insights they produce, inside the wider discipline.
Pick the NAICS code before collecting industry data
The 2022 edition of NAICS divides the US economy into 20 sectors and 1,012 industries, according to the Census Bureau's 2022 NAICS Manual. The US, Canada & Mexico agreed to review it every five years. Car making sits at 336110, Automobile and Light Duty Motor Vehicle Manufacturing, and every particular industry from food to pharmaceuticals to computer hardware has a code of its own.
Below the code, market research splits the industry into market segments. A medical device report separates cardiovascular, orthopedic, dental, endoscopy, wound care and durable medical equipment. A pharmaceutical report splits drug discovery, drug delivery, OTC drugs and packaging, then adds therapy areas such as diabetes, cancer, obesity and hypertension.
Consumer goods split into household essentials, personal care, cosmetics and consumer electronics; food splits into baked goods, dairy and plant-based products, with food safety running across all of them.
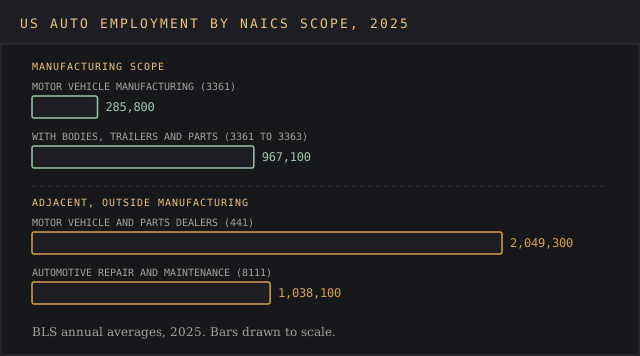
The code on page one sets every figure that follows, and the devil's in the details. The BLS automotive industry page shows it plainly. In 2025, motor vehicle manufacturing (NAICS 3361) averaged 285,800 employees. Add bodies, trailers and parts (3361 to 3363) and the same industry name covers 967,100 people.
Dealer companies sit outside manufacturing altogether. Motor vehicle and parts dealers (NAICS 441) averaged 2,049,300 employees in 2025, and automotive repair and maintenance (8111) another 1,038,100. One report can say the auto industry employs about a million people and another can say four million, and both can be quoting BLS correctly. The automotive industry statistics report walks through where published auto figures part ways for this reason.
SEC filings still use the older SIC system. The SEC's SIC code list puts Motor Vehicles & Passenger Car Bodies at 3711 and Motor Vehicle Parts & Accessories at 3714, and those codes become the filter for pulling listed companies' filings later.
Reports that compare domestic and international markets meet a third system: Eurostat's structural business statistics give coverage of European businesses under NACE Rev. 2, so the report needs a concordance between codes before any totals go side by side.
The seven sections of an industry report and their sources
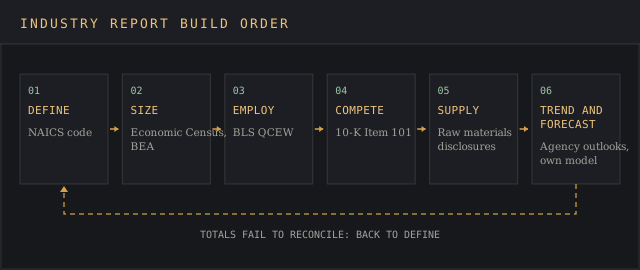
Industry reports built this way answer one question per section, and each question has a primary source that publishes the answer. The table maps them for a US report.
| Section | Question it answers | Primary source |
|---|---|---|
| Definition and scope | Which establishments count? | NAICS Manual; SEC SIC list |
| Size and structure | How many establishments, how much revenue or shipments? | Economic Census; Annual Integrated Economic Survey |
| Employment and wages | How many people, at what pay, where? | BLS QCEW |
| Output | What does the industry add to GDP? | BEA GDP by industry |
| Competitive landscape | Who are the top competitors and how do they compete? | 10-K filings under Regulation S-K Item 101 |
| Supply chain and inputs | What raw materials, energy and suppliers does it depend on? | 10-K raw materials disclosures; trade publications |
| Trends and outlook | What's changing, measured and forecast? | Agency outlooks such as the IEA; your own model |
Definition gets the ball rolling because every later section depends on it, and the outlook goes last because it's the only section built on assumptions. The market research report template and the market intelligence report template carry a similar skeleton as a ready document to fill.
Government publications and databases for industry research
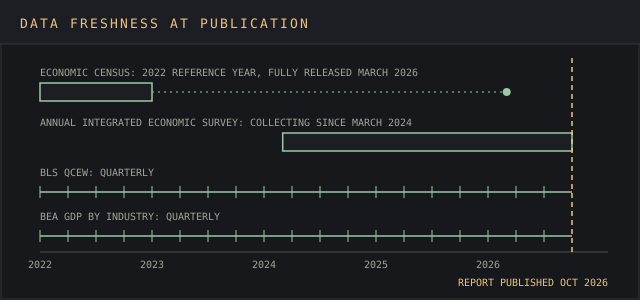
The 2022 Economic Census is the official count of US business establishments. It runs every five years, for years ending in 2 and 7, and represents over eight million business locations. The 2022 edition finished its staged releases in March 2026.
So a report published this autumn works with benchmark numbers that describe 2022; the census trades freshness for depth. That lag is par for the course for census data. Write the reference year next to every figure.
Between censuses, annual manufacturing statistics used to come from the Annual Survey of Manufactures. The Census Bureau moved that survey into the Annual Integrated Economic Survey, which began collecting data in March 2024, so a time series stitched from both needs a footnote at the break.
BLS covers the freshness gap. Its Quarterly Census of Employment and Wages tallies employment and pay every quarter from employer reports, with coverage of over 95% of US jobs, at county, metro, state and national level. That's the series to search when a report needs headcount by region.
Output comes from BEA. Its GDP by industry statistics measure each industry's value added, its contribution to economic growth, and arrive with the third GDP estimate each quarter.
These agencies give open access to the lion's share of what US industry reports need, and their resources and databases cost nothing. The secondary market intelligence guide covers judging such research resources, and data source attribution techniques covers citing them so each number survives a reviewer's check.
Building the competitive landscape from 10-K filings
Public companies write a chunk of the competitor section of most industry reports for you. SEC Regulation S-K Item 101(c) requires companies to address, in a 10-K's business description, the "status of development efforts for new or enhanced products, trends in market demand and competitive conditions," resources such as the sources and availability of raw materials, seasonality and the number of people employed.
That's straight from the horse's mouth, in a filing made under securities law.
EDGAR full-text search gives free access to electronic filings, with full-text coverage back to 2001. Filter by SIC code 3711, search the 10-Ks for competition, and you get each company's own account of its competitors, its supply chain risks, its market segments, its product innovation and the technological advancements it's betting on. Private companies leave gaps that company data providers fill at a price.
Market share needs a numerator and a denominator from the same scope. Divide a company's segment revenue by an industry total built on the same NAICS definition, then run it through the market share calculator. The competitive analysis template holds a row for each of your competitors.
Frameworks come after the data, as the industry analysis step. Michael Porter's five competitive forces, set out in the January 2008 Harvard Business Review, sort findings into rivalry among existing competitors, the power of suppliers, the power of customers, the threat of new entrants and the threat of substitutes.
A SWOT analysis summarizes one company's competitive positioning against industry leaders and direct competitors. A PEST analysis, or its PESTEL extension, catches regulatory and environmental pressure. Industry life cycle and value chain analysis place the industry in time, from innovation through development to maturity, and along its inputs.
A benchmarking report compares one firm's strategies against the leading companies. A SWOT analysis with no figures behind it is a red flag to anyone who has read a few.
Market trends: measured change first, forecasts second
A trend section in industry reports earns trust by reporting what already happened before projecting. The International Energy Agency's Global EV Outlook 2026 counted electric car sales growing 20% to over 20 million in 2025, a quarter of all new cars sold. It expects 23 million in 2026, a 28% share. The first figure is a count. The second is a forecast, and the report should label it as one.
The same split applies to technology trends. A technology industry report on software tracks cloud computing, AI and cybersecurity spending. Technological advancements such as electric vehicles, industrial automation, 3D printing or generative AI show up in measured series first: capital spending in BEA's accounts, headcount shifts in QCEW, new risk factors in 10-Ks. A networking hardware report adds 5G rollouts to the same list.
Test each candidate driver against a measured series before it goes into the analysis: AI moving from pilots into embedded workflows, cloud migration, cyber threats and data breaches, hybrid work tools, skills-based hiring, data-center and green energy capital spending, trade rules and energy costs pressing on suppliers, and eco-friendly sourcing. Each one that survives gets a figure and a date; the rest go to a watch list in the market research notes.
Industry news articles and trade publications spot them earlier and deserve a place on the research reading list. Keep an eye on those articles and the trends they flag, and treat each one as a lead to check against an official series.
For industries worldwide, intergovernmental organizations extend the picture into the global economy. An energy industry report splits into battery storage, wind, solar, natural gas, petroleum and electricity market segments, each shaped by environmental rules, and the International Energy Agency publishes outlooks for each.
Market size belongs here only as an input. Estimating it is its own method, covered in the market sizing template; the industry report cites the result and its base year. Run any growth rate through the CAGR calculator with the start and end years written beside it, and log recurring trends in a trend tracker so the next edition starts up to speed.
When buying market research reports beats building your own
Paid market research reports compress weeks of research into one download. IBISWorld's own price list puts a single US Industry Research Report at $2,850 and a US Industry Spotlight Report, with 10 to 20 pages of industry data, charts and tables, at $800. The company notes that an annual membership, which gives access to hundreds or thousands of reports, can work out cheaper than single purchases.
That price buys speed, depth, a consistent structure and a finished industry analysis. It also buys someone else's industry definition, so check which industry classification the publisher used before merging its figures with your own. Resellers such as MarketResearch.com aggregate publications from many sources, and the same scope check applies to every one.
For a one-off business decision such as a market entry, $2,850 is a drop in the bucket. Companies that write industry reports every quarter should compare subscription costs in the market research cost breakdown and the market research tools ranking. Paid industry insights work best as a cross-check on the government series, with the free research as the base.
Mistakes that make industry reports impossible to check
Mixing scopes is the most common flaw in industry reports. A headcount for NAICS 3361 next to a revenue total for 3361 to 3363 produces a revenue-per-employee figure that's off by a factor of three, and the error stays invisible on the page.
Comparing Census revenue with BEA value added comes second. Value added subtracts purchased inputs, so for a manufacturer the two numbers sit far apart, and a report that calls both industry size contradicts itself. Quoting a growth rate without its base year and publisher comes third; that's how a vendor's press-release CAGR ends up in companies' board decks.
Undated figures round out the list. A census number for 2022 and a QCEW number for 2026 can both be correct and still describe two different industries. Any one of these sends a reviewer back to square one. The fix is identical for all four: put the industry code, the reference date and the source link next to every figure, and reconcile multiple sources before the research goes out.
FAQ
What's the biggest industry right now?
By US employment, healthcare and social assistance. The BLS employment by major industry sector table puts private healthcare and social assistance at 23.29 million jobs in 2025, out of 170.28 million in total, and projects 25.49 million by 2035. Manufacturing, the sector most industry research starts from, employed 12.63 million in the same BLS employment statistics. The healthcare market intelligence guide covers the data sources behind healthcare industry reports.
Where can I find industry reports?
Free resources come from government agencies: the Census Bureau, BLS and BEA in the US, Eurostat and the IEA for international markets. Paid market research reports come from publishers such as IBISWorld and resellers such as MarketResearch.com, often with free access through a public or university library's research databases. Search EDGAR for public companies' 10-K filings, the third source and the cheapest one for competitor detail.
What are examples of industry reports?
This site publishes several such articles, each pairing a defined scope with sourced figures: the construction market report, the UK retail market report and the automotive market intelligence guide.
How do I write an industry report?
Choose the classification code, then fill seven sections in order: definition, size and structure, employment, output, competitive landscape, supply chain, and trends with an outlook. Source each figure to the agency or filing that published it, date it, and run the industry analysis frameworks last. The market intelligence analysis guide covers the analysis step in more depth.
How often should an industry report be updated?
Match the cycle to the fastest series the report relies on. QCEW and BEA's GDP by industry move quarterly, while the Economic Census and NAICS itself run on five-year cycles. Companies that want to stay competitive refresh employment and output each quarter, so informed decisions rest on current figures, and rebuild the structure section after each new census.
What's the difference between an industry report and a market report?
An industry report is focused on producers grouped by classification. A market report is focused on customers, spending and market size. The types of market intelligence page covers industry intelligence as a related category next to its four main types.
Bottom line
An industry report is only as good as the definition on its first page. Pick the code, take each section's numbers from the agency or filing that publishes them, and label every figure with its year and scope. That's the whole method, and it's what turns industry analysis into informed decisions and actionable insights. The market intelligence strategy guide covers turning those research findings into strategies.
Skip the definition and the report fails quietly until someone uses it: an employment figure three times too large, a market share built on mismatched totals, a forecast presented as a count. Those errors travel through organizations into budgets, pricing strategies and investment cases, and the report takes the blame when the numbers miss the mark. The competitive edge of good industry research is a page of figures a reviewer can check in five minutes.