Data center statistics 2026: 485 TWh of power, 1.4% vacancy and $409B in capex
 By Jan Suski. I go deep on every review, checking every number against its source and digging up details other coverage misses, a habit from six years of SEO and link building for tech companies. Bylines at Surfer, Brand24, and Senuto. How the scoring works.
The numbers Global and U.S. data centers, checked 17 October 2026
Data center electricity demand grew 17% in 2025 while capex at the four largest U.S. cloud builders grew 72%, so spending is running ahead of the load it will create.
With vacancy at 1.4% and more than 80% of capacity under construction preleased, new data centers in North America are sold before they're energized.
U.S. data centers accounted for 1.9% of national electricity consumption in 2018 and 4.4% in 2023, and the government's own lab expects 11.8% by 2030.
I'll write a 2,500+ word report on the market you name, with power, capacity and capex figures linked to their sources. Yours to publish, from $200.
Data centers worldwide used 485 TWh of electricity in 2025, up 17% in one year, according to the International Energy Agency's Key Questions on Energy and AI. Global electricity demand grew 3% over the same period. Data centers are adding load more than five times faster than the grid they plug into, and artificial intelligence is the reason forecasters give for the rapid growth in energy demand.
The money moves faster still. Amazon, Microsoft, Alphabet and Meta spent $408.8 billion in cash on property and equipment in their latest fiscal years, 72% more than the year before. In North America's eight primary markets, CBRE measured vacancy at 1.4% in the first half of 2026, so almost all new data centers are leased before they open.
This report collects the data center statistics quoted most often and names the publisher, date and method behind each: energy consumption, U.S. electricity share, market size, counts, vacancy, capex, efficiency, water and local politics. It's for analysts, investors and utility planners who need to know how much power data centers draw.
Data center energy consumption statistics: how much energy data centers use
The International Energy Agency's answer to how much energy data centers use is 485 TWh of electricity consumption in 2025, with energy use at data centers built for artificial intelligence up 50% in the year.
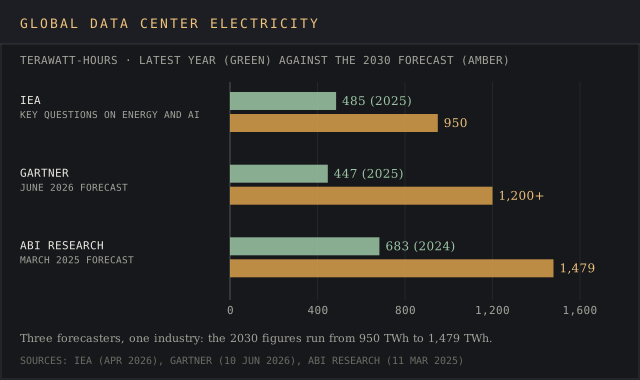
Its central case for data center electricity demand reaches 950 TWh by 2030, about 3% of the world's electricity demand. That's roughly double in five years, and the agency expects consumption at AI data centers to triple over the same stretch.
The year before is the energy use baseline most older articles still quote. The agency's 2025 Energy and AI report estimated that data centers consumed around 415 TWh, about 1.5% of global electricity consumption in 2024, after five years of roughly 12% annual growth in power consumption. The same report projected 945 TWh by 2030.
Gartner counts lower and forecasts higher. Its June 2026 release puts data center power consumption at 447 TWh in 2025 and 565 TWh in 2026, a 26% rise in energy use, with demand in gigawatts up 27% (104 GW to 132 GW). Gartner sees more than 1,200 TWh by 2030, and expects servers built for AI to draw 31% of data center power in 2026 and to pass conventional servers in 2027.
ABI Research sits furthest out. Its March 2025 forecast starts at 683 TWh in 2024 and reaches 1,479 TWh by 2030, a 14% CAGR.
A 2024 power consumption figure of 620 TWh also circulates on Wikipedia, which sits between the agency's 415 TWh and ABI's 683 TWh for the same calendar year, so the answer to how much energy data centers use depends on whose meter you read. The power consumption gap between the agency's 950 TWh and ABI's 1,479 TWh for 2030, 529 TWh, is larger than all data centers used in 2024 on the agency's count.
Copy these lines into an email, fill them in and send. I reply with scope and a price within 2 to 3 business days.
Open the email| Forecaster | Latest year | 2030 forecast | What drives the gap |
|---|---|---|---|
| International Energy Agency | 485 TWh (2025) | 950 TWh | Central case; AI-focused load triples |
| IEA, Energy and AI (2025) | 415 TWh (2024) | 945 TWh | Earlier base case, same method |
| Gartner | 447 TWh (2025) | 1,200+ TWh | Also forecasts 290 GW of demand by 2030 |
| ABI Research | 683 TWh (2024) | 1,479 TWh | Higher starting base, 14% CAGR |
Inside data centers, servers take the lion's share of energy usage. The agency estimates that servers draw about 60% of the electricity data centers consume, storage systems about 5% and networking equipment up to 5%, so networking equipment and storage together take about a tenth of energy use.
Cooling systems use about 7% at efficient hyperscale facilities and more than 30% at less efficient enterprise data centers, which is why energy efficiency work starts at the cooling plant and why cooling weighs on operating costs in older data center operations.
Accelerated servers in AI data centers are the primary driver of growth. They account for nearly half of the net increase in power consumption to 2030, growing about 30% a year against 9% for conventional servers. Cooling and other infrastructure supply about 20% of the increase, which is why power efficiency in cooling systems still moves the total.
Energy use per AI task has dropped by at least an order of magnitude a year, per the agency, and total energy use keeps rising anyway, because demand grows faster than efficiency.
Carbon emissions follow the growing energy demand. The agency expects data center emissions to double to around 350 million tonnes of CO2 in 2035, about 2% of global electricity sector emissions.
Greenhouse gas emissions from data storage and compute remain a small slice of the world's electricity footprint, and the 2035 doubling is baked into the agency's central case. The agency also expects AI-driven GDP growth to raise global energy demand by 1% to 4% in 2035 against trend. The sister report on AI environmental impact statistics covers the per-prompt and water side.
U.S. data centers: electricity consumption from 76 TWh to 649 TWh
The longest U.S. power consumption series comes from Lawrence Berkeley National Laboratory. Its December 2024 report found that U.S. data centers accounted for about 76 TWh in 2018, 1.9% of U.S. electricity, and 176 TWh in 2023, 4.4%. Electricity consumption had sat near 60 TWh from 2014 to 2016, so the climb began well before the chatbot era. On the lab's 2023 figure, U.S. data centers consume about 2.3 times what they did in 2018.
The lab's forecasts of how much energy U.S. data centers will use have only gone up. The 2024 report projected 325 to 580 TWh in 2028, or 6.7% to 12.0% of U.S. electricity consumption. Its June 2026 update, prepared by Lawrence Berkeley National Laboratory for the Department of Energy, raised the horizon to 2030 with a reference case of 649 TWh, 11.8% of U.S. electricity, inside a range of 521 to 843 TWh, or 9.5% to 15.3%.
For the recent past, the International Energy Agency counts a little higher. Its 2025 report put U.S. data center energy use at about 540 kWh per person in 2024, and Pew Research Center, citing the same report, puts the total at 183 TWh, more than 4% of the country's total electricity demand. The base case adds about 240 TWh of energy demand by 2030, a 130% rise.
The Energy Information Administration looks further ahead, and wide ranges are par for the course in its Annual Energy Outlook 2026, which models growing energy demand across every building type. In it, servers alone used about 7% of commercial sector electricity consumption in 2025, and server consumption reaches 446 to 818 billion kWh by 2050 depending on the case.
EIA also assumes space cooling in data center floorspace is as much as 2.9 times as energy intensive as ordinary commercial floorspace, so cooling systems weigh on energy costs and operating costs alike.
Where the electricity generation behind data centers comes from matters for carbon emissions and energy costs. The agency's breakdown shows natural gas supplies over 40% of U.S. data center electricity, with renewable energy sources at 24%, nuclear around 20% and coal around 15%.
Worldwide the order flips: coal leads at about 30%, renewables 27%, natural gas 26% and nuclear 15%. To 2030, natural gas adds more than 130 TWh of annual electricity generation to power data centers in the U.S., against 110 TWh from renewable energy sources.
State shares run far above the national figure. The Electric Power Research Institute estimated that data centers consume about a quarter of Virginia's electric load on 2023 figures, against roughly 4% nationally. Fifteen states held 80% of national data center load in that study, and EPRI's scenarios put data centers at 4.6% to 9.1% of U.S. electricity generation by 2030.
Data center market size: why the published estimates diverge
Five research houses published a 2025 figure for the global data center market, and the highest is 4.3 times the lowest. Each draws the boundary somewhere else, and the devil's in the details: Grand View and Fortune count hardware, software and services, Mordor ties its dollars to installed megawatts, and Gartner counts what buyers spend on data center systems.
| Publisher and report | Updated | 2025 figure | Forecast | What it counts |
|---|---|---|---|---|
| Gartner, worldwide IT spending forecast | 22 Apr 2026 | $505.6B | $788.0B in 2026 | Spending on data center systems, servers included |
| Precedence Research | 23 Sep 2026 | $386.7B | $1,103.7B by 2035, 11.06% CAGR | Global data center market; U.S. at $134.8B |
| Grand View Research | Sep 2026 | $383.8B | $902.2B by 2033, 11.3% CAGR | Hardware 67.4%, plus software and services |
| Fortune Business Insights | 28 Sep 2026 | $269.8B | $699.1B by 2034, 11.10% CAGR | Hardware, software and services |
| Mordor Intelligence | 22 Jan 2026 | $118.9B | $865.7B by 2031, 40.9% CAGR | Market value tied to 131,400 MW of capacity |

Want a market-size chart like this for your own segment? Send the segment and the years.
Email a briefThree of the houses agree on growth even where they split on the size of the data center sector. Precedence, Grand View and Fortune all model roughly 11% a year. Mordor is the outlier at 40.9%, and it's also the only one that publishes capacity in megawatts next to its dollar estimate: 131,400 MW in 2025, rising to 844,010 MW by 2031.
Gartner's number is a spending figure for data center systems, so it rises with every GPU server shipped. It grew 51.6% in 2025 and is forecast to grow 55.8% in 2026. The houses selling a report on the global data center market measure one that moves at a fifth of that speed. Read between the lines and the gap is mostly servers.
A $517.15 billion figure for data center services by 2030 also circulates in AI answers, but the 2025 article it traces to names no publisher, so it stays out of the table. Our guide on how to size a market sets the rule: name the house, the year and the boundary.
How many data centers there are, and who runs them
How many data centers exist depends on who keeps the list. Data Center Map currently lists 4,767 data centers across all 50 U.S. states. Virginia leads with 674, then Texas with 537 and California with 296, and Georgia hosts 276 data centers on the list. Illinois (242), Ohio (240), Arizona (160) and Oregon (135) round out the data center locations with the most listings.
Older figures for U.S. data centers run higher: 5,381 for March 2024, credited to the Cloudscene directory, still appears on Wikipedia. Directories include colocation suites selling digital services, enterprise rooms running virtual systems and planned new data centers to different degrees. Keep an eye on what each list includes.
Hyperscale data centers are counted more carefully, because a short list of tech companies owns the hyperscale facilities. Synergy Research Group counted 1,297 hyperscale data centers at the end of Q3 2025 and 1,360 one quarter later. The U.S. holds 55% of worldwide hyperscale operational capacity, up from 52% three years earlier. Synergy expects hyperscale capacity to double in just over 12 quarters as data centers expand.
Ownership of data centers is shifting toward the largest operators. Synergy's April 2026 analysis puts hyperscale operators at 48% of global data center capacity at the end of 2025, rising to 67% by 2031. Enterprise data centers are the share that shrinks.
- Hyperscale operators: 48% of capacity now, 67% by 2031
- Colocation data centers: 20% now, slowly falling
- Enterprise on-premise: 56% in 2018, 32% now, 19% by 2031
The fleet of data centers is also old. Uptime Institute analyst Jacqueline Davis reported in December 2024 that the mean age of a data center in Uptime's survey is 11.3 years, and the average megawatt is 10.2 years old. Traditional data centers built before the GPU era hold much of the installed base and few of the high-density racks that modern data centers are designed around.
The big three cloud providers rent most of the compute and data storage that runs in those data centers, and sell it back as cloud and artificial intelligence digital services. In Q2 2026 Synergy put cloud infrastructure services revenue at $143.4 billion, up 43%, with Amazon at 28%, Microsoft at 20% and Google at 15%. Those three major cloud providers held 63% of the market between them.
Capacity, vacancy and data center construction
Data center demand has North America's primary markets close to full. CBRE's H1 2026 report put vacancy at 1.4%, unchanged from year-end 2025, while net absorption rose nearly 12% to 1,456 MW.
Builders are working against the clock: CBRE counts less than 1,500 MW available for pre-leasing, about six months of supply. Under construction stood at 7,481 MW, and more than 80% of it was preleased, up from 74.3% a year earlier. Increased data center capacity hasn't loosened vacancy, even with total supply up 33.7% in a year.
Northern Virginia, the world's largest market for data center power on JLARC's count, is the tightest of the lot. CBRE measured 4,496.5 MW of inventory and 0.2% vacancy, with only 10.8 MW available and 2,420.2 MW under construction. The market absorbed 467.6 MW in six months, the highest of any primary North American market. Asking rents rose for every deployment size, led by 8.3% for 3 MW to 10 MW deals.
Global data center capacity keeps compounding as data centers expand into new regions. JLL's 2026 outlook expects 97 GW of new capacity between 2025 and 2030, taking the total to about 200 GW at a 14% CAGR, with the Americas holding about half. JLL also expects artificial intelligence to represent half of data center workloads by 2030, up from about a quarter in 2025.
Building new data centers costs an arm and a leg, and more each year. JLL puts the average shell-and-core build cost at $10.7 million per MW in 2025, up from $7.7 million in 2020, and $11.3 million in 2026. Across real estate, debt and tenant fit-out, it sizes the bill for data center growth through 2030 at up to $3 trillion, the cost of data center expansion at today's pace.
Data center construction is the busiest corner of U.S. building. ConstructConnect counted $84.1 billion of data center starts through July 2026, nearly three times the level a year earlier, across 136 new data center projects. The average project cost $1.06 billion against $352.8 million in 2025, and data centers made up nearly a quarter of all nonresidential building starts.
Switch says its Citadel campus near Reno can reach up to 17.4 million square feet with over 2 GW of power. Older lists still quote 7.2 million square feet for the same site.
Data center investments: hyperscaler capex reaches $408.8 billion
The International Energy Agency counted more than $400 billion of capital expenditure from five large technology companies in 2025, with a further 75% increase expected in 2026. The filings of four of them add up to the same order of magnitude, and most of that money buys servers, land and power for new data centers.
| Company | Period | Cash capex | Prior year | Change |
|---|---|---|---|---|
| Amazon | Calendar 2025 | $131.8B | $83.0B | +59% |
| Microsoft | Fiscal 2026, to 30 June | $115.9B | $64.6B | +79% |
| Alphabet | Calendar 2025 | $91.4B | $52.5B | +74% |
| Meta | Calendar 2025 | $69.7B | $37.3B | +87% |
| Total | Latest fiscal year | $408.8B | $237.4B | +72% |
- The operators, region or spend category to cover
- Regions, years and segments
- Where it runs: blog, white-label, gated or lead magnet
- Whose byline goes on it
- Deadline
- 2,500+ words, human-written
- Every figure linked to its source
- Yours to publish, under your name or none
- Hosting here for +$200, with your sponsored links
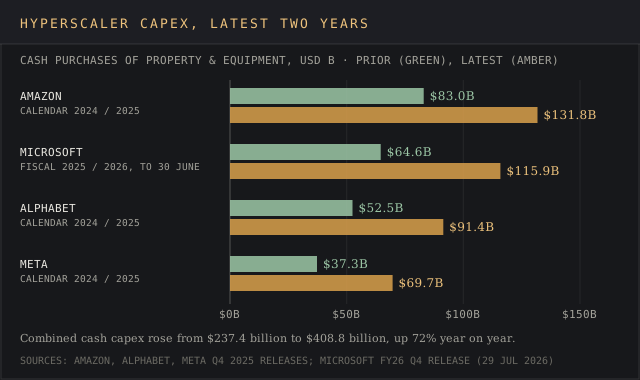
The figures above are purchases of property and equipment from each cash flow statement (our sums and percentages). Meta's own headline number adds finance lease payments and comes to $72.22 billion, and it raised the bar again by guiding 2026 capital expenditures to $115 billion to $135 billion.
Capex also covers offices, warehouses and network gear, and Amazon's figure includes retail logistics. Still, the agency notes that capex at five tech companies now exceeds global investment in oil and gas production. Synergy put hyperscale capex at $142 billion in Q3 2025 alone.
Power usage effectiveness, water and other efficiency metrics
Power usage effectiveness, the standard energy efficiency ratio, divides the total energy consumption of data center facilities by the energy delivered to IT equipment, so 1.0 would mean zero overhead. Uptime Institute's 2026 survey puts the industry average at 1.52, or 1.36 when weighted by capacity, because larger data centers run leaner. New, efficient builds reach 1.3 or lower.
The average has barely moved in years, and the jury's still out on when it will. Uptime's 2025 survey described PUE as showing little change for the sixth consecutive year, and Google's own efficiency page cites that survey's average of 1.54. Google reports a 2025 fleet-wide PUE of 1.09, a gap that shows where efficiency improvements have already been made.
U.S. data centers look better on energy efficiency than the global survey. Berkeley Lab models the U.S. annual average PUE falling from 1.6 in 2014 to 1.4 in 2023, and puts hyperscale and colocation facilities below 1.4. The difference comes down to who answers: Uptime surveys more than 800 operators worldwide, and the lab models the installed U.S. fleet.
Water usage effectiveness measures litres of water per kWh of IT energy. The lab's site WUE stays just over 0.36 L/kWh through 2023 and rises to 0.45 to 0.48 L/kWh after that. Applied to 176 TWh, 0.36 L/kWh is about 63 billion litres, roughly 17 billion gallons of direct water use in 2023 (our calculation).
The same arithmetic on the lab's 2028 range gives about 39 to 74 billion gallons (our calculation). Cooling systems draw that water from local supplies, so the impact lands on local water resources first. Carbon usage effectiveness, the third metric in the family, divides carbon emissions by IT energy.
Rack density, or computing power density, the electrical load in one server rack, is changing fastest and sets how much power and how much electricity a row needs. The agency says artificial intelligence server density rose 11 times between 2020 and 2025 and will rise a further fourfold by 2027, when one rack could draw as much as 65 homes. Uptime's 2025 survey found average densities rising slowly, driven by 10 kW to 30 kW racks, with few facilities above 30 kW.
That spread explains the move to liquid cooling in AI data centers. A single AI rack has to shed heat equal to 30 natural gas boilers, and server load can swing by more than 50% of rated capacity within a second, per the agency. That makes utilization, active capacity divided by total installed capacity, a moving target in data center operations for AI.
Operators are changing power architectures to feed high-density racks. The agency estimates 20 to 25 GW of battery storage could be installed in data centers by 2030, the kind of resilient power systems that used to mean diesel generators and a fuel contract. It also counts 15 to 27 GW of onsite natural gas that may power data centers by 2030, mostly in the U.S.
Electricity demand, grid strain and local communities
The grid is where data center growth meets its limit, and it leaves utilities between a rock and a hard place. In PJM, the largest U.S. grid operator, capacity prices rose from $28.92 per MW-day for 2024/25 to $269.92 for 2025/26 and $329.17 for 2026/27, the cap. PJM's market monitor, Monitoring Analytics, attributed 63% of the 2025/26 increase to data centers, about $9.3 billion in costs.
Regulators are still writing the rules. On 9 October 2026 the Federal Energy Regulatory Commission approved PJM's definition of large loads and a registry of large loads such as new data center projects, and rejected the plan to let large loads connect early if they agreed to be curtailed first, sending PJM back to the drawing board.
Connection delays remain the bottleneck for data center development, and the same lines carry power to hospitals and emergency services.
Ireland shows what happens when data centers consume almost a quarter of a country's electricity. Data centers used 23% of Ireland's metered electricity consumption in 2025, up from 22% in 2024 and 5% in 2015, according to the Central Statistics Office.
Virginia is the U.S. equivalent. The state's Joint Legislative Audit and Review Commission found that Northern Virginia holds 13% of reported data center operational capacity worldwide and 25% of capacity in the Americas. JLARC estimated the data center industry adds $9.1 billion to Virginia's GDP and supports 74,000 jobs a year, and that unconstrained power demand in Virginia would double within 10 years.
Northern Virginia holds 13% of reported data center operational capacity worldwide and 25% in the Americas, according to the Joint Legislative Audit and Review Commission.
Share of world data center operational capacity in Northern Virginia
Source: JLARCe.g. data center capacity in your state
Source: linked, checked, datedThe same audit priced the tax break. Virginia's sales and use tax exemption gave data centers $928 million in tax savings in fiscal 2023. Nationally, Good Jobs First counts at least 36 states offering data center incentives, and only 11 disclose which companies receive them.
Some states have tried to slow data center development. Georgia's legislature passed HB 1192 in 2024, which would have suspended new sales tax exemption certificates for data center projects from July 2024 to June 2026. Governor Brian Kemp vetoed it in May 2024.
Local communities have gone further than their legislatures in limiting data center locations, and rising bills add fuel to the fire. Electric Choice's tracker counted 575 active restrictions on data center development across 46 states as of 15 October 2026, more than 350 of them at city, county or township level. The tracker counts moratoriums, bans, zoning limits and executive orders together and calls its total a floor.
Water is the newest front for data centers. A review hot off the press from the National Conference of State Legislatures, dated 8 October 2026, identified about 100 bills and resolutions in 39 states on data center water use in 2025 and 2026, mostly reporting and disclosure rules. Utah's HB 76, as NCSL describes it, requires annual water use reports from large new data centers, and California's AB 2619 ties water estimates to business licenses.
What the published data center figures leave out
Every series here measures something narrower than its headline. Berkeley Lab's 2030 range spans 322 TWh between its low and high cases, more than the whole U.S. fleet used in 2023.
- Electricity: the agency and Gartner differ by 38 TWh for 2025, and ABI's 2024 base sits 268 TWh above the agency's
- Market size: five houses, $118.9 billion to $505.6 billion, for one calendar year
- Counts: 4,767 listed U.S. sites today against 5,381 quoted for March 2024
Treat any single figure on data centers with care. Buyers of energy market intelligence track these series side by side, and the same discipline applies to capacity and pricing data in real estate statistics.
Delivered for your site and your byline. Hosting here is optional.
Frequently asked questions
How much energy are data centers consuming?
Data centers consume about 485 TWh a year worldwide on the IEA's 2025 figure, up 17%. U.S. data centers used 176 TWh in 2023, 4.4% of national electricity consumption, per Lawrence Berkeley National Laboratory.
What are the big 3 data centers?
The phrase usually means the three largest cloud providers, which run the most hyperscale data centers. In Q2 2026 Amazon held 28% of cloud infrastructure services, Microsoft 20% and Google 15%, per Synergy Research Group.
What are the 10 largest data centers in the world?
Rankings shift with every campus expansion. Switch's Citadel campus near Reno is planned for up to 17.4 million square feet and more than 2 GW.
Does the US have enough electricity for data centers?
Supply is running behind demand in the largest U.S. market. PJM's capacity auctions hit the price cap of $329.17 per MW-day for 2026/27, and FERC is still ruling on how large loads connect. Berkeley Lab projects data centers at 9.5% to 15.3% of U.S. electricity by 2030.
Do data centers pay for the energy they use?
They pay their own bills, but capacity costs are shared. PJM's market monitor attributed $9.3 billion of the 2025/26 capacity cost increase to data centers, spread across every customer in the region.
Why do the USA have so many data centers?
The U.S. is home to the three largest cloud providers, and at least 36 states offer data center tax incentives. It holds 55% of worldwide hyperscale capacity, per Synergy, and Data Center Map lists 4,767 U.S. data centers.
What is the biggest issue with data centers?
Power, and how much electricity new sites can get. Vacancy in North America's primary markets is 1.4%, Northern Virginia's is 0.2%, and new data centers wait on grid connections and turbines. Gas turbine orders rose 70% in 2025, per the IEA.
Why don't we want data centers anymore?
The objections on record are bills, water and tax breaks. Electric Choice counted 575 active local and state restrictions across 46 states in October 2026, from moratoriums to zoning limits.
How far away should you live from a data center?
Setback distances are set in local zoning codes, county by county. JLARC found one-third of Virginia's data centers sit near residential areas.
What will replace data centers in the future?
Bigger and denser data centers, on current forecasts. JLL expects 97 GW of new capacity by 2030, and Synergy expects hyperscale operators to hold 67% of capacity by 2031, up from 48%. JLL expects AI to be half of data center workloads by 2030, so more of that capacity will be AI data centers.
Bottom line
The figures that hold up come from a short list of publishers: the International Energy Agency and Berkeley Lab for electricity, Synergy for hyperscale counts, CBRE and JLL for capacity and vacancy, and company filings for capex. Everything else is a remix of those or a market-sizing model with its own boundary for data center demand.
Every forecaster agrees on the direction. Load grew 17% in 2025, capex grew 72%, vacancy sits at 1.4%, and every forecaster has 2030 energy consumption at double today's or more, near 3% of global electricity on the IEA's central case. The size of the jump is where the houses part ways, and that gap is wide enough to change an investment case.
Quote the publisher, the year and the boundary with every figure. Our AI statistics report tracks the demand side of the same build-out, and the wind energy statistics and solar industry statistics reports cover the renewable supply that data center operators are signing for.
Cooling and power vendors, utilities and real estate funds use reports like this one in investor decks and client briefs.
A report on your topic for a blog page, gated content or a lead magnet.
Written for your client and published under their brand, with my name left off.
Your report on marketintelligencetools.com, with 2 to 3 CTAs carrying your sponsored links.
Default terms: the report is yours to publish, and I keep the right to republish it on this site behind a gate, outside Google's index.
The agencies, labs, brokers and filings behind each data center figure, and what nobody counts
Electricity: iea.org (Energy and AI, 2025; Key Questions on Energy and AI, April 2026; data centre news release), eta-publications.lbl.gov and eta.lbl.gov (Berkeley Lab U.S. Data Center Energy Usage Report, December 2024, and its June 2026 update), gartner.com (10 June 2026), abiresearch.com (March 2025), pewresearch.org (24 October 2025), eia.gov (Annual Energy Outlook 2026), epri.com and cso.ie (data centre metered electricity, 2025).
Market size and counts: gartner.com (IT spending forecast, 22 April 2026), precedenceresearch.com, grandviewresearch.com, fortunebusinessinsights.com, mordorintelligence.com, datacentermap.com, srgresearch.com (Synergy Research Group releases of 2025 and 2026) and datacenterdynamics.com (Uptime analysis, December 2024).
Capacity, construction and capex: cbre.com (North America H1 2026, September 2026), jll.com (2026 global outlook), news.constructconnect.com (September 2026), switch.com, and the Amazon, Microsoft, Alphabet and Meta earnings releases on sec.gov, microsoft.com and q4cdn.com.
Efficiency, grid and policy: intelligence.uptimeinstitute.com (2025 and 2026 surveys), datacenters.google, ieefa.org, utilitydive.com (9 October 2026), jlarc.virginia.gov, goodjobsfirst.org, electricchoice.com (15 October 2026) and ncsl.org (8 October 2026).
Every figure was checked against its source on 17 October 2026. No public body counts data centers worldwide, and the water volumes on this page are our calculations from Berkeley Lab's published water-use rates.