Real estate statistics for 2026 show home prices up 1.6% as mortgage rates hit 7.28%
 By Jan Suski. I go deep on every review, checking every number against its source and digging up details other coverage misses, a habit from six years of SEO and link building for tech companies. Bylines at Surfer, Brand24, and Senuto. How the scoring works.
The numbers US housing and commercial real estate, checked 4 October 2026
Home values rose 1.9% on Case-Shiller in the year to July while consumer prices rose 3.4%, the 14th straight month of real declines.
Supply reached 4.9 months, NAR's highest reading in over ten years, as the 30-year rate climbed 0.94 points in a year.
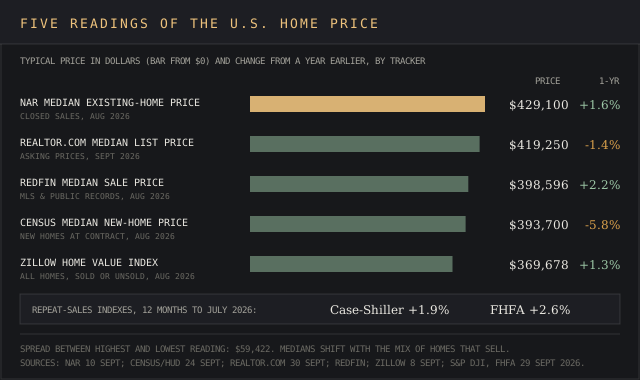
Five trackers put the typical U.S. home price $59,422 apart, from Zillow's $369,678 to NAR's $429,100.
U.S. existing homes sold at a seasonally adjusted annual rate of 3.98 million in August 2026, down 2.0% on July, while the median existing-home price rose 1.6% to $429,100, the National Association of REALTORS® reported on September 10. Three weeks later, Freddie Mac put the 30-year fixed mortgage rate at 7.28%, up from 6.34% a year earlier.
This report collects the latest housing market and commercial real estate data, from sales, prices and mortgage rates to rents, vacancy, data centers and global house prices, with every figure linked to its publisher. It's written for homebuyers, sellers, investors, agents and analysts who need a dated number for the real estate market.
Five U.S. trackers put typical home values between $369,678 and $429,100, and their annual price readings run from -5.8% to +2.6%. The gap matters for any economic or pricing decision, because the tracker picked can move a quoted home price by $59,422.
U.S. housing market in August 2026: 3.98 million sales at a $429,100 median price
Existing-home sales fell 1.2% from last year, and NAR counted 1.62 million homes for sale, up 5.9% and the first reading above 1.6 million since November 2019. NAR builds the series from MLS closings, and existing homes account for more than 90% of total home sales. In 2023, sales of 4.09 million were the lowest annual total since 1995, below every year of the 2007 to 2011 subprime crisis and its aftermath.
"Mortgage rates and home sales move in opposite directions, so it's not surprising to see a mild dip in home buying activity due to high mortgage rates."
Lawrence Yun, chief economist, NAR, Existing-Home Sales report, September 10, 2026
NAR's REALTORS® Confidence Index adds information on the buyer mix:
- Existing homes sold in a median 31 days, unchanged on the year.
- First-time buyers made up 30% of sales, up from 28%.
- Cash deals were 27% of transactions, and purchases by individuals as investors or second-home buyers fell to 15% from 21%.
- Distressed sales, foreclosures and short sales together, held at 2%.
NAR's Pending Home Sales Index rose 0.3% and sat 4.7% below a year earlier, with declines in all four regions, per its September 17 release. Pending sales are a sign of coming closings, since NAR says a contract usually closes within one or two months.
| Region | Sales, annual rate | Median price | Price change, year on year |
|---|---|---|---|
| Northeast | 480,000 | $556,900 | +4.3% |
| Midwest | 940,000 | $340,400 | +3.3% |
| South | 1.84M | $366,500 | +0.7% |
| West | 720,000 | $619,100 | -0.2% |
Source: NAR Existing-Home Sales, released September 10, 2026.
Raw counts of homes sold run lower. Zillow's nowcast put closings at 339,927, down 0.6%, in its market report, and Redfin counted 291,769 homes sold, down 0.45%.
Home prices rose 1.9% to 2.6% on the repeat-sales indexes
The Case-Shiller U.S. index rose 1.9% in the year to July, up from 1.6% in June, S&P Dow Jones Indices said on September 29. The FHFA House Price Index rose 2.6% over the same 12 months, with the Middle Atlantic division up 6.3%.
"While home prices continued to decline in real terms in July 2026, marking the 14th consecutive month of real declines, slightly lower inflation and stronger nominal home price appreciation helped narrow the gap."
Rebecca Kaufman, associate director of commodities, S&P Dow Jones Indices, Case-Shiller release, September 29, 2026
- Chicago led the 20 metros at +6.9%, followed by New York at +5.8% and Cleveland at +4.2%.
- Seattle fell 1.6%, Las Vegas 1.3% and Denver 1.1%, the three largest annual declines.
- The 20-City Composite rose 2.5% and the 10-City Composite 3.4%.
- The U.S. index stood at 337.31 on a January 2000 base of 100, 9.3% above its June 2022 peak.
Chicago has been ahead of the curve for five months running, and S&P calls the East-West split in these regional trends years-long. S&P said recording delays in Wayne County affected the July data, so it provided only a June update for Detroit.
Zillow shows the split in dollars. Its index puts home values in the New York metro area at $739,324, up 5.2%, and home values in the Las Vegas area at $423,354, down 2.8%. Zillow builds the index from the ground up out of property-level Zestimates, updated monthly, and readers can explore county pages such as Allegany County, Maryland, where home values stood at $158,340, up 3.6%, updated on August 31.
Why the published home price figures diverge
Seven trackers published U.S. price readings for July through September 2026, and the devil's in the details. Each one counts different homes at a different stage of the sale. Redfin's national median sale price was $398,596 in August, $30,504 under NAR's median.
| Tracker | What it counts | Latest reading | Change vs a year earlier |
|---|---|---|---|
| NAR median existing-home price | Closed MLS sales of all housing types, August | $429,100 | +1.6% |
| Realtor.com median list price | Asking prices on active listings, September | $419,250 | -1.4% |
| Redfin median sale price | MLS and public-record sales, August | $398,596 | +2.2% |
| Census/HUD median new-home price | New single-family homes sold, at contract, August | $393,700 | -5.8% (±8.2%) |
| Zillow Home Value Index | Typical value of all homes, sold or unsold, August | $369,678 | +1.3% |
| S&P Cotality Case-Shiller U.S. index | Repeat sales of single-family homes, July | Index 337.31 | +1.9% |
| FHFA House Price Index | Repeat sales on Fannie Mae & Freddie Mac purchase loans, July | +0.3% on the month | +2.6% |
- Medians move with the mix of homes that sell, and NAR's release notes give details on how that mix can distort the median.
- Repeat-sales indexes compare the same houses over time, and FHFA counts only purchase loans backed by Fannie Mae or Freddie Mac.
- Census counts new homes at contract and NAR counts existing homes at closing, so the two series can move in opposite directions. New homes sold for $35,400 under the existing-home median.
- Zillow values every home, sold or unsold, so its home values sit below the sales medians, and Realtor.com records asking prices.
Case-Shiller covers 20 metros plus a U.S. composite, and Cotality, which produces the indexes, sells versions for thousands of ZIP codes, counties and state markets, down to neighborhood-level property data.
Homes for sale: 1.16 million to 1.62 million listings and 4.9 months of supply
Every tracker shows more homes for sale than a year ago, and each finds a different inventory count. NAR counted 1.62 million, Redfin 1,534,918 (+2.7%), Zillow 1.41 million (+3%) and Realtor.com 1,161,615 active listings in September (+5.4%).
Realtor.com said active listings sat 9.1% under pre-pandemic levels in September. Its median list price fell 1.4% to $419,250, and the price per square foot fell 1.7%.
About one in five listings experienced a price cut as sellers bit the bullet, by these counts:
- Redfin: 19.5% of homes had a price drop in August, up from 18.0%.
- Realtor.com: 20.8% of listings in September, the highest September share since 2018.
- Zillow: 26.3% of listings, up 0.5 points.
Speed figures are based on different clocks. NAR put median time on market at 31 days, Zillow measured 27 days to pending, Redfin 50 days on market and Realtor.com 61 days.
"September's housing data shows that buyers are gaining leverage, but higher mortgage rates are limiting how much of that opportunity they can use."
Danielle Hale, chief economist, Realtor.com®, September Housing Report, September 30, 2026
At 4.9 months of supply, the ball is in the buyers' court in this market, and Yun said the extra listings give homebuyers "better opportunities to negotiate."
Mortgage rates averaged 7.28% on the 30-year fixed on October 1
Freddie Mac's Primary Mortgage Market Survey put the 30-year fixed at 7.28%, up from 7.03% a week earlier, and the 15-year at 6.60%. It's updated weekly on Thursdays at noon ET from purchase applications lenders submit through Loan Product Advisor, so interest rates on refinances sit outside it.
Its loan selection covers conventional, conforming purchase loans with 20% down. Freddie Mac lists a research contact for questions on interest rates and has provided weekly data since April 1971.
Federal Reserve Governor Michael Barr sized the mortgage lock-in effect in a September 23 speech in Chicago.
"About half of all mortgages still carry rates of 4 percent or lower, and nearly 80 percent have a rate below 6 percent."
Michael S. Barr, governor, Federal Reserve Board, "A Long-Term View on the Costs of Shelter", September 23, 2026
Barr added that in tight markets the lock-in can raise prices, because fewer owners selling cuts supply by more than it cuts demand. Rates that touched 7.28% sit more than three points above the loans held by half of mortgaged owners.
Affordability index at 104.7 and a $1,897 monthly payment
NAR's Housing Affordability Index read 104.7, up from 101.2 a year earlier.
- Zillow puts the payment on a typical U.S. home at $1,897, with 20% down plus property taxes, insurance and maintenance, 2% more than last year. The insurance statistics report covers premium data.
- Barr said about one-half of renters are cost burdened, paying 30% or more of income on rent.
New construction: 1,275,000 starts and 684,000 new-home sales
Builders started homes at a 1,275,000 annual rate in August, the Census Bureau reported on September 17, and sold new homes at a 684,000 rate, per its September 24 release with HUD.
| Measure, August 2026 | Annual rate | vs July 2026 | vs a year earlier |
|---|---|---|---|
| Housing starts | 1,275,000 | -2.6% | -1.2% |
| Building permits | 1,394,000 | -2.7% | +3.5% |
| Completions | 1,128,000 | -11.9% | -27.1% |
| New-home sales | 684,000 | +6.4% | -2.0% |
| New homes for sale (level) | 483,000 | Virtually unchanged | -2.0% |
Sources: Census Bureau New Residential Construction, Sept 17, 2026, and New Residential Sales, Sept 24, 2026.
The 483,000 new homes for sale equal 8.5 months of supply, and the average new home sold for $478,700, down 8.8%. Private residential property construction spending ran at an $882.3 billion annual rate and nonresidential at $773.0 billion, per Census construction spending data.
Barr cited estimates of a U.S. housing shortfall of roughly 2 million to 5.5 million units, 1% to 4% of a stock of about 150 million homes. The construction market report and construction market intelligence guide cover the builders' business.
Real estate in the U.S. economy: $49.8 trillion in owner-occupied homes
Households held $49.8 trillion of owner-occupied real estate in Q2 2026, per the Federal Reserve's Financial Accounts. Real estate values rose $1.1 trillion in the quarter.
The Bureau of Economic Analysis listed real estate and rental and leasing among the top industry contributors to Q2 real GDP growth of 2.2%, the latest economic data. Payrolls in that sector were 2,437,700 in September, down from 2,451,300 a year earlier, per the Bureau of Labor Statistics, and the real estate business alone employed 1,842,000.
Rents and vacancy: 65.0% homeownership and a 7.3% rental vacancy rate
The U.S. ownership rate held at 65.0% in Q2 2026, the same as a year earlier, in the Census series updated July 28. Rental vacancy was 7.3% and homeowner vacancy 1.2% across residential property, both statistically unchanged.
Rent trends split like price trends. Zillow's Observed Rent Index rose 2.5% to $1,948, nearly double the growth in home values, while the Realtor.com rent report put the median asking rent for studios to two-bedrooms in the 50 largest metros at $1,699, down 0.9%.
- Realtor.com's figure fell for the 37th straight month and sits $65, or 3.7%, below its summer 2022 peak.
- Concessions stay under the radar in asking rents, and 39.2% of Zillow rental listings offered one, up 2.5 points.
Population moves feed rental demand. Redfin's search data put Las Vegas first for net inflow at 9,600 in April to June 2026, while Los Angeles and New York led outflows at 28,700 and 27,100, based on about two million Redfin.com users, which helps landlords find where renters are heading.
Commercial real estate vacancy: 20.1% for offices and 6.9% for industrial
Commercial real estate spans office buildings, retail space and industrial and logistics facilities, and Cushman & Wakefield tracks each. U.S. office vacancy fell 10 basis points on the year to 20.1% in Q2 2026, Cushman & Wakefield said on July 9, and four-quarter net absorption reached 14.3 million square feet, the strongest since 2020.
Office stock is shrinking as owners convert or reposition obsolete buildings, down 33 million square feet, or 0.6%, over five quarters. The construction pipeline holds 19.7 million square feet, about 0.4% of the total.
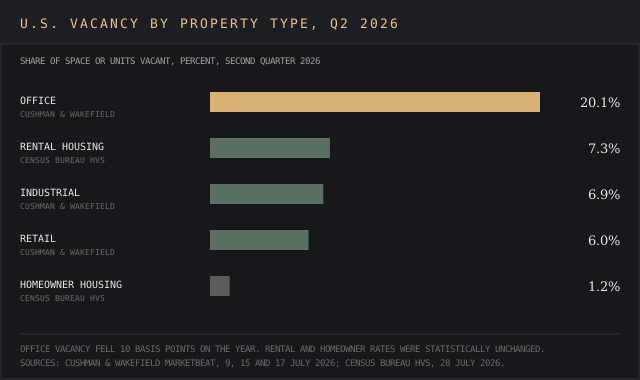
- Industrial: 6.9% vacancy, with 62.1 million square feet absorbed in Q2 and about 305 million under construction, per Cushman & Wakefield.
- Retail: 6.0% vacancy, with asking rents up 2.2% to $25.65 per square foot, per its retail marketbeat. The retail real estate market report breaks that down by metro.
- Asia Pacific: US$43.5 billion of commercial property investment in Q2 2026, down 9% on the quarter and up 32% on the year, CBRE said.
Commercial property listing data is contested too, and the CoStar lawsuit report tracks CoStar's cases against Zillow and CREXi.
Data centers and home values: $431,750 medians in the densest counties
Data centers sit in a small number of places. NAR's 2026 Data Center Impact Report, released September 8, found 92% of U.S. counties have no mapped facility, and Loudoun County, Virginia, alone holds 14%. Its county tables let readers find local impacts.
- Median home value: $431,750 for homes in counties with 10 or more data centers and $174,500 in counties with none.
- Growth: 95% for home values in those counties over the past decade, against 64% in counties without data centers.
NAR says those counties were already high-income, highly educated technology hubs before the recent surge in new facilities. In its REALTOR® survey, 25% saw a positive effect on nearby home values and 22% a negative one, and 50% reported higher commercial property values.
Energy costs (61%) and water use (56%) top client worries about local impacts. BEA said nonresidential structures, led by commercial and health care and mainly data centers, drove its upward revision to private fixed investment, and the AI environmental impact statistics cover the power and water impacts.
Global real house prices sit 20% above their post-crisis level
Real global house prices fell 1.2% year on year in Q1 2026, the Bank for International Settlements reported in August. Advanced economies slipped 0.2%, their first decline since Q3 2024, and emerging markets fell 2.0%, led by Asia at -4.3%.
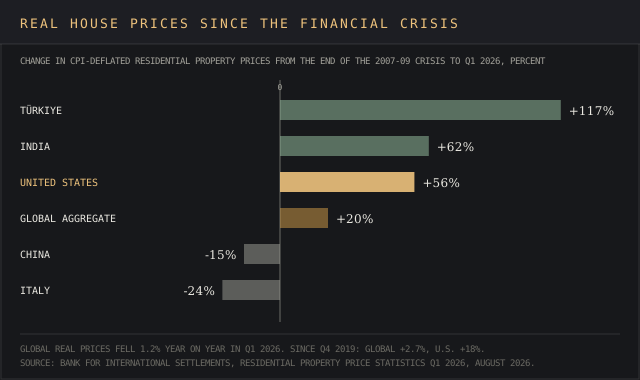
Since Q4 2019, real prices rose 2.7% globally and 18% in the United States, while China lost ground at -22%. Portugal posted the largest real gains in Q1 2026 at 15%, and Eurostat's country data puts it near the top again in Q2.
Prices in Europe kept climbing. Eurostat said on October 1 that EU house prices rose 4.7% on the year in Q2 2026 and rents 3.0%. Against the 2025 average, Bulgaria led at +14.3% and Portugal at +14.2%, and house prices outpaced rents in all 18 EU countries with data.
Hong Kong is the least affordable city in the 2026 Demographia International Housing Affordability report, with a median multiple of 14.1, ahead of Sydney at 14.0 and San Jose at 11.3. Cleveland ranks most affordable of 96 markets at 3.1, and the country-level U.S. median multiple was 4.5 in 2024. Comparing median household income with housing costs this way shows how far prices have run ahead of pay.
How real estate metrics are calculated
Investors compare property deals with a handful of ratios, calculated as follows, with examples from this report where the data allows.
| Metric | How it's calculated |
|---|---|
| Net operating income (NOI) | Property revenue minus operating expenses, before mortgage payments |
| Cap rate | NOI divided by property value |
| Cash-on-cash return | Annual pre-tax cash flow divided by total cash invested |
| Debt service coverage ratio (DSCR) | NOI divided by annual debt payments |
| Absorption rate | Units sold or leased in a period divided by units available |
| Months' supply | Homes for sale divided by the monthly sales pace (4.9 for NAR in August) |
| Price-to-rent ratio | Median home price divided by annual median rent (15.8 on Zillow's August figures) |
| Median multiple | Median house price divided by median household income (Demographia) |
Cap rate divides NOI by property value, which makes it the unleveraged yield on a deal. The absorption rate shows how quickly available properties are sold or leased in a market, and the price-to-rent ratio compares the median home price with annual median rent.
A building's vacancy rate reads best against its market's average, 20.1% for U.S. offices and 7.3% for rental housing, and a gap well above that is a red flag for demand. Fees for a professionally managed property count as operating expenses in NOI.
How to track housing market data and release dates
Revisions are par for the course. Case-Shiller can revise the prior 24 months, and NAR's notes say year-ago medians are sometimes revised, so any chart built from one vintage goes stale.
- Every Thursday at noon ET: Freddie Mac PMMS.
- Oct 13, 2026: NAR existing-home sales for September.
- Oct 20, 2026: NAR pending home sales and Census housing starts.
- Oct 27, 2026: Census new-home sales and Case-Shiller, updated each last Tuesday.
Freddie Mac, Zillow and Eurostat give free access to explore and download their series, updated on each release, and each publisher keeps the rights to its data. Property-level records and transaction details come from vendors in the real estate data providers ranking, such as Cherre, or source foot traffic from alternative data providers.
Each release above comes straight from the horse's mouth, so keep an eye on the dates. The real estate market intelligence and property market intelligence guides show how agents and investors explore this information.
Where each housing figure was read, and the September numbers due next
Sales, prices and rates: nar.realtor (Existing-Home Sales, 10 September 2026; Pending Home Sales, 17 September 2026; Data Center Impact Report, 8 September 2026), freddiemac.com (Primary Mortgage Market Survey, 1 October 2026), press.spglobal.com (S&P Cotality Case-Shiller release, 29 September 2026) and fhfa.gov (House Price Index for July 2026).
Construction, ownership and the economy: census.gov (New Residential Construction, 17 September 2026; New Residential Sales, 24 September 2026; construction spending; Housing Vacancies and Homeownership, 28 July 2026), federalreserve.gov (Financial Accounts, 11 September 2026; Governor Barr's speech of 23 September 2026), bea.gov and bls.gov.
Trackers and commercial property: zillow.com, redfin.com, prnewswire.com (Realtor.com housing and rent reports, September 2026), cushmanwakefield.com (Q2 2026 marketbeats, July 2026) and cbre.com. Global: bis.org (August 2026), ec.europa.eu (Eurostat, 1 October 2026) and the 2026 Demographia International Housing Affordability report via chapman.edu. Rules of thumb: hellodata.ai and krislindahl.com.
Every figure was checked against its source on 4 October 2026. September sales and prices land from 13 October 2026, when NAR publishes existing-home sales, followed by Census starts on 20 October and Case-Shiller on 27 October.
Frequently asked questions
Is the housing market going up or down?
NAR's median existing-home price rose 1.6% to $429,100 in August 2026, while sales fell 1.2% on the year and pending sales 4.7%.
Is real estate growing or declining?
Household real estate values grew $1.1 trillion to $49.8 trillion in Q2 2026, per the Federal Reserve, while real estate payrolls lost ground, slipping about 0.6% in a year.
Will the housing market crash in 2026?
Zillow's August forecast expected typical home values to rise 0.3% in 2026 and NAR-basis existing-home sales to reach 4.1 million, up 1.5%. Distressed sales were 2% of August transactions, per NAR.
Are home prices dropping in Las Vegas?
Prices there are slipping. The Las Vegas Case-Shiller index fell 1.3% in the year to July, and Zillow's home values for the metro fell 2.8% to $423,354.
What is the 7% rule in real estate?
Annual gross rent should be at least 7% of a property's purchase price, per HelloData. A $300,000 rental property would need $21,000 a year, or $1,750 a month, before taxes, insurance, repairs and vacancy.
What is the 3-3-3 rule in real estate?
Kris Lindahl Real Estate defines it as three months of living expenses saved, three months of housing costs held in reserve, and at least three similar homes compared before an offer.
Which city is the most unaffordable in the world?
Hong Kong, where the median house price is 14.1 times median household income, per Demographia.
Is right now the worst time to buy a house?
For buyers on the fence, rates are at 7.28%, up from 6.34% a year earlier. Buyers also have more homes and options, with the most supply in over ten years and 20.8% of listings carrying a price cut.
Bottom line
Prices in the U.S. housing market kept rising in 2026, by 1.6% on NAR's median and 1.9% on Case-Shiller, while sales slipped and mortgage rates climbed to 7.28%. After inflation, home values fell for 14 months running.
Each tracker answers a different question. Use medians for what sold, repeat-sales indexes for what a home is worth, and list prices for what sellers ask. Until rates move off 7%, the jury's still out on the fall, and NAR's October 13 release is the next hard reading.