Solar industry statistics for 2026, and where the sources disagree
 By Jan Suski. I go deep on every review, checking every number against its source and digging up details other coverage misses, a habit from six years of SEO and link building for tech companies. Bylines at Surfer, Brand24, and Senuto. How the scoring works.
Solar power added 636 TWh of electricity worldwide in 2025, a 30% rise that made it the fastest growing electricity source of the year by volume in Ember's Global Electricity Review 2026. The International Energy Agency puts the same increase at 600 TWh and calls it the largest one-year rise by any source outside a post-crisis rebound.
The solar industry's capacity counts disagree by far more. Four publishers put 2025 solar additions anywhere from 511 GW to about 690 GW. Every figure on this page links to the body that published it, with the report title and release date, so all data points can be checked against their own source.
This page is written for analysts, investors and procurement teams who quote solar energy numbers in reports and models. It covers 2025 additions, US segments, costs, jobs, grid limits and the 2026-2030 forecasts, and it names the data source behind each figure, since a 179 GW spread between publishers moves any market model built on it.
The numbers Global and US solar, checked 4 October 2026
The 179 GW gap between IRENA's and IEA PVPS's 2025 totals is bigger than every country's market except China's.
China added between 315.1 GW and 415 GW in 2025, about 60% of global installations by IEA PVPS's count and 57% by SolarPower Europe's, the lion's share under every publisher's method.
Lazard's cost range for large US solar projects moved up, from $38-$78/MWh in its June 2025 edition to $40-$98/MWh in 2026.
Installed solar capacity worldwide in 2025
IRENA's Renewable Capacity Highlights 2026 (release date 31 March 2026) counts 511 GW of new solar energy capacity in 2025, a 27.2% jump that took the global solar energy fleet to 2,392 GW. IRENA's renewables total reached 5,149 GW. Solar PV accounted for 510.3 GW of the additions. Concentrated solar power supplied the remaining sliver.
Solar energy took about three-quarters of the 692 GW of renewable energy capacity added worldwide. Solar & wind together took 96.8%. Everything else, from hydropower to biomass and geothermal, shared the remaining 3.2%.
The IEA's Global Energy Review 2026 (April 2026) counts more: additions "surpassing 600 GW for the first time" and a cumulative fleet of around 2,800 GW, the largest installed capacity of any power technology. IEA PVPS, the IEA's Photovoltaic Power Systems Programme, goes higher again, with around 690 GW added in 2025, 2.96 TW in operation and about 36 countries adding more than 1 GW each.
SolarPower Europe's Global Market Outlook 2026-2030 (release date 22 June 2026) lands between them at 664 GW, up 12%, and says the world's solar fleet passed 3 TW in early 2026.
Global Energy Monitor counts solar energy plants one by one. Its Global Solar Power Tracker (February 2026) logs 2,093 GWac of operating solar, with full data for projects greater than or equal to 20 megawatts. It puts China above 1,000 GWac, five times the next country, the US. The tracker's pipeline of prospective large solar farms grew 17% in 2025 to more than 2.2 TW.
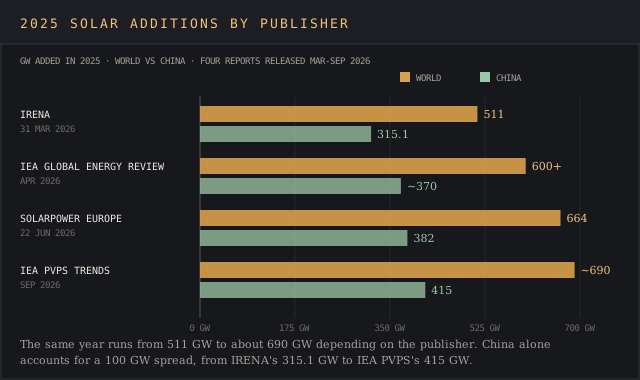
Where the solar energy data sources disagree
Getting the four publishers on the same page for 2025 takes a unit conversion and a country breakdown. Here's how each one splits the same year by country, with the release date of each report:
| Publisher and report | Release date | World 2025 | China | India | EU | Fleet at end-2025 |
|---|---|---|---|---|---|---|
| IRENA, Renewable Capacity Highlights 2026 | 31 Mar 2026 | 511 GW | 315.1 GW | 37.0 GW | n/a | 2,392 GW |
| IEA, Global Energy Review 2026 | Apr 2026 | 600+ GW | ~370 GW | ~50 GW | ~70 GW | ~2,800 GW |
| SolarPower Europe, Global Market Outlook 2026-2030 | 22 Jun 2026 | 664 GW | 382 GW | 45.7 GW | 67.2 GW | 3 TW passed in early 2026 |
| IEA PVPS, Trends in Photovoltaic Applications 2026 | Sep 2026 | ~690 GW | 415 GW | 54 GW | 68 GW | 2.96 TW |
The International Energy Agency's figures typically sit between IRENA's and IEA PVPS's. Units explain part of the spread. The same technology gets two ratings. SEIA reports US additions in GWdc, the rating of the solar panels. The US Energy Information Administration and Global Energy Monitor report AC output at the inverter.
Lawrence Berkeley National Laboratory's 2024 data shows the size of that gap on the same plants: 30 GWac equals 35 GWdc, a 17% difference. IRENA's 511 GW scaled by that ratio comes to 598 GW, within reach of the IEA's 600 GW.
China carries most of what's left. The four counts put it between 315.1 GW and 415 GW, a 100 GW range for one country that's larger than India's entire 2025 market under any method. India, the second-largest country market by IEA PVPS's count, moves from IRENA's 37.0 GW to IEA PVPS's 54 GW. SolarPower Europe and Ember agree on one ranking: India installed more new solar than the US for the first time.
Solar energy's share of electricity splits the same way. Ember measures solar at 8.7% of global generation in 2025, just under nuclear's 8.9%. IEA PVPS reports a "theoretical global penetration" of around 12%, an estimate of what the solar panels in place by year-end could produce over a full year. Ember's figure is metered generation across 2025.
Growth shares use different denominators too. The IEA says solar met around 70% of electricity generation growth in 2025. Ember says it met 75% of the net increase in demand. Jobs follow the pattern: IRENA and the ILO count 7.2 million solar PV jobs among 16.6 million renewable energy jobs in 2024 in Renewable energy and jobs: Annual review 2025 (January 2026), while IEA PVPS counts about 8.2 million for 2025.
Tracing each number back to its publisher is the core of data source attribution for energy data. A list of data points that quotes "global installs" without naming IRENA or IEA PVPS can be off by 179 GW and still cite a real report.
Market size: dollars, terawatts and investment
Market research houses size "the solar energy market" in units that don't reconcile. Precedence Research values it at USD 137.02 billion in 2025 (page updated 23 September 2026). Custom Market Insights puts it at USD 130.37 billion. The IEA's World Energy Investment 2026 counts USD 365 billion going to solar projects in 2026 alone, about USD 1 billion a day.
Mordor Intelligence measures the market in capacity: 2.92 TW in 2026, growing to 7.25 TW by 2031 at a 19.91% CAGR. Fortune Business Insights values concentrated solar power alone at USD 79.59 billion in 2025, equal to 58% of Precedence's whole-market figure, for a technology with 6.4 GW installed.
Read between the lines before a revenue estimate goes into a market sizing model. Those USD data points come from vendors that sell the full report, so it pays to check what market research costs before buying one to settle a number.
Solar forecasts for 2026 and 2030
Both houses that published a 2026 solar energy forecast call for a decline. SolarPower Europe's medium scenario has the global market falling 8% to 612 GW. BloombergNEF titled its 4Q 2025 Global PV Market Outlook "First Ever Dip" (16 December 2025) and puts 2026 additions below 2025's.
The 2030 numbers are a moving target. SolarPower Europe forecasts 864 GW a year by 2030 and 6.6 TW in operation, or 7.6 TW in its high scenario. Goldman Sachs Research put 2030 additions at 914 GW in August 2025. The IEA's Renewables 2025 (October 2025) forecasts 4,600 GW of renewable energy capacity over 2025-2030, with solar PV supplying almost 80% of the increase.
Solar power's share of electricity generation
Solar energy generated 2,778 TWh in 2025, by Ember's count. It overtook wind globally for the first time, and renewables as a group achieved 33.8% of the world's power (10,730 TWh), passing coal's 33.0% (10,476 TWh). In the European Union, the IEA says solar & wind reached 30% of generation, above fossil fuels for the first time.
Energy demand is moving too. The IEA's Energy and AI report (April 2025) puts data centres at 415 TWh in 2024, about 1.5% of world electricity use, and projects around 945 TWh by 2030, with renewables meeting half of that growth. The AI environmental impact statistics page tracks the same load from the consumption side.
In the US, the Energy Information Administration's article "Wind and solar generated a record 17% of U.S. electricity in 2025" (20 March 2026) counts 296,000 GWh from utility-scale solar, up 34%, and 93,000 GWh from small-scale systems, up 11%. Together that's 389,000 GWh, or 389 billion kWh. Against EIA's 19% wind-and-solar total, it works out to about 8.7% of US net electricity generation.
US solar deployment: SEIA, Wood Mackenzie and the Energy Information Administration
The US added 43 GW of solar energy capacity in 2025, the fifth straight year solar was the largest source of new US power capacity among all energy sources, per SEIA and Wood Mackenzie's 2025 Year in Review. Solar and batteries made up 79% of all new capacity. Texas added 11 GW, Indiana nearly 3 GW, and 12 states passed 1 GW each.
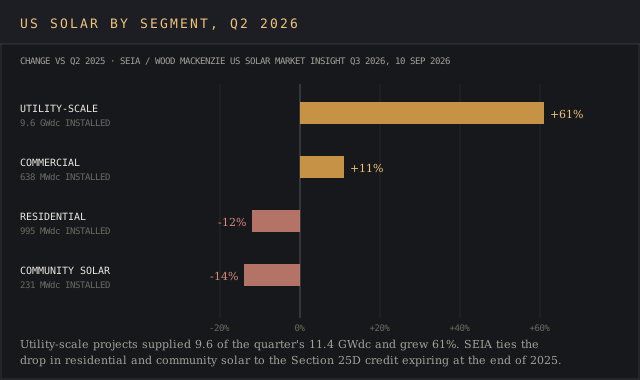
Quarterly data for 2026 show where the growth sits. Wood Mackenzie's Q2 2026 report (10 June 2026) counted 7.8 GW in Q1, with solar plus storage taking 91% of new capacity. The third quarter edition of US Solar Market Insight (release date 10 September 2026) counts 11.4 GWdc of installations in Q2 2026, up 45% on Q2 2025, and a cumulative fleet of 299.4 GW. Solar & storage supplied 70% of new generating capacity in the first half, with solar alone at 45%.
| Segment | Added in Q2 2026 | Change vs Q2 2025 |
|---|---|---|
| Utility-scale | 9.6 GWdc | +61% |
| Residential | 995 MWdc | -12% |
| Commercial | 638 MWdc | +11% |
| Community solar | 231 MWdc | -14% |
The EIA counts differently. Its February 2026 outlook (20 February 2026) recorded 27.2 GW of utility-scale solar in 2025, below the 30.8 GW record of 2024, and lists 86 GW of planned utility-scale additions for 2026. Solar makes up 43.4 GW of that (51%), ahead of 24 GW of batteries and 6.3 GW of gas. Sun Belt states lead: Texas holds 40% of the planned solar, Arizona & California hold 6% each, and Michigan 5%.
Both the 27.2 GW and 43 GW figures describe the same year. EIA counts AC capacity at utility-scale plants. SEIA counts DC capacity and adds rooftop, commercial & community systems.
SEIA and Wood Mackenzie forecast a flat five-year outlook, with annual additions holding steady while the fleet roughly doubles, and project 490 GW of additions over ten years, taking the US to about 770 GW by 2036. Wood Mackenzie counts 457 solar & storage projects whose construction is exposed to federal permitting delays. Public support holds up: Pew Research Center found 77% of Americans favor expanding solar, against 59% for nuclear (April-May 2025 survey).
Utility-scale solar capacity and distributed solar
Lawrence Berkeley National Laboratory's Utility-Scale Solar 2025 Data Update (October 2025) counts 30 GWac of new plants in 2024 and 111 GWac operating across 1,759 projects. Installed cost rose from $1.59/Wac in 2023 to $1.61/Wac. Capacity factors run from 17% in the regions with the least sunlight to 31% in those with the most sun, and power purchase agreements for 2024 projects averaged $29/MWh.
Batteries ride along with a share of utility-scale solar farms. Hybrid projects added 7.4 GWac of PV in 2024, about a quarter of the year's 30 GWac, along with 4.3 GW of storage, roughly 58 MW of batteries per 100 MW of solar. The queue is bigger: 956 GW of solar waited for grid interconnection at the end of 2024, down 12%, and 47% of it was paired with storage. Paid platforms such as Enverus sell that queue data project by project.
Distributed solar is a different market. LBNL's Distributed Solar & Storage 2025 Data Update covers 4.9 million US systems, 515,000 of them installed in 2024, with a median home system of 7.2 kW. Battery attachment for residential installations in California rose from 14% in 2023 to 57% in 2024. Across all other states it went from 5% to 8%.
Payback for installing solar panels on a home depends on local electricity rates and net metering policies, the rules that set what exported power earns. SEIA ties the softer distributed segments to the Section 25D residential credit expiring at the end of 2025, and US residential volume is expected to fall 21% in 2026, per Wood Mackenzie, even as 45% of Q1 residential systems shipped with a battery.
Globally the split runs the other way. IEA PVPS counts 282 GW of distributed solar added in 2025, up from 228 GW in 2024, and the IEA puts distributed systems at 42% of PV growth through 2030.
Solar energy costs: electricity, panels and batteries
IRENA's Renewable Power Generation Costs in 2024 (July 2025) puts the global weighted average cost of new utility-scale PV plants at USD 0.043/kWh, down 90% from USD 0.417/kWh in 2010. That's 41% cheaper than the least-cost fossil fuel alternative. Average installed cost of PV systems was USD 691/kW.
US costs went the other way in 2026. Lazard's LCOE+ 2026 puts unsubsidized power from utility-scale PV at $40-$98/MWh, up from $38-$78/MWh a year earlier.
Lazard says renewables "remain the most cost-competitive form of new-build generation on an unsubsidized basis" and cites "rising and inflationary cost pressures across all generation technologies." Gas combined cycle runs $51-$129/MWh and gas peaking $144-$276/MWh, numbers that matter to anyone tracking oil and gas market intelligence alongside solar.
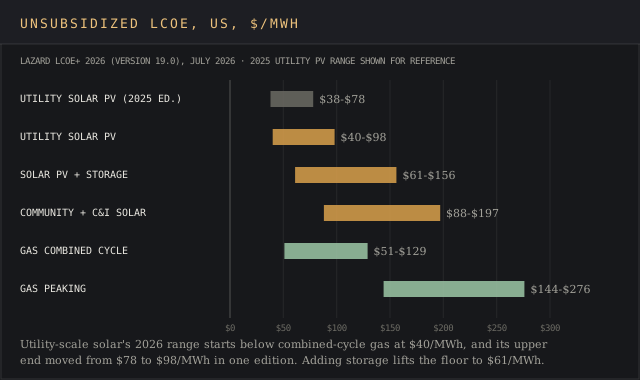
By technology, solar plus storage costs $61-$156/MWh in Lazard's 2026 edition, and community and commercial-and-industrial solar costs $88-$197/MWh. LBNL's own estimate for US plants completed in 2024 is $60/MWh before tax credits and $41/MWh after.
Battery technology prices fell too. IRENA puts the fall in battery storage project costs at 93% between 2010 and 2024, from USD 2,571/kWh to USD 192/kWh. Ember reports a further 45% drop in 2025. The IEA says the capital needed to add 1 GW of solar PV has fallen 80% in a decade.
Concentrated solar power and solar thermal energy
Two solar energy technologies use the sun. In the EIA's words, solar cells "convert sunlight directly into electricity," the photovoltaic effect at work in all solar panels. Solar thermal systems use sunlight to generate heat for water, air, or the fluid in a solar thermal power plant, which uses that heat to generate electricity through a turbine.
Concentrated solar power stays a niche technology. IRENA's CSP report (January 2025) counts 6.4 GW installed and models its reference plant with ten hours of thermal storage, enough to keep running after the sun goes down. Its cost fell 77% between 2010 & 2024, to USD 0.092/kWh, more than twice the PV average.
Solar thermal water and space heating flies under the radar. The IEA Solar Heating and Cooling Programme's Solar Heat Worldwide 2025 counts 544 GWth of solar thermal collectors in operation at the end of 2024, covering 777 million square metres. They delivered 443 TWh of heat, saving 153.5 million tonnes of CO2. Company-level emissions data of that kind is what ESG data providers compile. New solar thermal additions fell 14% to 17.8 GWth in 2024, with China down 17%.
Solar manufacturing, jobs and the supply chain
China calls the shots in solar energy manufacturing. The IEA's Solar PV Global Supply Chains report (2022) found China's share of every manufacturing stage, from polysilicon & wafers to solar cells and modules, above 80%.
US capacity to make solar panels reached about 66 GWdc of modules in Q2 2026 after only 1 GWdc came online that quarter, per SEIA data, and the August Section 232 action on polysilicon and the FCC's inverter action now shape what a domestic supply chain costs. Both feed supply chain intelligence on solar hardware.
US solar energy employment held level at 280,119 in 2024, against 279,447 in 2023, in IREC's census. The breakdown:
- Installation and project development: 178,713
- Wholesale trade and distribution: 34,625
- Manufacturing: 32,491
- Operations and maintenance: 21,833
- All other: 12,457
Installation is mostly construction work, which ties these numbers to the construction market report.
The Bureau of Labor Statistics counts 31,100 solar photovoltaic installers in 2025, with median pay of $53,140 in May 2025 and projected growth of 37% from 2025 to 2035, "much faster than the average for all occupations." Its fastest-growing occupations list ranks the job second for 2025-35, behind nurse practitioners at 41%. Anyone doing labor market intelligence on the trade should keep an eye on both series.
Grid limits, curtailment and battery storage
Grid integration and storage are where solar expansion now meets its limits, and the curtailment numbers show it. California's power grid operator CAISO curtailed 3.4 million MWh of renewable energy output in 2024, up 29% on 2023's roughly 2.6 million MWh, and solar accounted for 93% of it, according to an EIA analysis (28 May 2025).
Measured as a rate, LBNL puts 2024 solar curtailment at 3.7% in CAISO and 7.1% in ERCOT, where most of it hits West Texas transmission limits on the grid.
The IEA reports curtailment rising country by country, in China, Germany, Brazil, Chile, the UK & Ireland. Storage shifts midday solar energy into the evening, after the sun sets. The US added 57.6 GWh of energy storage in 2025, up 30%, per SEIA's US Energy Storage Market Outlook Q1 2026 (23 February 2026). Standalone projects made up nearly 30 GWh and storage systems paired with solar 20 GWh. SEIA forecasts more than 600 GWh in place by 2030.
Europe and the US together added 79 GWh of battery systems in 2025, up from 2.9 GWh in 2020, per IEA PVPS data. Ember estimates global battery deployment grew 46% to 250 GWh. For a wider view of how analysts track these energy sources and their energy data, see energy market intelligence.
Which publisher released each solar figure, and which totals stay paywalled
Capacity and generation: irena.org (Renewable Capacity Highlights 2026, 31 March 2026), iea.org (Global Energy Review 2026, April 2026), iea-pvps.org (Trends in Photovoltaic Applications 2026, September 2026), ember-energy.org (Global Electricity Review 2026, 21 April 2026), solarpowereurope.org (Global Market Outlook 2026-2030, 22 June 2026, and EU Solar Market Outlook 2025-2030, 11 December 2025) and globalenergymonitor.org (Global Solar Power Tracker, February 2026).
Forecasts, investment and market size: iea.blob.core.windows.net (World Energy Investment 2026, 28 May 2026, and Renewables 2025, October 2025), bnef.com (4Q 2025 Global PV Market Outlook, 16 December 2025), goldmansachs.com (August 2025), precedenceresearch.com (updated 23 September 2026), custommarketinsights.com, mordorintelligence.com and fortunebusinessinsights.com.
US deployment: seia.org and woodmac.com (2025 Year in Review, 10 March 2026, Q2 2026 report, 10 June 2026, Q3 2026 US Solar Market Insight, 10 September 2026, and US Energy Storage Market Outlook Q1 2026, 23 February 2026), eia.gov (28 May 2025, 20 February 2026 and 20 March 2026), emp.lbl.gov (utility-scale and distributed solar data updates, October 2025) and pewresearch.org (16 October 2025).
Costs, heat and jobs: lazard.com (LCOE+ 2026, July 2026, and the June 2025 edition), irena.org (generation costs, July 2025, CSP report, January 2025, and jobs review, January 2026), iea-shc.org (Solar Heat Worldwide 2025), iea.org (Energy and AI, April 2025, and Solar PV Global Supply Chains, 2022), irecusa.org (National Solar Jobs Census 2024, November 2025), bls.gov (Occupational Outlook Handbook) and docs.nlr.gov (NREL degradation review, June 2012).
Every figure was checked against its source on 4 October 2026. BloombergNEF keeps its GW figures behind a paid subscription, so this page quotes only the title and direction of its 2026 outlook. The market research houses sell their full reports and publish only headline values. Full-year 2026 counts are still to come from every capacity publisher here, so every 2026 number on the page is a forecast, a quarterly figure or an investment estimate.
Frequently asked questions
What is the largest producer of solar energy?
China, by every publisher's count. The country added between 315.1 GW (IRENA) and 415 GW (IEA PVPS) in 2025, and Global Energy Monitor counts more than 1,000 GWac operating there, five times the US. Ember says China recorded more than half of the global increase in both solar capacity and solar generation in 2025.
What happens after 25 years of solar?
Solar panels keep working at reduced output, though years of sun and heat take a slow toll. The solar cells inside lose output gradually: an NREL review of nearly 2,000 photovoltaic degradation measurements (June 2012) found a median loss of 0.5% a year and a mean of 0.8%. At the median rate, a panel still produces about 88% of its original output after 25 years.
Can solar energy work on cloudy days?
Yes, solar panels still generate electricity under cloud, at lower output. They convert sunlight directly into electricity, so less sunlight means less power. The EIA notes that clouds, dust, volcanic ash and pollution reduce the sunlight reaching the surface. The effect shows up in LBNL's US data: plants in the least sunny regions average a 17% capacity factor, against 31% in the sunniest, where the sun is out more hours of the year.
Is the solar industry currently struggling?
Parts of it are. US home solar volume fell 12% and community solar 14% in Q2 2026, the EU added 65.1 GW in 2025, down from 65.6 GW in 2024, its first decline since 2016 per SolarPower Europe's EU Solar Market Outlook 2025-2030 (11 December 2025), though it achieved its 400 GW target for 2025. Both SolarPower Europe and BloombergNEF forecast a dip in global installations in 2026. US utility-scale installations grew 61% in Q2 2026.
Is solar the fastest growing source of electricity?
By generation added, yes. Ember counts a 636 TWh increase in 2025, and the International Energy Agency calls its own 600 TWh estimate the largest one-year rise by any source outside a post-crisis rebound. Solar alone met 75% of the net rise in global electricity demand, per Ember's data.
Bottom line
The solar industry added somewhere between 511 GW and 690 GW in 2025, and the right number depends on whose method you use: IRENA's, the IEA's, SolarPower Europe's or IEA PVPS's.
Solar now supplies about three-quarters of new renewables capacity by IRENA's count. Pick one data source per comparison and keep its release date attached to its data points. In a nutshell, solar energy generation data agree better than the capacity data: Ember & the IEA put solar's 2025 growth at 636 TWh and 600 TWh.
Solar power's cost & growth now point in different directions in the US. Lazard's utility-scale range rose to $40-$98/MWh while utility-scale volume grew 61% in Q2 2026. Forecasters see the first global dip in 2026, then 864 GW to 914 GW a year by 2030. A trend tracker with one row of data points per publisher is the simplest way to follow those numbers as each report updates.