Manufacturing industry statistics 2026: $3.17 trillion of output, 12.68 million jobs
 By Jan Suski. I go deep on every review, checking every number against its source and digging up details other coverage misses, a habit from six years of SEO and link building for tech companies. Bylines at Brand24 and Senuto. How the scoring works.
The numbers US and global manufacturing, checked 20 November 2026
Factory employment of 12.681 million sits above the 2017 to 2019 average of 12.613 million, so the jobs count has recovered its pre-pandemic level.
Capacity utilization at 75.9% runs 2.3 points under its long-run average while the PMI shows expansion, so demand is growing into spare capacity.
China's $4.65 trillion of manufacturing value added is about 1.6 times the US figure, so the US remains the second-largest manufacturing nation.
Industrial suppliers, automation vendors and economic development teams quote factory numbers in every pitch. Send the subsector, the state or the country and I'll source a version you own.
U.S. manufacturing produced $3.168 trillion of value added at a seasonally adjusted annual rate in the second quarter of 2026, 9.7% of the nation's value-added output, on Bureau of Economic Analysis data compiled by the National Association of Manufacturers. The manufacturing sector employed 12.681 million people in October 2026 on preliminary BLS data, up 19,000 on the month.
Both numbers sit near records, but read between the lines and they hide a long decline in share. Manufacturing employed about 25% of the US workforce in 1976 and roughly 10% in 2025, per the Federal Reserve Bank of Cleveland. This page covers value added, employment, pay, job openings, exports, establishments and the global picture, with each figure tied to the agency or trade body that published it and the data series behind it.
It's written for analysts, suppliers and investors who need current numbers on the manufacturing sector, and for anyone checking a quoted figure against its source data series. The figures matter because a $770 billion gap separates published readings of the same sector, enough to swing a market sizing or a reshoring business case.
What counts as manufacturing
The Census Bureau's NAICS sectors 31 to 33 define manufacturing as establishments engaged in the mechanical, physical, or chemical transformation of materials, substances or components into new products. That covers food processing, printing, chemicals, primary metals, machinery, motor vehicles and other transportation equipment, plus anything assembled from component parts. Blending bulk chemicals counts. Repairing machinery is a service and sits in another sector.
Every federal data series in the manufacturing sector uses that boundary, for example the BLS employment count and the BEA value added figure, so figures from BEA, BLS and Census line up. Trade bodies and private trackers sometimes add logistics services, business services or software, which is one reason quoted manufacturing statistics differ across countries and publishers.
U.S. manufacturing output and value added
Value added is the measure that matters: gross output minus the materials, components and services bought in. NAM's summary of the BEA data shows:
- $3.168 trillion in Q2 2026, up from $3.004 trillion in Q1
- $1.695 trillion from durable goods and $1.473 trillion from nondurable goods
- Real value added expanded to $2.471 trillion, chained 2017 dollars
- 9.7% of total US value-added output
Each dollar spent in manufacturing has a total impact of $2.69 on the wider economy, and each manufacturing job supports five jobs economy-wide, on NAM's own calculations from 2024 IMPLAN data. Those multipliers come from a trade body blowing its own horn, so read them as its estimate.
Why U.S. manufacturing value added figures disagree
Quoted figures for U.S. manufacturing value added run from $2.4 trillion to $3.2 trillion, and every one traces to official national accounts. The gap comes from price basis and period:
| Figure | Basis | Period | Source |
|---|---|---|---|
| $2.4 trillion | Real, chained 2017 dollars | 2024 | NIST from BEA |
| $2.9 trillion | Current dollars | 2024 | NIST from UN data |
| $2.90 trillion | Current dollars | 2025 annual | NAM from BEA |
| $3.168 trillion | Current dollars, seasonally adjusted annual rate | Q2 2026 | NAM from BEA |
Copy these lines into an email, fill them in and send. I reply with scope and a price within 2 to 3 business days.
Open the email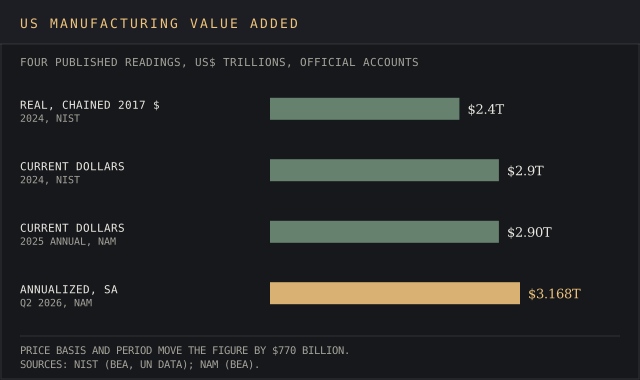
Shares of GDP vary for the same reason. NIST puts manufacturing at 10.0% of GDP in 2024 in real terms, the Cleveland Fed at about 9.5% in Q3 2025, and NAM at 9.7% of value-added output in Q2 2026. Any figure in the 9.4% to 10.2% range is defensible if its basis and period are named.
On NAM's reading, $2.90 trillion in 2025 value added would make U.S. manufacturing alone the eighth largest economy in the world, using IMF country GDP figures.
Manufacturing employment and job openings
Manufacturing employment stood at 12.681 million in October 2026, seasonally adjusted and preliminary, up from 12.628 million in July. Production and nonsupervisory workers made up 8.757 million of the total. The BLS industry page shows:
- Unemployment rate for manufacturing workers: 2.7% in October 2026
- Job openings: 594,000 in September 2026, after 606,000 in July and 537,000 in August
- Hires: 331,000 against 326,000 separations in September
- Union members: 7.7% of manufacturing wage and salary workers in 2025, down from 7.9% in 2023
- Recordable injuries and illnesses: 2.7 cases per 100 full-time workers in 2024
Openings remain above the 2017 to 2019 average of 432,000 that NAM cites, a sign of steady growth in demand for labor, though well below the 756,000 average of 2021 to 2023. Manufacturing remains a shrinking share of total employment as other sector payrolls across the economy grow faster, a decline running for decades: about 25% in 1976 against roughly 10% by mid-2025, on the Cleveland Fed's September 2026 commentary.
The workforce gap is the elephant in the room, and it's expected to widen. Deloitte and The Manufacturing Institute estimate 3.8 million manufacturing jobs will be needed through 2033, with 1.9 million at risk of going unfilled. Retirements account for 2.8 million of the openings and growth for 760,000. In NAM's Q3 2026 survey, 54.9% of respondents named attracting and retaining talent as their primary challenge.
Wages, pay and benefits
Manufacturing work brings home the bacon on every measure, with wages and benefits above the private-sector average:
- Average total compensation, pay plus benefits: $112,261 per worker in 2025, against $94,347 for all private nonfarm workers (BEA via NAM)
- Average hourly earnings, all employees: $37.24 in October 2026, with an average week of 40.5 hours (BLS)
- Production and nonsupervisory employees: $30.43 an hour and 41.8 hours a week (BLS)
- Health insurance: 95% of manufacturing employees were eligible for employer coverage in 2025, against 80% across all firms, per KFF's Employer Health Benefits Survey
The average family plan cost $25,428 in manufacturing in 2025, against $26,993 across all industries. Other quoted figures, $106,691 and $75,000 before benefits, don't match the 2025 BEA release, which puts total compensation at $112,261.
Manufacturing establishments and firm size
The Census Bureau's Statistics of U.S. Businesses counted 239,265 manufacturing firms in 2022. Firms and establishments are separate counts, since one firm can run many establishments. The industry runs on small firms and large employers at the same time:
- About three-quarters of firms had fewer than 20 employees
- 93.1% had fewer than 100
- Only 4,177 had 500 or more, about 1.7% of firms by our division
- Those large firms employed 59.1% of the manufacturing workforce
Manufacturing establishments, the individual plants of the industry, outnumber firms because large employers run many sites, so establishments and firms are two different data counts. U.S. affiliates of foreign multinationals employed more than 3.0 million manufacturing workers in 2024, about 24% of the sector, led by transportation equipment (672,300), chemicals (433,600), food (359,300) and machinery (299,000), on BEA data via NAM.
Exports and global manufacturing
U.S. manufactured goods exports hit a record $1,763.8 billion in 2025 on Census data compiled by NAM. Durable goods reached an all-time high of $1,169.6 billion, and nondurable goods slipped to $594.1 billion from $599.5 billion in 2024. Exports expanded 2.8 times from $622.3 billion in 2002, steady growth across two decades, so the claim that they've doubled since 2002 misses the mark.
World trade in manufactured goods reached nearly $15.9 trillion in 2024, per the World Trade Organization, and the US share was 7.8%. Those goods reach consumers and factories in other countries as finished products and as components.
On production, the World Bank's data series puts world manufacturing value added at $16.62 trillion in 2024 and China's at $4.65 trillion, about 28% by our division. China holds the lion's share among countries; Germany followed at $844 billion and Japan at $788 billion. The World Bank series carries no 2024 US value, so NIST's $2.9 trillion in current dollars fills the gap.
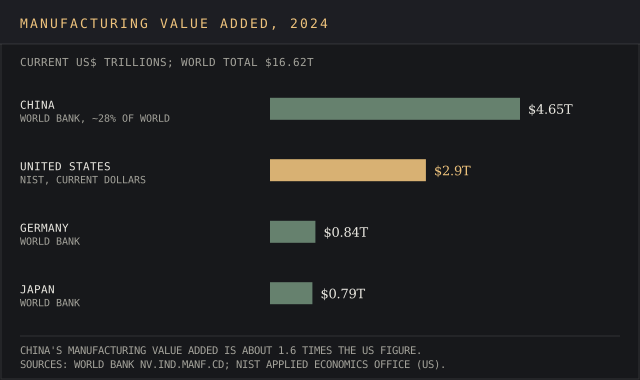
Want a country comparison chart like this for your own sector? Send the industry and the countries.
Email a briefThe US share of global manufacturing depends on the house. The Cleveland Fed cites UNIDO at roughly 15% for 2023, while $2.9 trillion against the World Bank's $16.62 trillion world total gives about 17% for 2024, our own calculation from two sources. Either way the US ranks second, and NIST reports China producing more than the US in 11 of 14 manufacturing subsectors in 2022.
Production, capacity and the business cycle
Three monthly indexes track the cycle in the most recent year. The Federal Reserve's G.17 release of 16 October 2026 showed manufacturing volume up 0.3% in September and 1.1% on a year earlier, with capacity utilization at 75.9% against a 1972 to 2025 average of 78.2%. Total industrial production, which adds mining and utilities, expanded 0.7% in the month.
ISM's Manufacturing PMI read 55.5 in October 2026, up from 54.5 in September, the 10th straight month the sector expanded. Its sub-indexes put new orders at 55.5, production at 59.0 and employment at 52.4. The prices index at 75.2 shows input costs still climbing, a bitter pill to swallow and a pressure Deloitte's 2026 outlook puts at about 5.4% expected input-cost growth over a year.
Factory construction has moved to the back burner in the manufacturing sector. Private manufacturing construction spending fell to $168.2 billion in August 2026, down 19.8% year over year and declining since November 2024, though it remains well above pre-pandemic levels (Census via NAM).
Innovation, R&D, AI and energy
Manufacturing remains the largest source of private innovation. Manufacturers perform 50.1% of all private-sector research and development, and manufacturing R&D expanded from $132.5 billion in 2000 to $431.3 billion in 2025, with pharmaceuticals at 37.2% of the total (BEA via NAM). Foreign direct investment in U.S. manufacturing, much of it in plants and product development, reached a record $2.51 trillion in 2025, 42.8% of all FDI.
Adoption of new process technology is wide but shallow, and the jury's still out on payback:
- 72% of manufacturers have adopted AI in some form and 10% at scale, per a Parsec survey of 1,200 leaders fielded February 2026; the vendor sells factory software
- 70% of the same sample have completed or are reshoring production, up from 33% in 2024
- 80% of executives plan to put 20% or more of improvement budgets into smart manufacturing, per Deloitte's survey of 600 executives
Automation keeps spreading beyond car plants, and robots increasingly work alongside people. The International Federation of Robotics counted more than 600,000 industrial robots installed worldwide in 2025, with China taking 354,200 and the US 38,400, and collaborative robots made up 11% of installations; our robotics report tracks the full IFR series.
Energy is the other big input. Industrial users consumed 31.19 quadrillion Btu in 2024, 33.3% of total US energy, and the Energy Information Administration expects 31.36 quadrillion Btu by 2030. Regulation adds cost too: NAM's October 2023 study put federal compliance at about $29,100 per manufacturing employee a year, and $50,100 at manufacturers with fewer than 50 employees, within total federal compliance costs of $3.079 trillion in 2022.
Delivered for your site and your byline. Hosting here is optional.
Frequently asked questions
What are the current statistics for the U.S. manufacturing industry?
12.681 million employees in October 2026 (BLS), $3.168 trillion of annualized value added in Q2 2026 (BEA), a 55.5 PMI in October 2026 (ISM) and 75.9% capacity utilization in September 2026 (Federal Reserve).
Is the manufacturing industry declining?
Its share of jobs has fallen while its output keeps growing. Manufacturing fell from about 25% of US employment in 1976 to about 10%, but factory volume rose 1.1% in the year to September 2026, employment is above its 2017 to 2019 average, and the PMI has shown expansion for 10 months.
Has manufacturing increased under Trump?
On the latest data, manufacturing employment of 12.681 million in October 2026 is above the 2017 to 2019 average, output grew 1.1% over the year to September 2026, and the PMI has expanded for 10 months. Capacity utilization at 75.9% remains below its long-run average, and private manufacturing construction spending is down 19.8% on a year earlier.
What US state is #1 in manufacturing?
California has the largest manufacturing output and the most manufacturing jobs, and Indiana has the largest manufacturing share of its state economy, at about a quarter of GDP, on BEA state GDP data.
What are the 5 KPIs for manufacturing?
Plants commonly track overall equipment effectiveness, capacity utilization, throughput, first-pass yield and on-time delivery. At the national level, the equivalents are the Fed's capacity utilization rate, BEA value added, BLS productivity and the ISM PMI.
What are the three main types of manufacturing?
Make-to-stock, make-to-order and make-to-assemble describe how a plant meets demand. By process, plants split into discrete, repetitive and process manufacturing, the last covering food, chemicals and other goods made in batches or continuous flows.
Bottom line
U.S. manufacturing is large and growing slowly: $3.168 trillion of annualized value added, 12.681 million jobs, a record $1.764 trillion of manufactured goods exports and a PMI in expansion. Its share of employment and GDP has fallen for decades, and China's manufacturing value added is about 1.6 times larger, a decline in relative standing for the US economy.
When you quote a manufacturing figure, name its price basis and period. Most disagreements between published numbers come down to real against current dollars, annual against quarterly rates, or a trade body's estimate against an agency's count.
Equipment makers, industrial software vendors and trade groups publish reports like this one as lead magnets and client briefs.
A report on your topic for a blog page, gated content or a lead magnet.
Written for your client and published under their brand, with my name left off.
Your report on marketintelligencetools.com, with 2 to 3 CTAs carrying your sponsored links.
Default terms: the report is yours to publish, and I keep the right to republish it on this site behind a gate, outside Google's index.
The national accounts, payroll surveys and trade body tables behind each factory figure, and why the totals differ
Government sources: bls.gov (Manufacturing industry at a glance, Current Employment Statistics and JOLTS), federalreserve.gov (G.17 Industrial Production and Capacity Utilization, October 2026), bea.gov (GDP by state), nist.gov (Total US manufacturing), clevelandfed.org (Economic Commentary, September 2026) and data.worldbank.org (manufacturing value added, current US dollars).
Trade body and industry sources: nam.org (Facts About Manufacturing, from BEA, BLS and Census data), prnewswire.com (ISM Manufacturing PMI report, November 2026), deloitte.com (2026 manufacturing industry outlook) and parsec-corp.com (survey of 1,200 manufacturing leaders).
All figures checked 20 November 2026. BEA reports manufacturing value added in real and current dollars, quarterly and annually, so every headline total has to name its basis and period, which is why the quoted figures run from $2.4 trillion to $3.2 trillion.