Data triangulation: checking one source against another
 By Jan Suski. I go deep on every review, checking every number against its source and digging up details other coverage misses, a habit from six years of SEO and link building for tech companies. Bylines at Surfer, Brand24, and Senuto. How the scoring works.
The short version 11 points · 40 seconds
- 01Triangulation tests a finding against independent sourcesAgreement confirms, disagreement locates error
- 02Mathison named three outcomes, and convergence is oneConvergent, inconsistent, contradictory
- 03Denzin’s four types vary source, method, analyst, theorySet out in 1978, reused by Patton in 1999
- 04Two coders on one transcript expose a single readingCohen’s kappa puts a number on agreement
- 05Three trackers put 2Q26 phone shipments down 6% to 11%IDC 6.7%, Omdia 6%, Counterpoint 11%
- 06Apple’s 20% share converged across all three trackersSamsung’s ranged from 22% to 24%
- 07Compare definitions before averaging any two figuresUnits, periods and market boundaries
- 08Two reports built on one dataset count as one sourceIndependence beats the number of sources
- 09Interviews, tickets and notes confirm a churn reasonA reason found in all three holds up
- 10Mixed methods is a design, triangulation a purposeA study can use its strands for either
- 11Sources that copy each other create false confidenceForcing agreement throws away evidence
Data triangulation is the practice of checking a finding against two or more independent sources, methods or analysts, so that agreement confirms it and disagreement shows where it breaks. This lesson is for market intelligence analysts, researchers and anyone who has to put one market figure in front of a decision-maker.
It covers the four types of triangulation, a worked example where three research firms reported different numbers for the same quarter, and a set of rules for what to do when sources disagree. It matters because a single source carries its own errors into every slide that cites it, and nobody downstream can see them.
The previous lesson in this path, on market intelligence analysis, covers how the data gets collected; this one covers how to check it before it's used.
What data triangulation is, and the three outcomes it produces
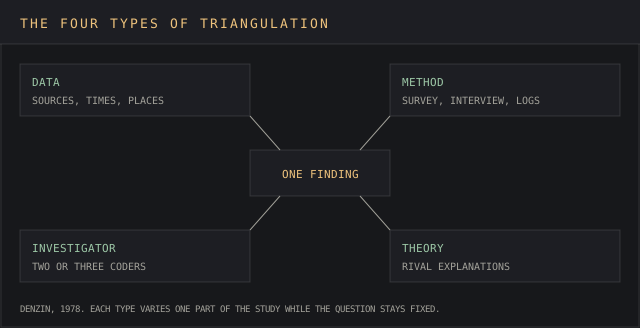
Triangulation borrows its name from surveying, where a position is fixed by measuring angles from two known points. In research it means approaching one question from multiple angles. Nancy Carter and colleagues summarise the standard definition in Oncology Nursing Forum (2014): triangulation is the use of multiple methods or data sources in qualitative research, and a strategy to test validity through the convergence of information from different sources.
Convergence is the hoped-for result, and it's one of three. Sandra Mathison's 1988 paper in Educational Researcher, "Why triangulate?", argued that researchers expect sources to lead to a single proposition and rarely get one. Her alternative view: triangulation results in convergent, inconsistent and contradictory evidence, and the researcher has to make sense of all three.
That reframing is the useful part for market work, where trusting one source is putting all your eggs in one basket. A team that only accepts agreement treats every inconsistency as noise and averages it away. A team that reads the disagreement finds the definitional gap, the stale dataset or the biased sample behind it, and those research findings are often worth more than the confirmation. The conclusions it reaches are slower and harder to argue with.
The four types of triangulation
Norman Denzin set out four triangulation methods in 1978, and Michael Patton's 1999 framework uses the same four, as Carter and colleagues record. Each one varies a different part of the research process while the question stays fixed, and researchers often combine two or three on one project.
Data triangulation
Data triangulation keeps the method and varies the data sources. Denzin split it into time, space and person: the same question asked in January and July, in two regions, or of buyers and of sales reps.
Combining data sources this way catches findings that hold only in different contexts. To triangulate data across time, collect data in two waves with the same questions, and to triangulate data across people, collect data from two roles. A churn driver that appears in enterprise accounts and vanishes in SMB accounts is a segment finding, and one source alone would have reported it as universal.
Method triangulation
Method triangulation uses multiple methods, and different data collection methods, on the same question. Within-method triangulation stays inside one family, such as two survey designs. Between method triangulation crosses families, such as quantitative surveys checked against interviews or focus groups.
Each method fails in its own way: surveys carry response bias from their wording, interviews carry the interviewer, and usage logs miss intent. Methods with different failure modes rarely fail in the same direction at once, so multiple approaches to one question leave fewer blind spots.
Investigator triangulation
Investigator triangulation involves multiple researchers analyzing the same data. Two or three researchers code the same interview transcripts independently, a standard step in qualitative research, then compare their qualitative analysis. Where they agree, the researchers are on the same page and the code holds. Where different researchers differ, the codebook needs work.
Inter rater reliability statistics such as Cohen's kappa put a number on the agreement, which turns "we discussed it" into something a reviewer can check. Involving multiple researchers costs analyst hours and pays for them in a balanced interpretation, built from diverse perspectives, that doesn't hinge on one person's reading.
Theory triangulation
Theory triangulation, sometimes called theoretical triangulation, reads the same data through different theories. A drop in renewals can be read as a price problem, a product-fit problem or a champion-turnover problem, and each theory predicts a different pattern in the data.
Testing the theoretical perspectives, or multiple perspectives from the team, against each other shows which one the observations support, and diverse viewpoints on the team make the rival readings easier to state. It's the least used of the four in market research, and the one that most often stops a team barking up the wrong tree.
A worked example: three trackers, one smartphone quarter
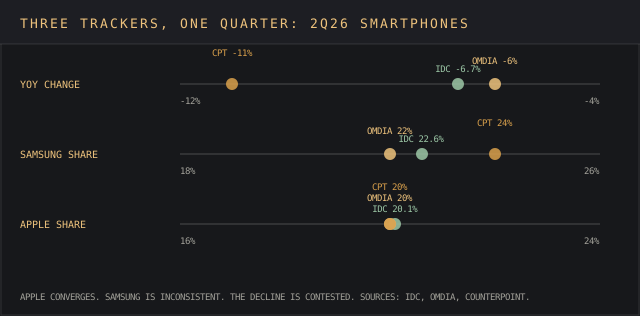
Market figures from research firms, the raw material of any industry report, are a daily example of triangulation for market researchers, because firms that sell the same kind of number rarely publish the same one. The second quarter of 2026 is a clean case. Three trackers reported global smartphone shipments within three weeks of each other.
IDC's preliminary data, published 13 July 2026, put shipments at 277.5 million units, down 6.7% year on year. Omdia's release of 30 July put them at 272.0 million, down 6%. Counterpoint Research reported a fall of 11%, the lowest second quarter since 2013, and blamed a memory shortage that raised phone prices.
| Measure, 2Q26 | IDC | Omdia | Counterpoint |
|---|---|---|---|
| Year-on-year change | -6.7% | -6% | -11% |
| Samsung share | 22.6% | 22% | 24% |
| Apple share | 20.1% | 20% | 20% |
| Xiaomi share | 11.2% | 11% | 12% |
| vivo share | 7.6% | 8% | 8% |
Read with Mathison's three outcomes, the analysis sorts itself. Apple's share converged at 20% across all three, so a report can state it plainly; it passed the check with flying colors. Xiaomi and vivo agree within a point. Samsung's share is inconsistent, 22% to 24%. The year-on-year decline is the contested figure: a 6% fall and an 11% fall describe different markets, and averaging them to 8% would publish a number no tracker measured.
The right move is to go to the primary methodology behind each analysis. The firms define shipments as units sold into channels, build estimates from supply-chain and vendor data combined, and revise preliminary figures later, so their findings differ by design.
A report that needs the decline should cite one tracker by name and say which, or cite IDC's 6.7% as the figure with published unit counts. Leave no stone unturned on definitions before picking, because the process that produced each number decides which conclusions it supports.
What to do when sources disagree
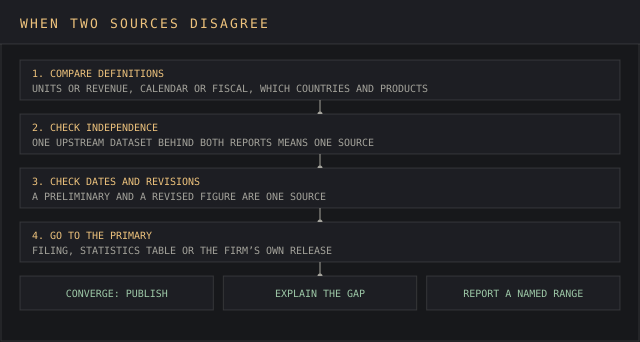
Disagreement between data sources is a research problem with a known order of checks, and researchers who skip one tend to publish the wrong figure. Run them in this order before deciding which number to publish.
- Compare definitions: units or revenue, calendar or fiscal quarter, which countries, which products.
- Check independence: two reports built on the same upstream dataset are one source counted twice, and a suspiciously exact match is a red flag.
- Check dates: a preliminary figure and a revised one aren't two sources.
- Go to the primary: the filing, the statistics agency table or the firm's own release.
- Publish one number with its source, or a range with every source named.
Independence is the check most teams skip. Two market-size reports that both cite the same government table aren't confirming each other, and three blog posts that jump on the bandwagon of one analyst firm's estimate add zero evidence. Real triangulation needs multiple sources with different paths to the number, three sources of data that don't share an origin, such as a government count, a company filing and a survey.
When the gap survives every check, it's one of the findings, and researchers should report it. If a bottom-up estimate sits 40% under a top-down figure, that tells the analyst that one of the assumptions is wrong, and the reconciliation steps in how to size a market show how to trace which one. Validate findings by finding the cause, and avoid splitting the difference between different sources.
Triangulation in qualitative research
Triangulation started in social science, and qualitative research still uses it most. A qualitative study of why buyers churn might draw on interviews, support tickets and account notes as different data sources. Each is qualitative data, and combined they give a richer understanding and a deeper understanding of motive than any one of them, because a reason that appears in all three is less likely to be one interviewee's story.
Qualitative and quantitative data can also be triangulated against each other. If a survey says 30% of users never open a feature, interviews can explain why.
The qualitative insights explain the number, and the number tells researchers how far the explanation reaches. Combined, the two give findings neither produces alone. Researchers who combine qualitative and quantitative methods this way use qualitative methods to explain and numbers to size, the main bridge between the two research methods.
Mixed methods and triangulation
Mixed methods and triangulation overlap without being the same thing. A mixed methods approach, covered in qualitative vs quantitative research, is a study design that plans qualitative and quantitative strands from the start. Triangulation is a purpose: confirming findings by bringing multiple perspectives to one question.
A mixed methods study can use its strands for triangulation, or for other purposes such as using interviews to write the survey. Secondary data works the same way; checking a vendor's claim against secondary market intelligence is triangulation with sources that cost nothing to collect.
Where triangulation goes wrong
Triangulation is time consuming, and that's its main cost. A second method adds fieldwork and data collection, a second coder adds analyst hours, and reconciling contradictory findings takes longer than reporting one source. For a quick directional answer, one good source may be enough. For a number that sets a budget, the extra week is cheap.
False confidence is the worse failure. Multiple sources that agree because they copy each other make a wrong number look checked, and researchers then focus on presenting it.
Forcing agreement is the other trap: a team that discards the outlier source to make the picture tidy has thrown away the one piece of evidence that disagreed. Tracing where a figure came from, and which research process produced it, covered in data source attribution techniques, is how to tell copies from independent evidence.
Integrating different types of data also takes skill. Qualitative analysis of interviews and a regression are separate trades, and an analyst who's comfortable with one can misread the other. Two people with different skills, or one method the team knows well plus one it's learning, is a fair way to start.
FAQ
What is an example of triangulation?
Checking a market figure against three research firms is a common one. In 2Q26, IDC, Omdia and Counterpoint all reported Apple at about 20% of global smartphone shipments, which confirmed the share, while their year-on-year declines ranged from 6% to 11%, which flagged that figure for a closer look.
What is the difference between triangulation and trilateration?
Both come from navigation. Triangulation fixes a position from angles measured at known points, and trilateration fixes it from distances, which is how GPS receivers work. In research only triangulation is used as a metaphor, for approaching a question from different points.
What is the difference between mixed methods and triangulation?
Mixed methods is a study design with both qualitative and quantitative strands. Triangulation is one purpose such a design can serve: confirming a finding across those strands. A study can triangulate without mixing methods, by using multiple data sources within one method.
Why is triangulation bad?
Its costs are real. It takes more time and money, it can produce contradictory findings that are hard to interpret, and it gives false confidence when the sources aren't independent.
What are the four types of triangulation?
Data triangulation, method triangulation, investigator triangulation and theory triangulation, as named by Denzin in 1978. They vary the source, the method, the analyst and the theory.
What is the main purpose of triangulation?
To test the validity of a finding by checking it from more than one direction. Agreement raises confidence in the conclusions, and disagreement shows where a source, method or analyst introduced error in the process.
Bottom line
Data triangulation checks one source against another so that agreement confirms a finding and disagreement locates the error. The four types vary the data, the method, the analyst and the theory, and the result is convergent, inconsistent or contradictory findings that the analyst has to explain.
Cut corners here and a single source's mistakes travel into every deck that cites it. Do it carelessly, with sources that copy each other, and a wrong number gets a checkmark it hasn't earned. The 2Q26 smartphone figures show the difference: one share every tracker agreed on, one decline nobody agreed on, and a report that has to say which is which.