Qualitative vs quantitative research: pick the method from the question
 By Jan Suski. I go deep on every review, checking every number against its source and digging up details other coverage misses, a habit from six years of SEO and link building for tech companies. Bylines at Surfer, Brand24, and Senuto. How the scoring works.
The short version 12 points · 50 seconds
- 01Qualitative explains why; quantitative counts how manyWords and behavior against numerical data
- 02Seven differences separate the two, six fit a tableThe seventh is the order you run them in
- 03The research question picks the method firstKnown answer options mean a survey
- 04Qualitative samples stop at saturationGuest, Bunce & Johnson: inside 12 of 60
- 05A 2022 review puts saturation at 9 to 17 interviewsOr 4 to 8 focus groups, across 23 studies
- 06Margin-of-error math sets the quantitative sample1,067 respondents give plus or minus 3
- 07Plan the sample around the smallest subgroupPew's 160-person subsample: plus or minus 8
- 08Qualitative data gets coded, numbers get testedThematic analysis against regression
- 09Each method fails in its own predictable wayCoder bias against precise wrong questions
- 10Mixed methods research runs in one of three ordersExploratory, explanatory or convergent
- 11Integration happens at three levels or not at allDesign, methods and reporting
- 12A pricing study runs 12 interviews, then 400 surveysReasons first, then the size of each
Qualitative vs quantitative research is the choice between collecting reasons and collecting counts. Qualitative research methods gather what people say and do in their own terms, through in-depth interviews, focus groups and observation. Quantitative research turns the same subject into numbers a statistical test can check.
This lesson works backwards from the decision a study feeds. It covers which research questions need which method, how many interviews or survey responses each side needs, how each kind of data gets analyzed, and how a mixed methods approach puts qualitative and quantitative research in order. If the list of techniques is new, start with the market research methods lesson, which walks through surveys, focus groups and interviews one by one.
It's written for small market intelligence teams that have to defend a finding to someone holding a budget.
What qualitative and quantitative research each produce
Qualitative research produces non-numerical data: transcripts, field notes, open-ended answers, photos & screen recordings. Its job is to explain human behavior in the respondent's own words, so the output is a set of themes, quotes and mechanisms. A qualitative finding reads like "trial users stall at the CSV import because the template asks for fields their CRM doesn't hold."
Quantitative research produces numerical data from structured instruments: surveys with fixed answers, numerical ratings on a 1 to 10 scale, experiments, transaction logs. Quantitative research measures variables and checks how they move together. Its finding reads like a share of trial users who never finish the import, with a margin of error attached.
The two come from different questions. Quantitative research focuses on how many, how often and how much; qualitative research asks how and why. A team that needs both answers needs both kinds of data, and the order matters more than the ratio.
Put the two side by side as a qualitative vs quantitative data comparison and the split is about form. A qualitative research method keeps the context around each answer, while quantitative research analyzes numerical data stripped of it, which is what makes 400 answers comparable. Quantitative methods include surveys, experiments and analytics, and all three measure variables directly.
Neither side is new to market intelligence. The secondary sources covered in the secondary market intelligence lesson are mostly quantitative data someone else already collected: census tables, filings, panel statistics. Primary research is where a team chooses the method itself, and that's where this choice bites.
Key differences between qualitative vs quantitative research
Seven key differences separate the methods. The table holds the six that fit in a cell; the seventh, the order you run them in, gets its own section further down.
| Dimension | Qualitative research | Quantitative research |
|---|---|---|
| Question it answers | Why, how, what's going on | How many, how often, how much |
| Data | Words, images & observed behavior | Numbers, ratings, counts, structured data |
| Typical sample | 9 to 17 interviews, or 4 to 8 focus groups, to saturation | Hundreds to millions; 1,067 for plus or minus 3 points |
| Analysis | Coding, thematic analysis, discourse analysis | Descriptive statistics, regression analysis, statistical tests |
| What a finding can claim | That a reason exists and how it works | How common it is across the population sampled |
| Main failure | Interviewer and coder bias, findings that won't replicate | Precise answers to the wrong question |
The row that trips teams up is "what a finding can claim." Eight people in a room can prove a reason exists. They can't tell you that 40% of the market holds it, and a slide that says so is a red flag for anyone who reads methods sections.
Start from the research questions
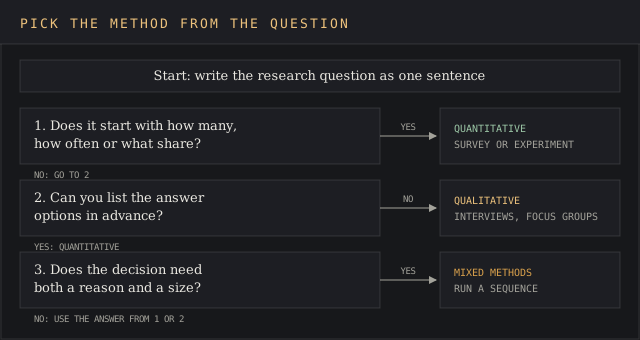
The research question picks the method before the budget does. Write the question as a sentence and look at the first two words. "How many," "how often" and "what share" are quantitative; "why," "how do" and "what happens when" are qualitative.
A second test settles harder cases: can you list the possible answers in advance? A survey question needs its answer options written before fieldwork, so a quantitative study works only when the options are known. If the team can't write the list, counting anything is jumping the gun, and a few one-to-one interviews will produce the list. That's why qualitative methods come first when little is known about a topic, a new segment or a new product category.
Good research questions are narrow enough for one method. Quantitative research questions name a variable and a population: what share of U.S. mid-market finance teams use a planning tool. Qualitative research questions name an experience: how a finance team decides its spreadsheet has stopped working. Quantitative methods measure variables and test hypotheses; qualitative methods generate the hypotheses in the first place.
Then check the decision the answer feeds. A pricing committee choosing between two tiers needs a number it can defend, so it needs statistical evidence from a sample large enough for statistical analysis. A product team rewriting onboarding copy needs to know what confuses people, and five sessions of qualitative research can tell it that. To cut to the chase: pick the method whose output the decision-maker will act on.
Questions that mix both shapes, like "why do mid-market buyers churn and how many of them leave for price," are two research questions. Split them, and the split tells you the order.
How many interviews qualitative research needs
Qualitative studies size their samples by saturation, the point where new interviews stop adding new codes. The best-known test is Guest, Bunce & Johnson's 2006 study in Field Methods: across 60 in-depth interviews with women in two West African countries, saturation occurred within the first 12, and the basic elements of the metathemes were present after six.
Later work split saturation in two. In Hennink, Kaiser & Marconi's analysis of 25 interviews in Qualitative Health Research, code saturation arrived at nine interviews, but meaning saturation, the point where the team understood each issue, needed 16 to 24. The authors' own summary: code saturation means you've "heard it all," while meaning saturation is needed to "understand it all."
The broadest figure comes from Hennink & Kaiser's 2022 systematic review in Social Science & Medicine. Across 23 articles that tested saturation empirically or with statistical modeling, studies reached it within 9 to 17 interviews, or 4 to 8 focus group discussions. Those ranges assume a fairly uniform population and a narrow question.
For qualitative research inside a market team, those figures turn into a planning rule: budget 12 interviews per segment, review the codebook after each batch of three, and stop when a batch adds no new codes. Qualitative studies sized that way can say when they stopped and why.
Two things push qualitative studies past that range. A heterogeneous sample needs more interviews per segment, because saturation is reached inside each group separately; four buyer personas at nine interviews each comes to 36. A broad question also slows saturation down, so the devil's in the details of how tightly the interview guide is scoped.
Usability testing, a narrow kind of qualitative research, has its own version of the rule. Jakob Nielsen's March 2000 analysis for Nielsen Norman Group found that five test users uncover about 85% of usability problems, using the formula N(1 − (1 − L)n) with L, the share found by one user, at 31%. Nielsen's advice was to split a 15-user budget into three rounds of five, fixing problems between rounds.
How big a quantitative sample has to be
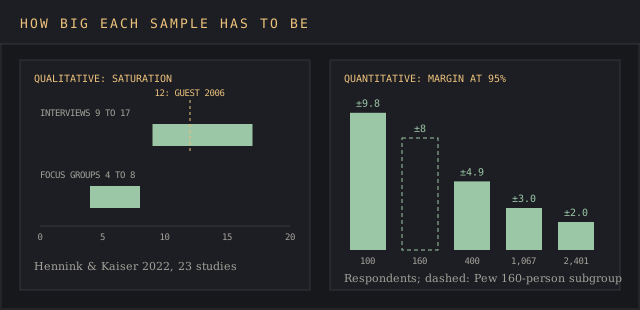
A quantitative study sizes its sample by margin-of-error math, and the formula fits on one line. Quantitative research needs numerical data from enough people that chance alone can't explain the result. At 95% confidence, the margin for a proportion is 1.96 times the square root of p(1 − p) divided by n. The worst case is p = 0.5, a 50/50 split, so planners use that.
Run the numbers and the curve flattens fast:
- 100 respondents: 1.96 × √(0.25 / 100) = plus or minus 9.8 points.
- 400 respondents: plus or minus 4.9 points.
- 1,067 respondents: plus or minus 3.0 points.
- 2,401 respondents: plus or minus 2.0 points.
Going from 400 to 2,401 responses, six times the cost of collecting data, buys about three points of precision. Quantitative methods buy precision with sample size, and halving the margin takes four times the sample. Pew Research Center's margin-of-error explainer uses the same 1,067-case example and lands on the same plus or minus 3 points.
The trap is the subgroup. Pew's own example: Hispanics are about 15% of U.S. adults, so a proportionate national sample holds about 160 of them, and their margin is plus or minus 8 points for one candidate's support. The margin on the gap between two candidates is about twice the single-candidate figure, so a 3-point margin becomes roughly 6 when you compare two shares.
Plan the sample around the smallest group the report will break out. A survey of 1,067 B2B buyers that splits five ways by company size leaves about 213 per cell if the split is even, and about plus or minus 6.7 points on each. That's often too wide to rank segments that differ by four points.
For a quantitative study that has to test hypotheses about a difference, an A/B price test or a before-and-after comparison, the sizing tool is a power analysis. It takes the smallest effect worth detecting, the significance level and the target statistical power, usually 80%, and returns the sample per group. Skipping it is par for the course on small teams, and it's how studies end up reporting that nothing changed when the sample was too small to see a change.
At the far end sits the U.S. Census Bureau's American Community Survey, which selected 3,543,672 addresses in 2024 and completed 1,944,002 final interviews. That's the sample size that lets the bureau publish statistically significant estimates for small counties. A 400-person quantitative study is a drop in the bucket next to it, and that's fine, because a market team rarely needs county-level detail.
Data analysis on each side
Qualitative analysis turns transcripts into themes through coding, and its output is narrative insights: themes with the quotes that support them. The most-cited procedure is Braun & Clarke's thematic analysis, whose six phases the authors restated in a 2022 update: familiarising yourself with the dataset, coding, generating initial themes, developing and reviewing themes, refining, defining and naming themes, and writing up.
The analytic process is iterative. Researchers read each transcript, tag passages of qualitative data with codes, then group codes by identifying recurring themes across interviews.
To analyze qualitative data well, a second coder works through a share of the transcripts on their own and the pair compares codes, which is how qualitative researchers catch their own blind spots. Teams that skip the second coder gain insights faster and lose the check on them. Other routes exist for text data, discourse analysis among them, which reads between the lines of how something is said as well as what.
Statistical analysis on the quantitative side starts with descriptive statistics: counts, shares, means, medians and spread. That descriptive data describes the sample. Statistical inference then asks what the sample says about the population, through statistical tests like chi-square for shares and t-tests for means, and regression analysis when several variables move at once.
ANOVA extends the t-test to three or more groups, and together these statistical methods cover most market survey questions. Quantitative researchers call this objective analysis because the procedure is fixed before the data arrives; the judgement moves into the questionnaire.
The statistical tools range from a spreadsheet to statistical software like R, SPSS or Stata, and the statistical procedures are the same in each. What changes the result is the data collection behind it: a clean random sample analyzed in Excel beats a convenience sample run through the fanciest model, because a rigorous analysis of a convenience sample still describes only the convenience sample.
Quantitative researchers tend to spend the lion's share of their time cleaning raw data before any test runs.
Qualitative and quantitative research both try to identify patterns. Qualitative analysis finds patterns in meaning, the reasons that come up again and again; quantitative analysis finds statistical patterns, the variables that move together across hundreds of cases. The market intelligence analysis lesson covers what happens once those patterns reach a decision.
Where each method breaks
Qualitative research breaks on researcher bias. The person who writes the interview guide, runs the sessions and codes the transcripts makes judgement calls at every stage, and a team that already likes a hypothesis tends to hear it. A second coder, an audit trail of code decisions and quotes kept in context are the standard defences, with each step of the research process logged in the trail.
Even with them, the findings can be hard to replicate, because a different team with a different guide will draw a different set of themes.
Qualitative research is also slow per data point. An hour-long interview produces a transcript that takes hours to code, and recruiting the right 12 people for a niche B2B role can take weeks. Finding a CFO at a 500-person logistics company who'll talk for an hour is a needle in a haystack without a panel or a warm list.
Quantitative research breaks on the question. A survey returns precise numbers for exactly the questions it asked, so a missing answer option disappears from the results without a trace. If 30% of churned customers left for a reason nobody thought to list, they'll pick "other" or the nearest wrong option, and the chart will look clean. That's precision about the wrong thing.
Quantitative research also drops contextual factors: a 6 out of 10 rating carries nothing about the week the respondent had.
It also breaks on the sample. Statistical significance assumes the people who answered represent the people you care about, and an email survey sent to your newsletter list represents your newsletter list. The sampling bias lesson in Path 2B covers how a skewed sample bends every number built on it.
Read the two failure lists side by side and the case for combining methods writes itself. Qualitative research protects a survey from asking the wrong question; quantitative research protects interview findings from being mistaken for market sizes.
Mixed methods research: ordering the two
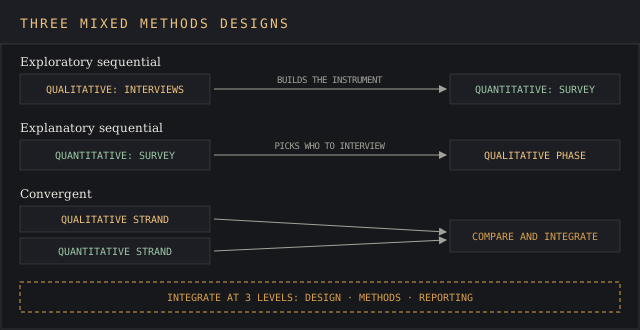
Mixed methods research plans qualitative and quantitative data collection as one study, with a stated point where the two meet. Fetters, Curry & Creswell's 2013 paper in Health Services Research names three basic designs, and the difference between them is order:
- Exploratory sequential: qualitative data first, and those findings shape the quantitative instrument. Interviews produce the answer options and the hypotheses, then a survey counts them and can test hypotheses about which matters most.
- Explanatory sequential: quantitative data first, and the results pick who to interview. A survey shows a drop among one segment, then interviews ask that segment why.
- Convergent: both collected in the same window, analyzed separately, then merged. Useful when the deadline won't allow two rounds of fieldwork.
The same paper names three levels where integration has to happen: the study design, the methods, and the interpretation and reporting. Skip all three and you've got two studies in one slide deck. The test is concrete: did the qualitative phase change a survey question, or did the survey results change who got interviewed? If neither, the methods ran side by side without informing each other.
Mixed methods designs combine the strengths of both, and they cost more than either alone. Running quantitative and qualitative research as one study means two recruits, two instruments & one integration plan. A team that can afford only one round of fieldwork should run the method that matches the decision and say plainly what it can't claim. Putting all your eggs in one basket is a known risk; pretending one basket holds two kinds of eggs is worse.
For most market questions the exploratory sequence is the default, because quantitative methods need answer options the team doesn't have yet. It's also the one that maps onto how customer intelligence programs build their surveys from interview notes.
A worked example: one pricing question run both ways
Take a SaaS company with 2,000 trial sign-ups a month and a question from the pricing committee: why do trial users pick the cheaper plan, and how many would move up for one extra feature? It's two questions, so it gets a mixed methods study in an exploratory sequence.
The qualitative phase runs 12 interviews, the Guest, Bunce & Johnson saturation mark, split across the two plans. Each interview asks what the user was trying to get done and what made the cheaper plan enough. Data analysis for this phase is coding: the team codes the transcripts, finds the recurring reasons, and turns each into a closed answer option, with the users' own wording kept in the option text.
The quantitative study sends a survey with those options to a random sample of trial users, aiming for 400 completes, and the survey can measure variables like plan, company size & feature need in one pass. At that size the margin is plus or minus 4.9 points on the full sample, which is enough to rank reasons that differ by ten points and too wide to rank reasons four points apart.
If the committee needs the split by plan, 200 per plan carries about plus or minus 6.9 points, and the team knows that before data collection starts. When the quantitative data comes back, every share maps to a reason someone gave in an interview.
Integration is written into the mixed methods plan, where the qualitative and quantitative phases meet: interview themes become survey options, and the survey shares go back next to the interview quotes in the report. That gives the committee measurable data on size and the reasons behind each number, the best of both worlds at the cost of about six weeks of collecting data.
The same structure works for segmentation work, where interviews identify patterns in the needs that define a segment and a survey sizes each one. It also gives the data source attribution step something clean to record: which number came from which phase and which sample, which matters once a report draws on multiple data sources.
FAQ
How do I tell if a study is qualitative or quantitative?
The research method shows in the data and the sample. A study that reports percentages, means or significance tests from a structured instrument is quantitative research, and its authors measure variables across a defined sample.
Qualitative studies report themes and quotes, non-numerical data from interviews, focus groups or observation. This is the quickest qualitative vs quantitative research test for a report you didn't commission. A study that reports both, with a stated link between the phases, is mixed methods.
What are 5 examples of qualitative and quantitative?
Qualitative examples: in-depth interviews, focus groups, ethnographic observation, open-ended survey answers and diary studies. Quantitative examples: closed-question surveys, A/B tests, numerical ratings like NPS, structured observations that count behaviors, and sales or web analytics data.
What are examples of qualitative research?
Common qualitative methods include one-to-one interviews with buyers, conducting focus groups with six to eight users, watching people use a product in their own office, and reading support tickets for recurring complaints. All four produce words or observed behavior that has to be coded before it says anything.
What is harder, qualitative or quantitative research?
They're hard in different places. Qualitative research is harder to do well and to defend, because the judgement sits with the researcher and the findings resist replication. Quantitative research is harder to set up: the questionnaire, the sample frame & the power analysis all have to be right before fieldwork, and a mistake there can't be fixed afterwards.
Can a survey be qualitative?
Yes, when its questions are open-ended. Free-text boxes turn a survey into qualitative research at survey scale, and the answers get coded like interview transcripts. Most surveys mix qualitative and quantitative questions, with closed questions for counting and one or two open questions for the reasons.
How many interviews are enough for a qualitative study?
For a narrow question and a fairly uniform group, 9 to 17 interviews, per Hennink & Kaiser's 2022 review, with 12 as a common planning figure. Plan that number per segment when the sample spans distinct groups.
Bottom line
The qualitative vs quantitative research choice is made by the research questions and the decision behind them. Questions about why get qualitative research, interviews or focus groups sized to saturation; questions about how many get quantitative research, with a sample sized by margin-of-error math around the smallest group you'll report.
When the decision needs both a reason and a size, run quantitative and qualitative research in sequence and write down where the two meet.
Getting it wrong is expensive in a specific way. A survey built before anyone listened returns clean percentages for the wrong answer options, and eight qualitative research interviews presented as market shares send a budget after a segment nobody measured. Both mistakes look fine on a slide, and both send the team back to the drawing board a quarter later.
The next lesson in this branch zeroes in on one qualitative method: what a focus group is, what it costs, how many people to recruit and where its group dynamics skew the results. For why getting method right pays off at the program level, the case for market intelligence lesson ties evidence quality to the decisions it feeds.