Sizing a market from public data, with TAM, SAM and SOM worked through
 By Jan Suski. I go deep on every review, checking every number against its source and digging up details other coverage misses, a habit from six years of SEO and link building for tech companies. Bylines at Surfer, Brand24, and Senuto. How the scoring works.
The steps 11 points · 40 seconds
- 01Know what market sizing measures, in revenue or unitsTAM is revenue at 100% market share
- 02Write the market definition before any numberUS counts run from 258,626 to over 1 million
- 03Use top-down market sizing as a quick ceilingStarts at $1.55 trillion, needs an assumed share
- 04Build bottom-up sizing from customer count times price258,626 restaurants at $299 a month: $928 million
- 05Cut TAM to SAM with filters the product can defend10+ employees: 146,428 sites and $525.4 million
- 06Set SOM as a capture rate with three scenarios1% to 5% of SAM is $5.3 million to $26.3 million
- 07Check market share against a public competitor's filingsToast: 164,000 locations, $2,047 million ARR
- 08Reconcile top-down and bottom-up through share of spendCore plan is 0.22% of average restaurant revenue
- 09Validate willingness to pay with primary researchTest a price ladder at $149, $299 and $499
- 10Strip out the errors that inflate a market sizeMixed years, wrong scopes, borrowed denominators
- 11Feed SOM into the go-to-market strategyQuotas and headcount run on the 1% base case
Sizing a market means estimating how much revenue, or how many units, a defined group of buyers could spend on one product in one year. This guide is for founders, product managers & analysts who need that number to survive an investor's or a budget owner's check, and it builds all three standard figures from public data: the total addressable market (TAM), the serviceable available market (SAM) and the serviceable obtainable market (SOM).
Each one is the number of potential customers multiplied by what they pay, then cut down by filters. The worked market sizing case is reservation software sold to US full-service restaurants, using Census Bureau establishment counts, OpenTable's published plan prices and Toast's 2025 SEC filings. Every input links to the page it came from, so the market sizing exercise can be rerun for a different product.
What market sizing measures, in revenue and in units
Market sizing estimates total revenue or sales volume for a specific market over a stated period, usually 12 months. Most teams estimate market size in revenue for software and services. Units suit physical goods, where sales volume and purchase frequency carry the answer: a restaurant buys one reservation system and reorders napkins every week.
The total addressable market (TAM) is the revenue available if every potential customer bought, which means 100% market share. The serviceable available market (SAM), which some teams call the serviceable addressable market, is the part of TAM the product can reach with its current features, geographic region and distribution channels.
The serviceable obtainable market (SOM) is the share of SAM a company can realistically capture based on competitors, price and sales capacity. A TAM on its own is pie in the sky for a seed-stage team. The SOM is the figure a budget, a hiring plan and a first-year quota get built on.
Market sizing helps a company prioritize investments and compare market opportunities on the same scale. That's the job inside market intelligence work: turn a vague sense of customer demand and potential demand into a number with its inputs showing, the discipline the fundamentals guide lays out.
Write the market definition before any number
Public counts of the overall market for US restaurants differ by a factor of four, and each one is correct for its own definition. The table lists five that a market sizing analysis for a restaurant product could start from.
| Count | Source | What it counts |
|---|---|---|
| 258,626 | Census County Business Patterns 2023, NAICS 722511 | Full-service restaurants with paid employees |
| 270,088 | Census County Business Patterns 2023, NAICS 722513 | Limited-service restaurants with paid employees |
| 618,476 | Census County Business Patterns 2023, NAICS 7225 | All restaurants and other eating places with paid employees |
| About 820,000 | Toast 2025 10-K and results release | Implied: 164,000 Toast locations divided by Toast's own 20% share estimate |
| More than 1 million | National Restaurant Association, February 2026 | Restaurant and foodservice outlets |
The gaps come from scope. County Business Patterns covers businesses with paid employees, per the Census Bureau's own release, so an owner-operated food truck sits outside all three Census rows. Industry associations can draw the line wider: the National Restaurant Association's count takes in foodservice outlets of every kind.
The devil's in the details here. Reservation software's target market is table-service restaurants, so this market sizing example starts at 258,626 full-service establishments and leaves out the 270,088 limited-service sites where customers order at a counter.
Adding the 270,088 limited-service sites at the same price would put another $969.1 million into the total addressable market, a bigger swing than any price change later in the model.
Top-down market sizing: start from the overall market and cut
Top-down market sizing starts from macro-level industry data and filters down to a niche. The National Restaurant Association projects $1.55 trillion of restaurant and foodservice sales in 2026. The Census Bureau's Service Annual Survey puts 2022 revenue for full-service restaurants with employees at $424.4 billion.
Divide $424.4 billion by the 257,282 full-service establishments Census counted in 2022 and average revenue comes to about $1.65 million a restaurant. That's a useful data point for later.
The top-down approach still needs one more input: the share of revenue a restaurant spends on reservation software. That percentage is the market sizing analyst's assumption, and the answer moves one-for-one with it. Top-down is quick and dirty. It's faster and less accurate than counting customers, which makes it a ceiling to sanity-check against and a weak base for revenue estimates.
Industry reports from research firms run the same top-down logic with more market data behind the percentage. They're worth buying when a team needs a figure for a category it can't count from government industry data, and the market databases that resell industry reports disclose the method in varying detail.
Bottom-up market sizing and the market sizing formula
The market sizing formula for a bottom-up approach is the number of potential customers multiplied by average revenue per customer per year. For restaurant reservation software both inputs are public. Census counts 258,626 full-service restaurants in 2023, and OpenTable lists its Basic plan at $149 a month, Core at $299 and Pro at $499.
At the Core price of $3,588 a year, the market size calculation is 258,626 × $3,588 = $928.0 million. At Basic, $1,788 a year, the same market size calculation gives $462.4 million. Both leave out OpenTable's per-cover fees of $1 to $1.50, so they're a subscription floor for the total addressable market (TAM).
Bottom-up market sizing is the more credible method for early-stage startups because every input can be checked. An investor can open the Census table and the price page and get the same $928 million. It's slower to build, since actual data on customer counts rarely arrives cut the way a product needs it. A bottom-up approach also yields granular data, because the same Census table splits by state, county and employee size.
The total addressable market template lays the same multiplication out in a spreadsheet, with the count, the price and the source in separate cells.
Narrow TAM to SAM with filters the product can defend
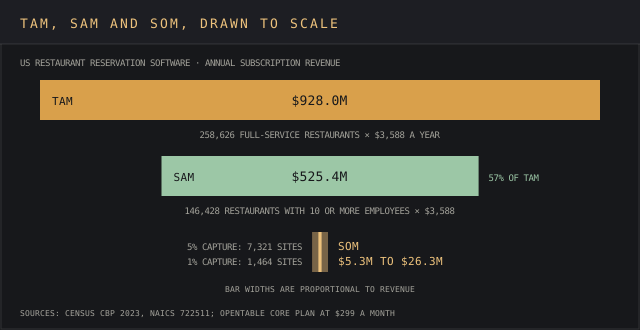
SAM is the portion of a given market a company can realistically target with the product it ships today: its features, geographic reach & sales motion. A reservation book earns its fee where tables turn often enough to need managing, so the worked example drops the smallest restaurants. Census splits the 258,626 full-service establishments by employee count: 67,995 have fewer than 5 employees and 44,203 have 5 to 9.
Removing those 112,198 sites leaves 146,428 restaurants with 10 or more employees. At $3,588 a year, the serviceable available market (SAM) is $525.4 million, 57% of the potential market in the TAM.
Every market sizing filter needs a reason a buyer would recognize, and it needs a column in a public table. County Business Patterns publishes counts down to county and ZIP code level, so a team selling in three states can zero in on exactly those customer segments. The market segmentation guide covers which variables can be counted.
A target market defined by attitudes, such as hospitality-minded owners, has no Census column and turns the SAM back into a guess.
Set the serviceable obtainable market (SOM) as a capture rate
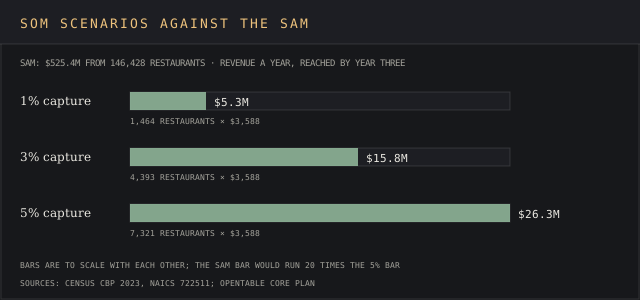
The serviceable obtainable market (SOM) is the slice of SAM a company can realistically capture based on sales capacity, competitors and any competitive advantage in price. It's the one market sizing input that's pure assumption, so model it as scenarios. Three capture rates, each reached by year three, against the $525.4 million SAM:
- 1% of SAM: 1,464 restaurants, $5.3 million a year
- 3% of SAM: 4,393 restaurants, $15.8 million a year
- 5% of SAM: 7,321 restaurants, $26.3 million a year
Scenario analysis in market sizing shows how far revenue projections swing on one input: a fivefold range from the same SAM. Don't count your chickens before they hatch. The 1% case is the one to plan headcount against until pilot data shows product-market fit at a higher close rate, and the market potential calculator runs the same penetration-rate scenarios in a browser.
Check market share against a competitor's filings
A public competitor's annual report is a free check on the whole market sizing model, straight from the horse's mouth. Toast sells point-of-sale systems to restaurants and ended 2025 with about 164,000 locations and annualized recurring run-rate of $2,047 million, per its fourth-quarter results. That's a second data point: about $12,500 a location a year across subscription and payment processing.
Toast's 2025 annual report on Form 10-K adds a market share claim: US locations on its platform are "approximately 20% of the U.S. restaurant market." Divide 164,000 by 0.20 and the implied market is about 820,000 locations, before subtracting Toast's international sites. For market sizing, that denominator sits between the Census count of 618,476 eating places and the association's 1 million outlets.
Toast's subscription services revenue was $936 million in 2025, about $5,700 per year-end location. A reservation product at $3,588 a year asks for 63% of what the average Toast location pays Toast for software. Competitor location counts and revenue are the cheapest market data available for a competitive analysis, and the market share calculator turns them into shares.
Reconcile the top-down and bottom-up figures through share of spend
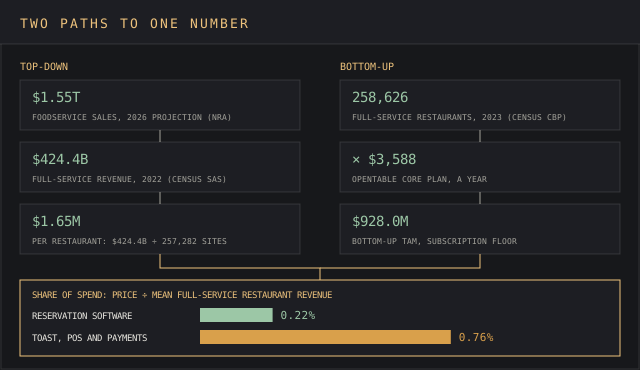
Analysts who estimate market size both ways find the two market sizing methods meet at one number: the share of a customer's revenue the product asks for. OpenTable's Core plan at $3,588 a year is 0.22% of the $1.65 million 2022 average for a full-service restaurant, and Basic is 0.11%. Toast's $12,500 a location, spread across point of sale and payments, works out near 0.76% of the same average.
A reservation tool taking 0.22% of revenue next to a point-of-sale system taking 0.76% is plausible. A figure above the point-of-sale share would call for a detailed analysis of the price and the customer count. When top-down and bottom-up market sizing disagree by more than 2x, go back to the drawing board on the definition before touching the percentage.
Validate willingness to pay with primary research
The Census table and the OpenTable price page are secondary research, the cheaper half of market research. The price still has to be tested on buyers, and the Small Business Administration's market research and competitive analysis guide lists the questions a market sizing model answers, including "What do potential customers pay for these alternatives?"
New markets need real-world data on buying intent. Interview target customers inside the SAM, run interviews and surveys with a price ladder at $149, $299 and $499, and count how many would pay at each rung to measure customer demand at each price. Easier said than done: the panel costs money, and the cost of market research scales with how hard the target audience is to reach.
The same SBA guide asks how many similar options already exist, which is market saturation measured from the buyer's side. Restaurants already paying Toast, OpenTable or a rival answer that question in the interview. Publicly available counts belong to secondary market intelligence, and the two together give reliable data on both size and price.
Market sizing mistakes that inflate the answer
Most bad estimates miss the mark through one of five errors, each visible once data sources sit next to the inputs:
- Broad industry figures used as the TAM, such as $1.55 trillion of foodservice sales for a product that only full-service restaurants buy.
- Mixed years with no label: 2022 revenue, 2023 counts and 2025 prices in one cell.
- A vendor's denominator borrowed as fact, such as Toast's implied 820,000 locations, which follows Toast's own definition of a restaurant.
- Outdated data read as current. The 2023 County Business Patterns came out on June 26, 2025, so the newest count is already two years old on release.
- A TAM read as a revenue target. $928 million is the ceiling at 100% market share.
Making assumptions explicit, with a source attached to every input, is what lets a reader find the one that's wrong. Market dynamics change the inputs every year, so market models built for market sizing need a date on every cell.
Where the market sizing number goes in a go-to-market plan
The SOM scenarios feed the go-to-market plan: quota per rep, the number of reps and the marketing budget needed to reach 1,464 restaurants in the base case. Next to a potential market of 258,626 full-service restaurants, that's a drop in the bucket, which is the point of a base case.
The TAM and SAM from market sizing answer an earlier business strategy question: which market opportunities deserve a team at all. The market intelligence strategy guide covers how that choice gets revisited, and the CAGR calculator projects a TAM forward once a growth rate is sourced.
FAQ
How do you do market sizing?
Start market sizing by defining the buyer, then count them from a government table such as County Business Patterns, multiply by average revenue, then cut to SAM and SOM with filters and capture rates. Check the result against a public competitor's filings. The market sizing template holds each step in one file.
Can you give me an example of a market sizing question?
A market sizing example: how much could US full-service restaurants spend on reservation software in a year? The worked answer here is 258,626 restaurants at $3,588, or $928.0 million. Interview market sizing questions use the same structure without the data, so candidates estimate the counts out loud.
Does McKinsey ask market sizing questions?
McKinsey's interviewing page says its problem-solving interview presents a business case, and its practice cases include Electro-Light, a product launch for a reduced-sugar sports drink. A launch case invites an estimate of how many buyers exist and what they'd pay, a market sizing exercise done out loud.
How do you measure the size of a market?
To estimate market size, multiply customer counts by average revenue. Calculating market size for physical goods uses units times purchase frequency. The best data sources are government statistics such as the Census establishment tables, industry associations such as the National Restaurant Association, and reports from market research firms, plus firmographic data providers where the buyers are companies.
What's the difference between TAM, SAM and SOM?
In a nutshell, the total addressable market (TAM) is everyone who could buy, SAM is everyone the product can reach today, and SOM is the share a company expects to win. In the restaurant example they come to $928.0 million, $525.4 million and $5.3 million in the base case.
Is top-down or bottom-up market sizing more accurate?
Bottom-up sizing, because each input in a bottom-up approach can be opened and checked. The top-down approach is faster and works as a ceiling, and a market intelligence analysis that runs both and compares the implied share of spend catches errors either method alone would hide.
Bottom line
Every market sizing estimate is a definition, a count and a price, multiplied together. The restaurant example shows the definition doing most of the work: the count of potential customers moves fourfold between the Census full-service row and the association's outlet total before anyone picks a price.
Market sizing done this way leaves a trail a reader can rerun. Get it wrong and a team staffs for a market measured in hundreds of millions while its base case is $5.3 million, then misses every quarterly target the plan was built on.