Sampling bias: how a skewed sample breaks a survey, and how to fix it
 By Jan Suski. I go deep on every review, checking every number against its source and digging up details other coverage misses, a habit from six years of SEO and link building for tech companies. Bylines at Surfer, Brand24, and Senuto. How the scoring works.
The short version 12 points · 50 seconds
- 01Sampling bias is set before anyone answersA gap between sample and target population
- 02Bias enters at the frame, the draw or the replyUndercoverage, selection, nonresponse
- 03Sample size shrinks error and leaves bias in placeBias pushes every sample the same way
- 04Six types cover most documented casesFrom coverage gaps to survivorship bias
- 05The 1936 Literary Digest poll called it wrong2.4 million ballots back out of about 10 million
- 06Three 1948 quota polls put Dewey aheadTruman won 50% to 45% against all three
- 07UK 2015 and US 2016 polls missed on the sampleCollege graduates over-represented in 2016
- 08Medicine and psychology carry the same flawUp to 80% of participants from 12% of the world
- 09A bigger sample tightens around the wrong value6.3 points of bias at 2,000 and 8,000 cases
- 10Check the sample against an outside benchmarkCensus, firmographic counts or your own CRM
- 11Random draws and weighting cut bias cheaplyPlus non-responder follow-up and a fixed plan
- 12Response, recall and observer bias are separateThey distort answers; sampling bias picks who
Sampling bias is a systematic distortion in who gets into a sample: some members of the target population are more likely to be selected or to respond than others, so the sample can't accurately represent the group it stands in for. It's decided before the first question is asked, and no amount of analysis afterwards puts the missing people back.
This page covers the types of sampling bias, the documented cases where it sank a forecast, how to check a sample you already hold, and the fixes a two-person market intelligence team can afford. It's lesson 2B.5 in the path on making data trustworthy. If turning raw findings into a decision is new, start with how market intelligence analysis works, since this page assumes you already know what the numbers are for.
What sampling bias is and where it enters a study
Sampling bias occurs when the sampling process gives certain groups a better chance of selection than others. A random sample avoids it by giving every member of the target population an equal chance; every other sampling method has to argue its way to the same place.
Statisticians define the problem through the expected value. An estimator is biased when the average of its results, over every sample the method could draw, sits away from the true population figure. Unbiased estimates land on the true figure on average, even when any one sample misses.
The goal is a representative sample: one whose mix of age, income, company size and other specific characteristics matches the entire population it describes. Sampling bias occurs whenever the selection rule tilts that mix, and a non-representative sample then produces research findings and research outcomes that hold only for the people who got in.
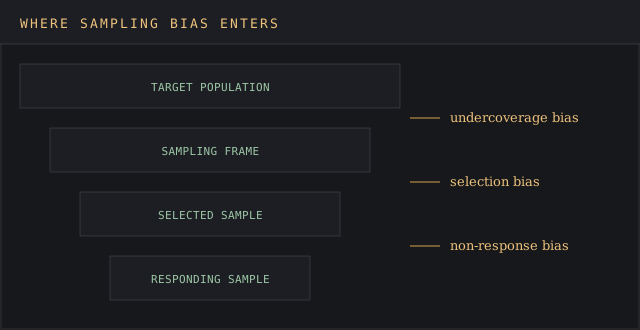
Bias enters a market research project at three narrowing steps, and each has its own name:
- The target population becomes a sampling frame, the list you can draw from. People missing from the list produce undercoverage bias.
- The frame becomes a selected sample. Hand-picking or easy access at this step produces selection bias.
- The selected sample becomes the people who answer. When they differ from the ones who don't, that's nonresponse bias.
Each step can leak on its own. A perfect frame with a 6% response rate still hands you whoever felt like answering, and a 90% response rate from a frame that misses a third of the market still answers the wrong question. The devil's in the details of each step, so a team auditing a study checks all three separately.
The fallout is a loss of external validity: research findings that hold for the people sampled and fail for the larger population the report claims to describe. That's how poor conclusions get made with clean arithmetic, and why the fundamentals of market intelligence put source quality ahead of analysis.
Sampling bias vs sampling error
Sampling error is the random wobble between one sample and the next. It falls as sample size rises, and a margin of error measures it. Sampling bias is a systematic error that pushes every sample in the same direction, and the margin of error says nothing about it.
The difference decides what to do with a bad number. A wide margin calls for more interviews. A biased sample calls for a different frame or a different selection rule, because adding interviews from the same flawed source only repeats the same mistake at a higher cost. Treating bias as noise is barking up the wrong tree.
Types of sampling bias
Six types of sampling bias account for most of the documented cases. They overlap, and one survey can carry three at once.
Undercoverage bias
This is the oldest form of sampling bias: part of the target population isn't on the sampling frame at all. An online survey of US adults misses the 3% who don't use the internet, and that gap grows to 11% among adults 65 and older, per the Pew Research Center's 2026 internet fact sheet. Internet access at home, measured as broadband, is thinner still: 78% of all adults and 71% of those 65 and over.
The sampling frame for an email survey is narrower again, since it holds only people who gave you an address. Those age differences matter for any product sold to older buyers. A telephone survey had the mirror problem two decades ago, when households without a landline dropped out of phone survey frames.
Non-response bias
Non-response bias arises when the people who answer differ from the people who were selected and didn't. When certain groups answer at higher rates, the sample tilts toward them. Typical telephone survey response rates fell to 7% in 2017 and 6% in 2018, after holding near 9% for several years, according to Pew's 2019 analysis of its own phone polls. Single-digit response rates are now par for the course in phone research.
A low rate doesn't guarantee a wrong answer. Pew's studies from 1997, 2003, 2012 and 2016 found little relationship between response rates and accuracy, but the same analysis says standard weighting falls short on measures tied to the act of participating, such as volunteering. People who give time to charities also give time to surveys.
Voluntary response and self-selection bias
Voluntary response bias happens when people pick themselves into the sample, usually because they hold strong opinions. Product review pages, open feedback links and social media polls all run on voluntary response, so they over-sample the delighted and the furious.
Self-selection bias is the broader name for the same mechanism, and it covers panels too: people who join a paid survey panel are a self-selected group before any study begins. A team that reads a 4.8-star average off a review site is reading the opinions of people who chose to write reviews.
Convenience and judgment sampling
Sampling techniques split into two families. Probability sampling gives every member a known chance of selection, with simple random sampling as the base case; non-probability sampling lets convenience or someone's judgment decide.
Convenience sampling selects whoever is easiest to reach: the customer list, the conference booth, the Slack community. It's quick and dirty, and it's the default in early-stage research because a small team can gather data in a week. It also produces a biased sample that looks tidy, since the people chosen already know and like you.
Judgment sampling swaps easy access for the researcher's own choice of who counts as typical. It works only when the researcher has substantial knowledge of the population, and even then the sample reflects whoever made the list. Avoid convenience sampling for anything you plan to size or forecast, and keep it for questions about the range of reasons a buyer gives.
Exclusion bias
Exclusion bias is sampling bias built in on purpose, usually through inclusion criteria written for convenience. A B2B buyer survey whose sampling method screens out companies under 50 employees, then reports on the whole market, has excluded the segment where most firms sit. A sample that skips part of the target audience can't speak for the larger population.
The fix sits in the screener. Every exclusion needs a stated reason tied to the question, and the report has to name who was screened out so readers can read between the lines.
Survivorship bias
Survivorship bias is the form of sampling bias that counts only the subjects that made it through a selection process. A study of current customers can't see the ones who churned, and a review of successful startups can't see the failed ones that followed the same playbook.
In market intelligence the usual form is a win-loss program that interviews only closed-won deals. The lion's share of the learning sits with the lost and abandoned deals, and they're the hardest to reach.
The table sets the six sources of bias side by side.
| Type | Where it enters | Market research example | First fix |
|---|---|---|---|
| Undercoverage bias | Sampling frame | Online-only survey of buyers 65+ | Add a phone or mail mode |
| Non-response bias | Responding sample | 6% response to a phone study | Follow up with non-responders |
| Voluntary response bias | Selection | Open feedback link on a pricing page | Invite a random sample |
| Convenience sampling | Selection | Surveying the newsletter list | Draw from a full customer frame |
| Exclusion bias | Screener | Cutting firms under 50 staff | Justify each inclusion criterion |
| Survivorship bias | Frame | Win-loss calls on won deals only | Sample lost and churned accounts |
Documented cases where sampling bias called the wrong result
Election polls carry the best evidence on sampling bias for one reason: the true answer arrives on a fixed date. Market research rarely gets a clean check like that, so these cases are the closest thing to a controlled test.
The 1936 Literary Digest poll
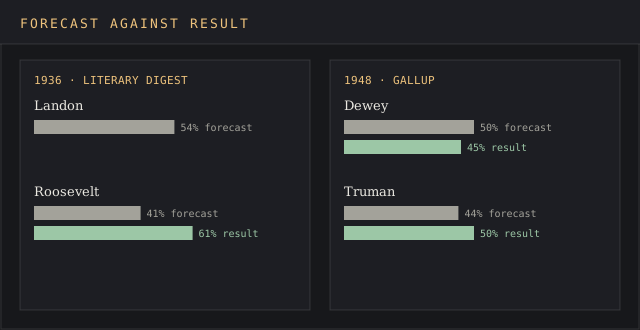
The Literary Digest mailed about 10 million postcard ballots for the 1936 presidential election and got nearly 2.4 million back, a response rate of roughly 24%. It forecast Alf Landon at 54% and Franklin Roosevelt at 41%. Roosevelt won about 61% of the popular vote, which makes the poll the textbook case of sampling bias.
The textbook explanation blames a frame built from car registrations and telephone books, which leaned toward wealthier voters. Dominic Lusinchi's 2012 reanalysis in Social Science History finds the opposite: had the Digest relied on those lists alone, it "would have forecast Roosevelt as winning the election."
His conclusion is that "the principal cause of the 1936 Literary Digest poll fiasco was most probably nonresponse bias." The people who mailed back the card were Landon voters in disproportion.
The 1948 quota polls
Crossley, Gallup and Roper all called the 1948 presidential election for Thomas Dewey. Gallup had Dewey at 50% and Harry Truman at 44%; Roper had 53% to 38%. Truman won 50% to 45%, per the University of Alabama in Huntsville's Random project record of the 1948 polls.
All three firms used quota sampling. Interviewers had to fill quotas by area, sex, age, race and economic status, and within each quota they picked respondents freely, with no random selection.
Republicans were slightly easier to find and interview, so the selection step leaned to Dewey even though the quotas matched the census on paper. A quota sample can look like a representative sample on marital status, income and every other quota while the people inside the quotas don't match. That's sampling bias hiding behind a correct-looking table.
The 2015 UK general election polls
The polls before the 2015 British general election pointed to a dead heat between Conservatives and Labour. The Conservatives won a clear lead, and the British Polling Council and Market Research Society inquiry chaired by Patrick Sturgis called the 2015 polls "some of the most inaccurate since election polling first began in the UK in 1945."
Its conclusion: "the primary cause of the polling miss in 2015 was unrepresentative samples." The methods "systematically over-represented Labour supporters and under-represented Conservative supporters," and weighting "did not mitigate this basic problem to any notable degree." A late swing explained at most about one percentage point; sampling bias did the rest.
The 2016 US state polls
National polls in 2016 were close: they had Hillary Clinton about 3 points ahead, and she won the popular vote by 2. State polls missed by more, with an average absolute error of 5.1 points, and they named the wrong winner in Pennsylvania, Michigan and Wisconsin, per the AAPOR 2016 election polling evaluation.
Part of the miss was late deciders, roughly 13% of voters in Wisconsin, Florida and Pennsylvania. The other part was the sample. Voters with more formal education leaned to Clinton and were more likely to answer surveys, and many state polls didn't weight for education. AAPOR's verdict: "Adjusting for over-representation of college graduates was critical, but many polls did not do it."
Medicine and psychology
Sampling bias also distorts the perceived effectiveness of medical treatments. Observational studies of postmenopausal hormone therapy suggested heart benefits that the Women's Health Initiative trials didn't confirm. Jacques Rossouw's 2008 review in Clinical Pharmacology & Therapeutics notes that "women who choose hormone therapy are healthier to start with," and puts the observational overestimate of coronary benefit at about 23% to 30% after adjusting for confounders.
Psychology has a frame problem. As much as 80% of study participants come from Western, educated, industrialized, rich and democratic societies that hold only 12% of the world's population, the American Psychological Association's Monitor reported on Joseph Henrich's 2010 work. Findings drawn from that pool get stated as facts about people in general.
Why a bigger sample doesn't fix sampling bias
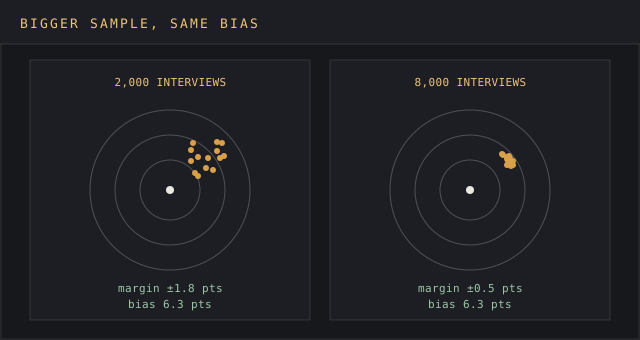
A larger sample size cuts sampling error and leaves systematic bias where it was. The cleanest test comes from Pew Research Center's 2018 study of opt-in online samples: more than 30,000 interviews from three vendors, checked against 24 federal survey benchmarks.
Unweighted, the samples were off by 8.4 points on average. No weighting method brought the average below 6 points. Pew's phrase for the result: estimates "more tightly clustered around the wrong (biased) value."
Growing the sample from 2,000 to 8,000 interviews shrank the margin of error from plus or minus 1.8 points to 0.5 points, and the bias stayed at 6.3 points.
The Literary Digest makes the same point at a larger scale. Its 2.4 million returned ballots were 300 times the 8,000 interviews in Pew's largest test sample, and size did nothing for it. A response count far above a rival's is a red flag until someone checks who sent the responses in.
How to identify sampling bias in a sample you already have
You can identify bias after collecting data by comparing the sample with outside numbers you trust. Four checks cover most of it, and none needs a statistician. A sample has to accurately represent the market on the variables the question depends on, and those are the ones to check. Run the checks during data collection as well as at the end.
First, put the demographic characteristics of the data collected next to a benchmark: census figures for consumers, a firmographic count for business buyers, your own CRM for customers. If a sample is 70% one company size while the market is 30% that size, it has a coverage or selection problem, and you can correctly determine its direction before anyone reads a chart.
Second, keep an eye on the response rate by group. If enterprise accounts answer at 3% and small accounts at 15%, the respondents differ markedly from the frame even when the topline rate looks fine. Third, compare early and late responders; late responders tend to resemble non-responders, so a gap between them signals nonresponse bias.
Fourth, list the sources of bias in the sampling frame itself. Ask who isn't on the list, who was screened out and who had no way to answer. Write the answers into the methods note so the reader sees the limits of the conclusions drawn, the habit data source attribution builds into every figure.
How to avoid sampling bias on a small budget
The cheapest way to prevent sampling bias is to plan for it before collecting data. A small team can't afford a national probability panel, but it can avoid sampling bias at the cheap points in the sampling process. A stitch in time saves nine: each fix costs less before fieldwork than after it. The goal of every step below is a representative sample of the target population.
- Use probability sampling from the fullest frame you own, and drop convenience sampling for any figure you'll quote. Simple random sampling from the whole customer list gives each account an equal chance; random or stratified sampling by segment keeps small groups from vanishing.
- Use stratified sampling when segments differ in size. Set a quota per stratum, then draw at random inside it, which closes the gap that sank the 1948 quota polls.
- Weight the results to known totals. Raking to census or CRM shares is the standard method; Pew found variable choice mattered more than method, with political variables cutting another 1.4 points off bias.
- Follow up with non-responders. A second mode, a shorter form or a small incentive brings back people the first wave missed. Skipping it is where most teams cut corners.
- Fix the sampling plan before data collection. Write down the frame, the selection rule and the inclusion criteria first, a lighter form of the pre-registration academic studies use.
- Run more than one mode. Online plus phone or email plus in-product prompts covers groups each single channel misses.
Traditional methods still set the standard for the draw. A random process, such as a random-number column in the spreadsheet that holds the frame, makes random selection mechanical, and it's the one step a team of two can copy from a national statistics office at no cost.
Weighting has limits. It can't conjure a group that has no respondents at all, so marginalized groups missing from a frame stay missing after weighting, and Pew's best procedure removed only about 30% of the bias in opt-in samples. Weighting corrects a sample that sits close to the benchmark; a sample far off it needs a new frame.
These steps also help reduce bias in secondary market intelligence, where someone else drew the sample. Read the methodology page of any third-party survey before quoting it, and check its frame against the target audience your report covers.
Sampling bias vs response bias, recall bias and observer bias
These are separate sources of bias, and each needs its own fix. Sampling bias decides who answers. Response bias decides how they answer: people give the agreeable or socially acceptable reply, or pick the first option in a list. A perfect random sample can still carry response bias, and a well-worded questionnaire can't fix a skewed sample.
Recall bias is a memory problem; respondents misremember how much they spent or which vendor they evaluated first. Observer bias comes from the researcher, who codes interviews or records behavior through their own expectations. Neither changes who is in the sample, so neither counts as sampling bias.
Medical research uses one more name. A version called ascertainment bias appears when some cases are more likely to be detected or recorded than others, so the sample of known cases leans toward the easy-to-find ones. It's a cousin of undercoverage, applied to diagnosis.
Keep the labels separate in a methods note. Calling every problem bias hides which fix applies, and the reader of a market intelligence strategy needs to know which numbers the team trusts and why.
FAQ
What is meant by sampling bias?
Sampling bias means the sample differs from the population in a consistent direction because some members had a higher chance of selection or response. Sampling bias lies in how people were chosen; the wording of their answers is a separate problem.
What is an example of biased sampling?
The 1936 Literary Digest poll is the classic biased sampling method case: 2.4 million mailed-back ballots forecast a Landon win, and Roosevelt took about 61% of the vote. A modern example is a feature survey sent to power users alone, where a random sample of all accounts would have reached casual users too.
What is the difference between sampling bias and selection bias?
Selection bias is the wider term for any distortion in who enters a study or an analysis. Sampling bias is the survey-stage version: the frame, the draw and the response.
What is sampling bias in psychology?
In psychology it usually means drawing conclusions about people in general from narrow pools drawn mostly from Western, educated, industrialized, rich and democratic societies. The APA reported that up to 80% of study participants come from societies holding 12% of the world's population.
Does a larger sample size reduce sampling bias?
No. Pew's 2018 test kept 6.3 points of average bias at both 2,000 and 8,000 interviews while the margin of error fell from 1.8 to 0.5 points.
Is informed consent a source of sampling bias?
It can be. Informed consent is required, and people who decline to take part form a non-response group, so a study should record how many declined and compare them on what it knows.
Bottom line
A survey can only speak for the people it reached, and sampling bias decides who those people are. The Literary Digest, the 1948 quota polls, the 2015 UK polls and the 2016 state polls all had large samples and competent arithmetic; each failed at the frame, the draw or the response, and the error showed up only when the real result arrived.
Market research rarely gets that election-night check, so a biased sample can steer pricing, sizing and product calls for a year before anyone notices. To avoid sampling bias, compare the sample with a benchmark, track who didn't answer, and draw at random from the fullest frame you own.
If the benchmark check fails, it's back to the drawing board on the frame, which costs a few days against a year of decisions built on the wrong people.
Once the right people are in the sample, the next problem is what they say. Response bias, where honest respondents still give skewed answers, is the following lesson in this path.