Response bias: why survey answers drift in one direction
 By Jan Suski. I go deep on every review, checking every number against its source and digging up details other coverage misses, a habit from six years of SEO and link building for tech companies. Bylines at Surfer, Brand24, and Senuto. How the scoring works.
The short version 12 points · 50 seconds
- 01Response bias pushes every answer the same wayRandom noise cancels, this error stays
- 0210,000 biased answers land where 500 didOnly the confidence interval narrows
- 03It acts on answers from people already sampledReweighting the sample leaves it intact
- 04Acquiescence adds about 10 points of agreement52% agreed, 42% disagreed with the reverse
- 0522% of respondents agreed with a statement and its reverseNay-saying runs the other way, at 10%
- 06Question order alone moved a Pew result by 8 points45% or 37% on one item in October 2003
- 07Naming casualties cut Iraq support from 68% to 43%Pew, January 2003, one added clause
- 08Live phone interviews hid a low GPA 83.3% of the timeThe web cut the miss rate to 61.5%
- 09Standard depression interviews undercounted older patientsSymptoms got blamed on physical illness
- 10Forced-choice wording beats agree-disagree scales14% more agreed than chose the same view
- 11A don’t-know option raised non-answers to 15%With no gain in measured accuracy
- 12Reversed pairs, split ballots and records catch itEach test targets a different bias type
Response bias is any tendency in how people answer a survey that pushes their answers away from the truth in a predictable direction. A customer who rates a vendor 9 out of 10 to be polite and a buyer who agrees with every statement on the page both add error that points the same way.
This lesson covers the named types of response bias, how far each one moved a number in published experiments, and the question wording that reduces it. It's for market researchers, product marketers and analysts who write survey questions or buy research built on them. It matters to them because a biased survey feeds every pricing, positioning and segmentation decision downstream, and the error never shows up in the margin of error.
It follows the lesson on sampling bias, which covers who ends up in a survey, and picks up at the moment the people in it start answering. If question formats are new, the overview of market research methods comes first.
What response bias is, and why a large sample doesn't cancel it
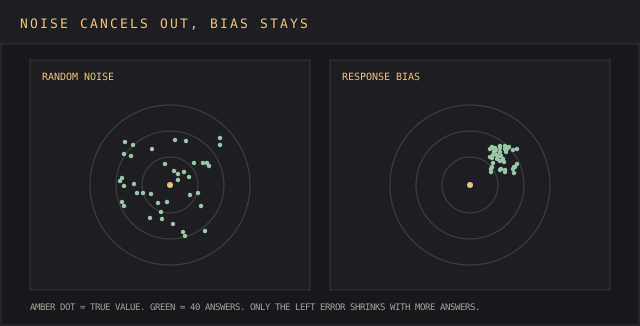
Response bias is systematic error: a nonrandom deviation of reported answers from their true value, introduced while respondents answer. It's a systematic error in the measurement itself. SAGE Publications gives it a separate entry in the 2008 Encyclopedia of Survey Research Methods, edited by Paul J. Lavrakas.
Random noise scatters answers on both sides of the truth, so it shrinks as the sample grows. Response bias moves observed units in the same direction. It doesn't shrink at all, because a systematic error pushes the 10,000th answer the same direction as the first.
An illustration makes the gap visible. Picture collecting height data by asking 500 adults how tall they are. Some round up an inch and some round down, and those slips roughly cancel. Now suppose most of them round up because tall reads as attractive. Ask 10,000 people the same question and the height data comes back just as inflated, with a tighter confidence interval drawn around the wrong number.
Such circumstances lead to a final outcome that looks precise and misses the true population parameter by the same margin however many people answer. That's a bitter pill to swallow for a team that paid for 2,000 completes. Survey research methods treat response bias as a design problem for that reason: a statistician can widen error bars for noise, and no formula recovers a bias nobody measured.
Response bias vs sampling bias and nonresponse bias
Three biases get mixed up in AP Statistics classes and in vendor decks. Sampling bias comes from the frame: a web panel of 2,000 people can't speak for buyers who never go online. Nonresponse bias comes from people who were invited, declined, and differ from those who replied. Response bias comes from the answers of people who are in the sample and did reply.
The fixes differ, which is why the labels matter. Weighting can correct a sample with too few respondents over 55, as long as secondary data such as census figures gives the true age mix. Weighting can't correct a sample where every age group overstates usage by the same margin, because the error sits inside every cell, so reweighting it is barking up the wrong tree.
Types of response bias
The types of response bias below share one trait: each moves survey responses in a direction the researcher can predict once the cause is named. Bias occurs at a specific step, while the respondent reads the question, recalls the answer or decides what to report, and the fix targets that step.
Some of it starts as a cognitive bias, such as memory leaning toward vivid events. Some is an inherent bias of the instrument, built into how a question is worded or ordered, and external factors such as an interviewer add to it, along with other factors like survey length.
Acquiescence bias
Acquiescence bias is the tendency to agree with a statement regardless of what it says. Jon Krosnick and Stanley Presser's chapter in the Handbook of Survey Research (2nd edition, Emerald, 2010) collects the evidence in a standard reference on survey research methods. Averaging across 10 studies, 52% of people agreed with an assertion, while only 42% disagreed with the opposite assertion.
The same chapter found that 22% of respondents agreed with both a statement and its reversal. A person who agrees that individuals are mainly to blame for crime, and also that social conditions are mainly to blame, has produced contradictory statements. Neither answer tells you what they think.
Krosnick and Presser put the acquiescence effect at about 10% on average. Their advice covers the true false test format familiar from educational psychology as well: drop agree-disagree, true-false and yes-no questions altogether.
Pew Research Center adds that less educated and less informed respondents agree more often, and that the effect grows when an interviewer is present. Any scale that asks a customer to agree with a string of positive statements about a product invites a positive response by default, including the attitude batteries behind most psychographic segmentation studies.
Dissent bias
Dissent bias, also called nay-saying, runs the other way: the respondent disagrees with a given statement regardless of content. In the same Krosnick and Presser review, 10% of respondents disagreed with both a statement and its reversal, against the 22% who agreed with both.
Social desirability bias
Social desirability bias pushes answers toward whatever looks good. The GESIS survey guidelines by Kathrin Bogner and Uta Landrock (2016) define it as the tendency of respondents to give predominantly positive self-descriptions. A socially desirable response is the one the respondent expects the asker to approve of.
An answer straight from the horse's mouth still passes through the horse's self-image, and Pew lists the usual targets. Respondents overstate church attendance, charitable contributions and the likelihood that they'll vote, and they understate alcohol and drug use, tax evasion and racial bias. Over reporting the good and under reporting the bad are two sides of one habit.
Anonymity helps people answer honestly on sensitive questions: GESIS lists the randomised response technique and the item count technique, which hide each person's answer so a truthful response carries no social cost.
Extreme responding
Extreme responding is the habit of picking the end points of a rating scale, strongly agree or strongly disagree, 1 or 10, irrespective of question content. Bogner and Landrock call it the extreme response style. It stretches the spread of a rating and makes two customer groups look further apart than they are.
Because it's a habit of the person, it shows up across unrelated questions. That's also how it's caught: count the share of end-point answers each respondent gives, and the extreme responders stand out from the individual differences around them.
Question order bias
Earlier questions influence survey responses on a particular issue that comes later. In an October 2003 Pew survey, 45% favored legal agreements for same-sex couples when the question followed one about marriage, against 37% without that context. In December 2008, 88% said they were dissatisfied with the country's direction after a question about the president, against 78% without it.
Demand characteristics
Martin Orne named demand characteristics in a 1962 paper in American Psychologist: study participants pick up cues about what a study wants and adjust their behavior to match.
The idea came out of behavioral research on lab experiments, and in market research the cue is often the sponsor's logo on the invitation. A market researcher conducting research for one brand who names the research topic and the sponsor in the subject line has told every respondent which brand is supposed to win.
Courtesy bias and recall bias
Courtesy bias is underreporting dissatisfaction to be polite, and structured interviews run by a vendor's own staff invite it. A customer interviewed by the account manager who sold them the contract has every reason to soften a complaint, so the negative feedback stays under the radar until renewal.
Recall bias comes from memory. Asked how many vendor demos they sat through last year, respondents reconstruct a number that leans toward the demos that stood out. Asking about a recent, specific window, such as the last 30 days, gives them less to rebuild.
How far response bias moves a number
Published experiments put sizes on these effects, and the sizes are large enough to flip a business decision. Pew's January 2003 test on Iraq is the cleanest. Asked about military action plainly, 68% were in favor. Asked again with the phrase "even if it meant that U.S. forces might suffer thousands of casualties," support fell to 43% and 48% opposed.
Answer format moves results too. A 2019 Pew methods study of 4,581 U.S. adults compared a select-all-that-apply list with separate yes/no items. The forced-choice version found 8 percentage points more bad experiences on average. Being overcharged by a mechanic or home repairman read 52% under forced choice and 36% under select-all, a 16-point gap on one item.
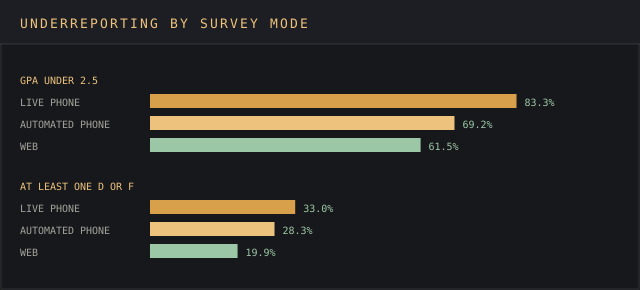
Survey mode moves the answers to sensitive questions most. Frauke Kreuter, Stanley Presser and Roger Tourangeau checked graduates' answers against the true value in university records in Public Opinion Quarterly in 2008. For a GPA under 2.5, 83.3% failed to report it to a live phone interviewer, 69.2% to an automated voice system and 61.5% on the web. For at least one D or F grade, the misses ran 33.0%, 28.3% and 19.9%.
Bias doesn't only shift averages. Bogner and Landrock note that balancing a scale cancels acquiescence in the scale mean but leaves correlations and factor structures distorted. Two attitudes can look linked when the only thing linking them is the habit of agreeing. A market segmentation built on those correlations is inaccurate data that passes every statistical test.
Response bias outside market research
The same mechanism turns up in psychiatric research, where the stakes are a diagnosis. Bärbel Knäuper and Hans-Ulrich Wittchen examined diagnosing major depression in the elderly in the Journal of Psychiatric Research in 1994. Their empirical investigation asked if standardized diagnostic interviews, which are structured interviews read word for word, carry a response bias against older respondents.
Using the Diagnostic Interview Schedule on 481 people from the Munich Follow-up Study, plus a 63-person laboratory study, they found older respondents reported lifetime depressive symptoms as often as younger ones. The older group more often attributed those symptoms to physical illness, and the interview rules then excluded them.
Prevalence estimates for major depression in people over 65 came out low for a reason that had nothing to do with mental health. Self report measures in clinical psychology and in market research share the weakness: the instrument records what the person decides to report, about major depression or about software usage.
How to reduce response bias in a questionnaire
Most ways to avoid response bias sit in the wording and the fieldwork, before a single answer comes back, so accurate results get decided during data collection. A stitch in time saves nine here, since nothing recovers a biased answer after the fact. The table maps each type to the fix with published evidence behind it.
| Bias | Fix | Evidence |
|---|---|---|
| Acquiescence bias | Offer a choice between two statements; drop agree-disagree, true-false and yes-no formats | Krosnick and Presser 2010; Pew |
| Dissent bias | Balance positive and negative keying, half the items each way | GESIS, Bogner and Landrock 2016 |
| Social desirability bias | Self-administered web mode, anonymity, randomised response or item count technique | Kreuter, Presser and Tourangeau 2008; GESIS |
| Question order bias | Rotate question order in a split ballot | GESIS; Pew random assignment |
| Response order effects | Rotate answer lists so each option appears at the top and bottom | GESIS; Krosnick and Presser |
| Courtesy bias and demand characteristics | Third-party fieldwork, no sponsor logo on the invitation | Orne 1962 |
| Recall bias | Ask about a short, recent, specific window | Survey design practice |
Forced choice is the single largest lever on acquiescence: Krosnick and Presser found 14% more people agreed with an assertion than picked the same view when offered two alternatives. Pew offers respondents a choice between alternative statements as its standard.
Visual presentation matters for list order. Krosnick and Presser report primacy effects when options are read on screen and recency effects in nearly all studies where options are read aloud, so a list that works on the web can tilt the other way on the phone. Neutral wording and balanced response options keep a survey question from steering, and Pew's Iraq numbers show what one loaded clause costs.
A "don't know" option is the fix that doesn't hold up. In one study Krosnick and Presser cite, by Gilljam and Granberg (1993), 15% chose "don't know" when it was offered, against 3% and 4% non-substantive answers on later versions without it. Their reading of the wider evidence is that DK filters don't improve measurement, so on accuracy the option misses the mark.
Survey length belongs on the list because satisficing does. Bogner and Landrock name task difficulty, cognitive ability and motivation as its three determinants. A 40-minute questionnaire drains motivation, and the last 10 minutes fill with straight lines of identical answers. Cutting questions and varying the format between blocks are the cheapest ways to avoid bias in the back half.
How to detect response bias in data you already have
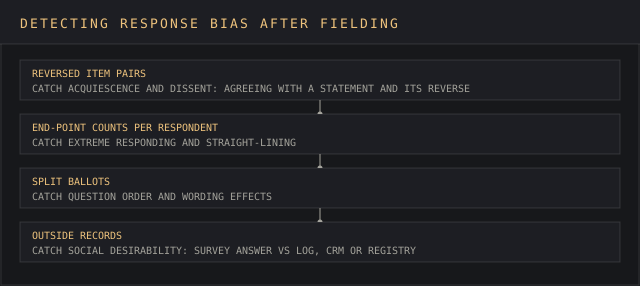
Most checks work on survey data after data collection ends, and where the bias occurs determines the check. The devil's in the details: per-respondent patterns that an average hides.
Reversed item pairs are the first check. If 22% of a sample agrees with a statement and its reversal, the agreement figures on that battery are inflated, and internal consistency scores, a standard reliability check, will look better than the attitudes justify. End-point counts per respondent catch extreme responding, and long runs of the same answer catch straight-lining.
A split ballot is the strongest test. Randomly assign two wordings or two orders to halves of the sample, as Pew does, and any difference between the halves is the wording's effect on the same topic.
Outside records are the final check, a form of data triangulation, and they're how Kreuter and colleagues measured the bias at all. In B2B research the equivalent is comparing a self report of usage with product logs or CRM records, which a customer intelligence framework already holds.
If a survey says most users open a report weekly and the logs disagree, the survey has a red flag that no weighting will remove. Building that comparison into market intelligence analysis is what keeps biased survey data out of the decisions it feeds.
FAQ
What is an example of a response bias?
A customer satisfaction survey run by the account team is the everyday example. Respondents soften complaints to stay polite to the person who'll read them, and the scores come back higher than renewal rates justify. Pew's documented cases include voters overstating their likelihood to vote and respondents understating alcohol consumption.
What is the response bias explanation in plain terms?
People read the question, recall information, judge it and decide what to say, and each step can push the answer away from its true value. Response bias is the sum of those pushes when they point in the same direction across respondents.
What is response bias in AP Stats?
AP Statistics teaches response bias as one of the problems with collecting data from a sample, alongside undercoverage, nonresponse and voluntary response bias. The course definition matches the research one: the question or the setting leads people to provide inaccurate responses.
What is the difference between sampling bias and response bias?
Sampling bias comes from who ends up in the sample, such as a web panel standing in for people who don't go online. Response bias comes from how sampled people answer.
Can a larger sample size fix response bias?
No. More respondents shrink chance error, and response bias moves every answer the same way, so 10,000 respondents return the same wrong estimate as 500 with a narrower confidence interval.
Does a "don't know" option reduce inaccurate answers?
The evidence Krosnick and Presser review says it doesn't. Offering the option raised non-substantive answers from 3 or 4% to 15% in one study, without making the remaining answers more accurate.
Bottom line
Response bias is error that points one way, so it survives any sample size and hides inside a tidy confidence interval. Acquiescence, social desirability, order and format effects moved published results by 8 to 25 points, and mode alone changed how often people hid a bad grade from 83.3% to 61.5%.
The fixes for survey bias are cheap when they nip the problem in the bud, before data collection starts: forced-choice wording, balanced keying, self-administered modes, rotated orders and short recall windows.
Skip them and the survey still produces a number, a precise one, that sends a pricing or positioning decision in the direction the questionnaire pushed it. For a price survey that sits on top of this problem, the Van Westendorp price sensitivity meter shows how four questions turn answers into a price range, and every one of those answers carries the biases above.