Van Westendorp price sensitivity meter: the four questions and how to read them
 By Jan Suski. I go deep on every review, checking every number against its source and digging up details other coverage misses, a habit from six years of SEO and link building for tech companies. Bylines at Surfer, Brand24, and Senuto. How the scoring works.
The short version 10 points · 40 seconds
- 01Four price questions produce an acceptable price rangePresented at the 1976 ESOMAR Congress
- 02The answers are open numbers asked in a fixed orderAnswers out of order get dropped first
- 03Each question becomes one cumulative curveTwo curves get flipped before plotting
- 04Four crossings: PMC, OPP, IPP and PMEPMC and PME bound the acceptable range
- 05Two range definitions circulate, and vendors mix them$20 to $50 or $30 to $35 on one dataset
- 06A 20-person sample moves the curves in 5% stepsOne respondent shifts a crossing by dollars
- 07Plan for 200 to 300 completes, 100 per segmentGuidance from Conjointly and Qualtrics
- 08Two extra questions add a rough revenue curveNewton, Miller and Smith, 1993
- 09Known prices, bundles and absent rivals skew itStated willingness to pay drifts from sales
- 10Pair it with Gabor-Granger or conjoint analysisA demand curve, or price against features
The Van Westendorp price sensitivity meter is a survey method that asks consumers four questions about price and reads the answers as a range of acceptable prices for one product. It measures customer price perceptions directly, with no sales history needed, which matters most before a launch or a pricing strategy change, when there are no sales to analyze yet.
This lesson is for product managers, founders and pricing analysts who need a defensible price range for a new product or tier. By the end you'll know the four Van Westendorp questions, how to read the price map, why vendors' charts disagree on the same data, how many respondents Van Westendorp surveys need, and where the Van Westendorp pricing model stops being trustworthy.
It assumes you've read the previous lesson on pricing intelligence and competitor price monitoring, which covers the outside view: what rivals charge. This page covers the inside view, what your own target market thinks a fair price is.
What the Van Westendorp price sensitivity meter measures
The method measures price perception, the range a target audience regards as believable for a product it hasn't bought yet, and it runs on consumer perceptions with no historical sales data. Dutch economist Peter van Westendorp presented it as the "NSS-Price Sensitivity Meter (PSM)" at the 29th ESOMAR Congress in 1976, in a paper that runs pages 139 to 167 of the proceedings, according to the reference list of the pricesensitivitymeter R package.
ESOMAR's own Research World author page calls that Congress paper frequently requested and describes van Westendorp as a researcher best known for the "pricemeter." Fifty years on, the method is still a market research industry standard: Qualtrics, SurveyMonkey, Sawtooth Software, Conjointly and OpinionX all sell a packaged version.
A Van Westendorp survey needs four questions and a spreadsheet, and the Van Westendorp analysis is counting, with no market research data beyond the answers themselves. That's also the limit: what people say they'd pay and what they hand over at checkout are two different numbers, and talk is cheap.
The four Van Westendorp questions
Every version of the Van Westendorp price sensitivity meter uses the same four questions, asked after the respondent reads a description of the product concept. Sawtooth Software's guide, last updated 5 March 2024, words them like this:
- Too cheap: "At what price would you consider the product to be so inexpensive that you would feel the quality couldn't be very good?"
- Cheap, a bargain or good value: "At what price would you consider the product to be priced so low that you would feel it's a bargain?"
- Expensive: "At what price would you say the product is starting to get expensive, but you still might consider it?"
- Too expensive: "At what price would you consider the product to be so expensive that you would not consider buying it?"
SurveyMonkey's version rewords the second question as "a bargain, a great buy for the money," and the meaning holds. Each answer is an open number the respondent types, never a pick from a list of specific prices, because a list would anchor the answer.
The four answers have to climb. A respondent's too-cheap price must sit below their bargain price, which sits below expensive, which sits below too expensive. The pricesensitivitymeter package drops any respondent who breaks that order by default and reports the count as invalid cases. In an unscreened panel, answers like "too cheap at $50, a bargain at $20" are par for the course.
How four curves turn answers into a price map
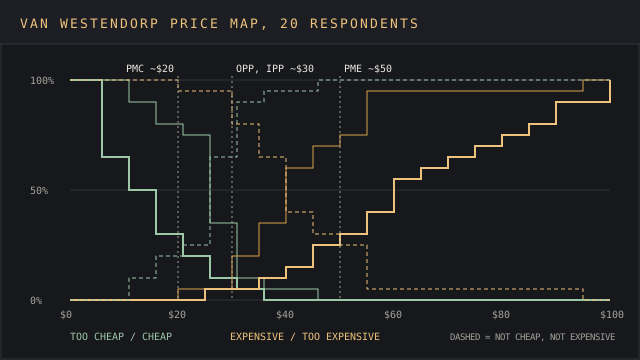
Each question becomes one cumulative frequency curve of consumer price perceptions across the price spectrum. At any given price, the too-cheap curve shows the share who named that price or higher as too cheap, so it starts near 100% at $0 and falls to zero where customers begin to trust quality. The bargain curve falls too. Expensive and too expensive rise as the price climbs; the expensive curve marks where a price starts to feel expensive.
Two of the four lines then get flipped. "Not cheap" is 100% minus the bargain curve, and "not expensive" is 100% minus the expensive curve. The original 1976 method reads its boundaries off those inverted lines.
Plot all six lines on one chart and you have the price map, a picture of how customers perceive each price. The intersection points are the outputs, and each one marks a price where two groups of opinion balance.
The four price points on the chart
Four crossings carry names. Two of them bound the acceptable range of prices, and two sit inside it.
Point of marginal cheapness
The point of marginal cheapness (PMC) is the lower boundary of the range of acceptable prices. Under the original definition it's where the too-cheap curve crosses "not cheap." Below it, more consumers read the low price as a red flag about quality than read it as a good deal, so cutting further loses more sales to doubt than it wins from deal-seekers.
Optimal price point
Too cheap meets too expensive at the optimal price point (OPP): the optimal price at which the fewest respondents reject the product on either extreme. The name oversells it. The OPP minimizes rejection; to maximize profits you'd also need costs and volume, two inputs the four questions never collect. Treat it as the ideal price on perception alone, the sweet spot for acceptance.
Indifference price point
The indifference price point (IPP) is where the cheap and expensive curves cross, the price as many consumers call good value as call expensive. Many guides describe it as the median perception, the price the market treats as normal for the product category. Read between the lines of the two: a gap between the IPP and the OPP shows which way opinion leans.
Point of marginal expensiveness
The point of marginal expensiveness (PME) is the upper limit of the range of acceptable prices. Under the original definition it's where the too-expensive curve crosses "not expensive." Above it, the share of consumers who'd refuse to buy outruns the share who'd still consider the product's price. The range of acceptable prices is the interval between the PMC and the PME.
Two definitions of the acceptable price range
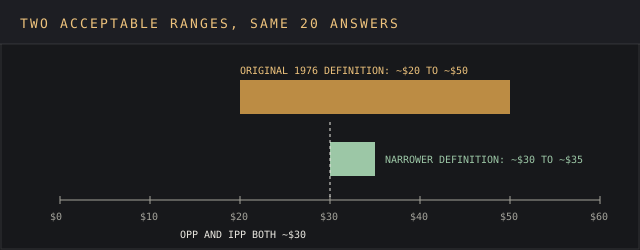
The devil's in the details here, and it's the reason two vendors can run the same Van Westendorp model on one dataset and report different ranges of acceptable prices. The pricesensitivitymeter package, version 1.3.3, published on CRAN on 30 August 2025 by Max Alletsee, documents two definitions for each boundary and lets the analyst pick one.
| Output | Original 1976 definition | "Narrower" definition |
|---|---|---|
| Point of marginal cheapness | Too cheap crosses not cheap | Too cheap crosses expensive |
| Point of marginal expensiveness | Too expensive crosses not expensive | Too expensive crosses cheap |
| Optimal price point | Too cheap crosses too expensive | Same |
| Indifference price point | Cheap crosses expensive | Same |
| Acceptable price range | PMC to PME, wider | PMC to PME, tighter |
The two definitions agree on the OPP and IPP and disagree on the upper and lower limits, and vendors split on them. OpinionX's guide uses the narrower version at both ends: too cheap against acceptably expensive for the floor, acceptably cheap against too expensive for the ceiling. SurveyMonkey's page reads the floor the original way, from the inverse of the bargain curve, and the ceiling the narrower way, from the bargain and too-expensive lines.
Sawtooth Software's guide goes further and says the line-crossing methodology lacks rigor, because its named points weren't derived from economic theory. Before comparing two Van Westendorp results, or two sets of acceptable prices from different teams, ask which definition each one used; if nobody can say, the range comparison means nothing.
A worked example with 20 respondents
Here's the Van Westendorp method run end to end on a hypothetical dataset: 20 made-up respondents pricing a monthly add-on for a software product, in dollars. The numbers are invented to show the arithmetic; the procedure is the Van Westendorp pricing model as the R package implements it, at a $1 price step.
The medians of the four answers came out at $12.50 for too cheap, $25 for a bargain, $40 for expensive and $60 for too expensive. At $30, 10% of respondents still called the price too cheap, 35% called it a bargain, 20% called it expensive and 5% called it too expensive.
Reading the crossings gives an optimal price point, the ideal price on perception, near $30 and an indifference price point near $30 as well. The original definition puts the acceptable range at about $20 to $50. The narrower one puts it at about $30 to $35.
The same 20 people produce a $30-wide range under one rulebook and a $5-wide range under the other.
Twenty respondents is far too few for a real decision, and the chart shows why. Every person is worth 5 percentage points, so the curves move in stair steps, two lines can cross between steps, and a single respondent shifts a crossing by several dollars. A pricing study built on that would miss the mark by more than the gap it's trying to measure, and it's back to the drawing board with a bigger sample.
How to run a Van Westendorp study
Survey tools run the analysis; the study design is your job, in five steps:
- Write the product concept: what the product does, who it's for and which product features are included, in the words a buyer would see. A vague concept produces vague price expectations.
- Screen for the target market. SurveyMonkey's guide says data from respondents unfamiliar with the category is less useful and recommends a known, highly targeted audience.
- Size the sample for Van Westendorp surveys. Conjointly's guidance sets at least 200 responses in total and at least 100 within each segment; Qualtrics' Van Westendorp study says a typical project needs 300 completes.
- Ask the questions in order, as open numeric fields, then the two purchase-likelihood questions if you're running the extension.
- Clean the survey data by dropping intransitive answers, then run the Van Westendorp analysis by segment.
Segment cuts are where the method earns its keep, because they show how sensitive customers in each group are. A range that holds for the whole sample can hide one group of price-sensitive customers with a ceiling $20 lower than everyone else's. The lessons on market segmentation cover how to define those groups before fieldwork.
Respondent quality is the other lever. The same discipline that sizes a brand research tracker to its margin of error applies here: recruit potential customers in the category, since a panel that's never bought in it returns pie-in-the-sky numbers at both ends.
The Newton-Miller-Smith extension: adding purchase likelihood
Van Westendorp's base method reports which reasonable prices buyers will accept, with no estimate of how many would buy at each one. Newton, Miller and Smith closed that gap in 1993 with "A market acceptance extension to traditional price sensitivity measurement," presented at the American Marketing Association's Advanced Research Techniques Forum.
The extension adds two questions. Each respondent rates, on a five-point scale, how likely they'd be to buy at their own bargain price and at their own expensive price. Sawtooth's guide gives example weights of 75% for "definitely would buy," 25% for "probably would buy" and 10% for "might or might not" to convert those ratings into purchase likelihood.
Under the traditional extension, likelihood is 0% at the too-cheap and too-expensive prices, and the model interpolates in a straight line between the points. Sum that across respondents and you get a trial curve across multiple price points; multiply by price and you get a rough revenue curve. Sawtooth's authors call the 0% at the too-cheap end unrealistic, since it pushes the revenue-maximizing price higher.
Sawtooth's question library ships the four questions and the two Newton-Miller-Smith questions as one downloadable block. If the study has to inform a pricing strategy with a revenue target, run the extension; without it the meter can't speak to sales volume at all.
Where the Van Westendorp method misleads
Three failure modes recur in vendor documentation, and each has a fix. The first is missing competitive context. Respondents price the product in isolation, as if no $40 rival sat on the next shelf. Sawtooth lists it among the method's limitations.
The second is an established product with a known price. Buyers who know a product sells at $49 have a number to anchor on, and their four answers report that anchor back. The method works best on a new product or a new tier. An existing product is better served by testing real price increases on a slice of customers.
The third is stated preference itself. A 2011 Journal of Marketing Research study (volume 48, issue 1, pages 172 to 184) compared four willingness-to-pay methods against real purchase data. It found open-ended questions showed hypothetical bias, though they could still produce the right demand curves and pricing decisions; two incentive-aligned methods passed its statistical tests. Van Westendorp's four questions are open-ended direct questions of that kind.
Small samples add a fourth problem. OpinionX co-founder Daniel Kyne writes that the too-cheap and too-expensive lines aren't guaranteed to cross, and that studies with few participants are more likely to show no crossing at all. His guide also limits the method to a single product or feature shown in isolation and sends bundles and multi-feature tiers to conjoint analysis. Read his advice knowing OpinionX sells the tool his guide demonstrates.
Van Westendorp vs other pricing research methods
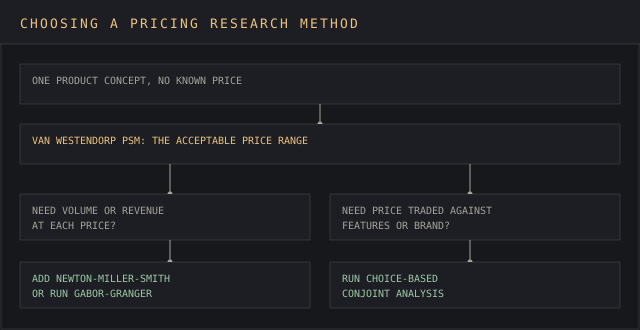
Van Westendorp is one of three survey-based pricing strategy techniques, each answers a different question, and the meter works best paired with at least one other pricing analysis. Putting all your eggs in one basket is the classic error, and the vendors that sell the meter offer the alternatives on the same platforms: Sawtooth sells conjoint, SurveyMonkey publishes a Gabor-Granger guide, and OpinionX runs both.
Gabor-Granger shows respondents specific prices one at a time and asks if they'd buy at each, which returns a demand curve and a revenue-maximizing price directly. It's the faster route to zero in on a single optimal price point once the Van Westendorp range has narrowed the options.
Conjoint analysis makes respondents choose between profiles that vary price, features and brand together, capturing trade-offs a four-question survey can't see. Sawtooth's question library names choice-based and adaptive choice-based conjoint as its preferred techniques for measuring price sensitivity. The conjoint analysis tools ranking compares the platforms that run both kinds of study, and several of them bundle Van Westendorp and Gabor-Granger alongside.
Price elasticity sits one level up, measuring customers' price sensitivity from real sales, so it's the check on whatever a survey predicted. When you raise prices, your own sales tell you if the Van Westendorp study was right. Informed pricing decisions use both: a pricing study for the range, live price changes to confirm it.
FAQ
What is the Van Westendorp price sensitivity meter (PSM)?
It's a four-question survey method, presented by Peter van Westendorp in 1976, that asks consumers at what prices a product or service feels too cheap, a bargain, expensive and too expensive. The cumulative answers produce an acceptable price range and an optimal price point from consumer price perceptions alone.
How do you calculate price sensitivity with Van Westendorp?
Plot the share of respondents choosing each answer at every price as four cumulative curves, invert the cheap and expensive curves, and read the prices where the curves intersect. The R package pricesensitivitymeter and most pricing research survey tools do this automatically.
Is price sensitivity the same as price elasticity?
They're related. Price sensitivity describes how strongly consumers react to price, often measured by survey. Price elasticity is a specific number: the percentage change in quantity demanded for a 1% change in price, usually estimated from sales data after price changes.
Can you give an example of price sensitivity?
In the hypothetical 20-respondent example above, 5% of buyers called a $30 add-on too expensive and 30% said the same at $50.
What is another term for price sensitivity?
Willingness to pay is the closest term in pricing research, and "reasonable prices" is the plain-English version of what the meter outputs.
How many respondents do Van Westendorp surveys need?
Conjointly recommends at least 200 responses in total and 100 per segment for a price sensitivity meter study. Qualtrics cites 300 completes as typical. Fewer than that and single respondents move the crossings by whole dollars.
Bottom line
The Van Westendorp price sensitivity meter is the market research industry's quick and dirty way to identify the range of prices a target market will take seriously: four questions, a few hundred respondents, a chart. It's strongest on a new product with no price yet, and weakest wherever buyers already have a number or a rival in mind.
Get the definitions wrong and the study misleads before anyone reads the chart. A range from the narrower curves is a fraction of one from the original, and a pricing strategy built on the wrong one sets a ceiling too low or a floor too high. For informed pricing decisions, record which Van Westendorp price sensitivity definition you used, add the two extra questions when revenue matters, run Van Westendorp surveys by segment, and check the result against real sales.
The next step in this path is turning a price into a position. The positioning statement template puts the price you've tested next to the claim that justifies it.