Brand research: how to measure what an audience knows and feels about a brand
 By Jan Suski. I go deep on every review, checking every number against its source and digging up details other coverage misses, a habit from six years of SEO and link building for tech companies. Bylines at Surfer, Brand24, and Senuto. How the scoring works.
The short version 12 points · 50 seconds
- 01Brand research measures one name against named rivalsKeller splits it into awareness and image
- 02Awareness gets asked as recall first, recognition secondA list shown early contaminates recall
- 03Brand research is market research aimed at one nameThe output is a perception score
- 04Focus groups and interviews find the words buyers useThose words become the survey items
- 05Surveys size perception, and sample size sets precision1,067 respondents give a 3-point margin
- 06A 3-point move between two waves can be pure noisePew's example carries an 8-point margin
- 07Google's Brand Lift starts at $5,000 over 10 daysOne question, cheapest country group
- 08Reviews and social posts capture unprompted opinion97% of US consumers read local reviews
- 09Google Trends is free context that can't explain a moveScaled 0 to 100 against all searches
- 10Perceptual maps show the gaps worth positioning intoEmpty quadrants mark positions no rival holds
- 11Cracker Barrel switched back to its old logo in 2025Its outlook forecast a 4% to 7% traffic drop
- 12Brand metrics earn budget when they predict revenueTie each wave to share, price and retention
Brand research is the set of methods companies use to understand what their target audience knows about a brand, what it associates with the name, and how those answers compare with competitors. It runs on the same toolkit as wider market research (focus groups, interviews, surveys, social listening), pointed at one subject: what the name means to existing and potential customers.
This guide covers which brand research methods answer which question, how big a sample has to be before a number is worth reporting, and how to tie brand data to revenue and brand strategy. It's written for marketing teams, founders, organizations hiring an agency and any brand strategist preparing a client brief, and every figure links to its source.
What brand research measures

The academic research behind most brand trackers traces to one paper. Kevin Lane Keller's Conceptualizing, Measuring, and Managing Customer-Based Brand Equity (Journal of Marketing, January 1993) defines equity as "the differential effect of brand knowledge on consumer response" and splits brand knowledge into brand awareness and brand image.
To understand awareness, Keller splits it again. Recall is retrieving the brand when given only the category; recognition is confirming it when shown the name. The devil's in the details: surveys ask recall first, because a list shown early contaminates every unaided answer after it.
The American Marketing Association defines a brand as "any distinctive feature like a name, term, design, or symbol that identifies goods or services." Most people asked for the key brand metrics would name awareness first; the full set most trackers report follows from the definition:
- Unaided awareness: the share naming the brand without a prompt.
- Aided awareness: the share recognizing it from a list or logo.
- Brand image: the attributes customers attach to the name, and how strongly.
- Consideration and preference: would they shortlist it over the competition.
- Loyalty: repeat intent among current customers and willingness to recommend.
- Commercial outcomes: market share, price premium and retention.
Equity sits on top of those numbers. In Keller's terms, a brand has positive equity when customers hold favorable, strong and unique associations with it, which shows up as a better response to its marketing than to the same offer from an unnamed product.
Where brand research sits inside market research
Brand market research narrows market research to a single subject. A market study sizes a category and its buyers from sales and survey data, using the toolkit in the market research methods guide. A brand study takes the category as given and tries to understand what one name means inside it.
The key difference shows up in the output. A brand study ends with perception scores, a ranked list of associations and a map of rivals, which feeds brand positioning, brand identity and brand strategy work. Companies also run it for years, where market research is often a one-off; market intelligence vs market research explains that split.
Creating a written plan keeps the brand strategist and the client on the same page. Even a small branding exercise, such as a logo refresh, needs a before and after reading to determine what the change did.
Qualitative research: finding what buyers associate with the name
Qualitative research develops the questions before anyone counts anything. Focus groups put a small group of potential customers in a room with a moderator and stimuli: logos, packaging, ads, rival names. In-depth interviews do the same one person at a time, with more depth on each answer, which suits B2B buyers and customers whose opinion would shift in front of peers.
The output is vocabulary, ideas and early insights. When interviews keep producing the same descriptions, such as dependable but expensive, those become the items the survey scores. Qualitative research identifies the core issues and themes in brand perception; it takes survey data to say how common they are.
The brand image analysis process starts here. A moderator asks what comes to mind with the name, then probes each association on Keller's three dimensions: strength, favorability and uniqueness. Good moderators read between the lines and follow up on associations a participant mentions only in passing.
Emotional attachment analysis belongs here too. Laddering questions move from a product feature to the feeling behind it, which is where customer loyalty forms. Focus groups surface the group perspective on those feelings, and interviews surface the private one, so a research team can understand both the brand experience and the reasons behind it.
Quantitative research: sizing perception with surveys
Quantitative research turns the qualitative insights into a closed questionnaire and puts it in front of a sample big enough to count. Online surveys made this cheap for marketing departments: BrightLocal's 2026 consumer survey, for example, reached 1,002 US adults through a SurveyMonkey panel.
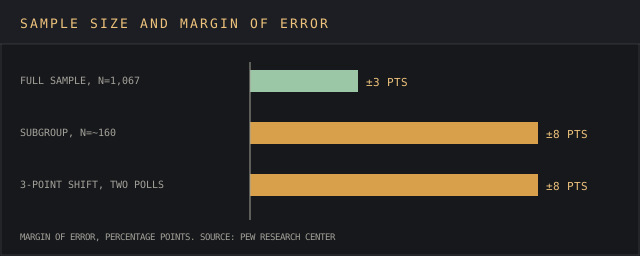
Sample size decides what a number can carry. Pew Research Center puts the margin of error for a simple random sample of 1,067 at plus or minus 3 percentage points, and for a subgroup of about 160 at plus or minus 8. A tracker reporting awareness among 25-to-34-year-olds from 160 respondents is reporting a range 16 points wide.
Teams that cut corners on sample present noise as insights. The fix is a backwards planning process: list the target groups the marketing team will want broken out, then size the sample so each group clears the precision the decision needs.
Creating the questionnaire draws on competitive analysis as much as on interviews. Understanding competitors decides which names customers see on the aided list and which rival the brand faces in the preference question. A competitor left off the list is a threat the survey can't score.
The payoff is quantitative data that holds up in a budget meeting: a percentage with a confidence range, where qualitative work gives a theme. That's the critical difference when a marketing director has to defend strategic decisions on price or positioning to a finance team.
Brand tracking: the same questions, wave after wave
A single round of quantitative research is a snapshot. A tracker repeats one fixed questionnaire monthly or quarterly over the course of years, and the research results only mean something if the questions, sample definition and question order stay the same between waves.
The trap is reading noise as news. Pew's worked example shows a 3-point shift between two polls carrying a margin of error of plus or minus 8 points, and notes that almost any two polls on their own "will prove insufficient for reliably measuring a change." A team celebrating a two-point gain after one wave has jumped the gun; three or four waves moving the same way are evidence, and the only insights worth reporting.
Kantar's brand research tracker shows the scale at the top end. Its BrandZ ranking is "powered by over 4.6 million consumer interviews across 54 markets," and the 2026 edition valued the top 100 global brands at $13.1 trillion, up 22% year on year.
Brand lift studies: isolating one campaign
Brand lift methods isolate the effect of a single marketing push on perception, using short surveys served while the ads run, with results data that usually arrives inside 14 days. Google's Brand Lift for YouTube scores up to three of ad recall, awareness, association, consideration, favorability and purchase intent.
The entry ticket is budget. Google calculates eligibility on spend over 10 days, and a one-question study needs at least $5,000 in its lowest-threshold country group, rising to $10,000 and $15,000 in the other two. The help page cites a target of roughly 4,100 responses per lift metric.
Smaller organizations priced out of that can develop pre-wave and post-wave surveys on a panel. Pew's sample-size limits apply in full, so a lift smaller than the margin of error belongs with the research results nobody can claim.
Social listening and online reviews: what customers say unprompted
Surveys only hear answers to questions somebody thought to ask. Social listening helps a team understand unsolicited conversations that name the brand, through tools such as Brand24 and Brandwatch. The social listening tools ranking compares the platforms, and social listening pricing lists what they cost.
For brand research, online reviews are the most-read slice of that record. BrightLocal found 97% of consumers read reviews for local businesses, 85% say positive reviews make them more likely to use a business, and 74% seek reviews written in the last three months. That last figure is why a review audit starts with the latest quarter.
Social media analysis gives valuable data and real-time insights into brand perception and market trends, and the same feeds surface rivals a survey never listed. Keyword analysis of who bids on the category often uncovers competitors operating under the radar, a pattern the guide to real-time market intelligence tracks by industry.
The catch with listening methods is the sample. Listening data comes from people who post, which overweights angry customers, so a complaint spike is a red flag for the marketing team to investigate and a survey is how the team sizes it.
Secondary research: what's already published
Secondary research is the cheap first step in the process: reading what other marketing and research teams have already collected before paying for fieldwork. Primary and secondary research work as a pair, and the secondary pass delivers cheap insights and decides which questions deserve the primary budget. The secondary market intelligence guide lists the source types.
Google Trends is the free default for brand search interest. Google describes its data as "a largely unfiltered sample of actual search requests made to Google," scaled 0 to 100, with low-volume terms shown as zero. It plots a brand against rivals over years and can't help a team understand why a line moved.
Desk methods such as published rankings, analyst reports and listed companies' annual reports complete the pass. Market trends spotted here become ideas for the qualitative stage to test, and the research team should collect all the information the client already holds before putting effort into a single interview.
Competitive analysis and perceptual mapping
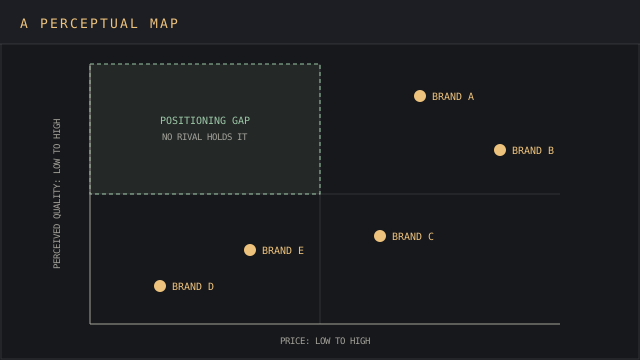
Positioning analysis compares, from the buyer's perspective, where a brand sits against competitors on the qualities customers care about. Competitive analysis methods supply the inputs: share of voice, published market share, pricing, marketing messages and how loyalty splits between players. The market intelligence analysis guide covers how to find and track competitors.
Creating a perceptual map turns those inputs into one picture, and here a picture is worth a thousand words. Respondents rate each brand on the qualities found in interviews, two dimensions that matter to consumers become the axes, and every brand becomes a point. Empty quadrants are brand opportunities: positions customers value that no rival holds, and they're where brand positioning work starts.
Audience segmentation sharpens the map and its insights. The same brand can sit in different places for different target groups, so a whole-sample map can hide a segment where the brand already leads. The market segmentation guide explains how to understand and cut those groups, and demographic segmentation is the usual first cut.
Running the research process step by step
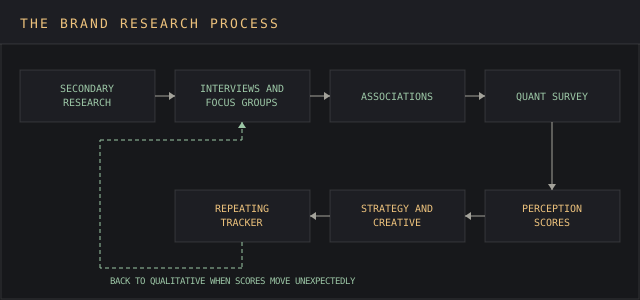
Most agencies and in-house marketing teams follow the same sequence, whatever the client or budget:
- Write down the strategic decision the research supports: a rebrand, new product offering, price change or positioning shift.
- Run secondary research to find what's known and which competitors matter.
- Hold focus groups or interviews to uncover the words customers attach to the brand.
- Field a quantitative survey sized for every one of the target groups the report will break out.
- Map positioning against competitors and choose the gap to occupy.
- Develop a brief covering brand strategy, messaging and creative direction.
- Repeat the core questions as a tracker next to sales data.
When the survey contradicts the interviews, it's back to the drawing board for the item list and the ideas behind it, which costs less effort than shipping a strategy built on a handful of opinions. The insights gained at step three set the client's cost for step four, since each added item adds time per respondent.
What changing a brand without research costs
Cracker Barrel is a recent example of the price of testing perception after a change goes public. In its fiscal 2025 results release of 17 September 2025, CEO Julie Masino thanked guests "for sharing their voices and their passion for Cracker Barrel in recent weeks" and listed the response, including "switching back to our 'Old Timer' logo, hitting pause on remodels."
The same release set a fiscal 2026 outlook that "assumes a comparable store traffic decline of 4% to 7%," and named "negative social media attention" among its risks. Protecting brand identity is easier said than done once a new sign is up; testing the change with existing customers first is the cheaper order for any organization.
Connecting brand metrics to commercial outcomes
Brand research earns its budget when its numbers predict money. Each tracker wave belongs next to the sales, retention and pricing data for the same period, so a team can understand if a rise in consideration turned into share three or six months later. The ultimate goal is a short list of brand metrics that move before revenue does.
That link also sets brand strategy and communication priorities. When awareness is high and consideration lags, the next marketing push works on reasons to buy; when awareness is low, it works on reach. Customer satisfaction scores from customer satisfaction survey software and the records in a customer intelligence framework close the loop between what customers say and do.
Research done this way is iterative, and each wave tests the bet the last one's insights prompted. An organization whose marketing team keeps an eye on the tracker can reverse a bad call within a quarter. The brand intelligence software ranking compares platforms that combine listening and tracking, and a wider market intelligence strategy sets where brand data sits next to pricing and product signals.
FAQ
Can ChatGPT do market research?
ChatGPT can handle parts of secondary research: summarizing published marketing reports, drafting a discussion guide for focus groups, sorting open-ended answers into themes. It can't supply primary data; a model's view of how customers see a brand is built from training text, so the target audience still has to be asked.
What is a brand in marketing?
The American Marketing Association defines it as any distinctive feature, such as a name, term, design or symbol, that identifies goods or services.
What are the 10 most popular brands?
By Kantar BrandZ's 2026 valuation: Google ($1.5 trillion), Apple ($1.4 trillion), Microsoft ($1.1 trillion), Amazon ($1.0 trillion), NVIDIA ($814.9 billion), Facebook ($366.6 billion), Instagram ($286.2 billion), Tencent ($251.6 billion), Oracle ($235.8 billion) and McDonald's ($235.1 billion).
What are 5 components of market research?
A common breakdown is defining the problem, planning the research design, collecting data, analyzing it and reporting findings. Brand research methods follow the same sequence with the brand as its subject.
How often should a brand tracker run?
Monthly or quarterly for most companies. Every wave needs enough respondents in each of the target groups to keep the margin of error narrower than the change the team expects to detect.
How much does brand research cost?
A Google Brand Lift study starts at a $5,000 budget over 10 days for one question in the cheapest country group. Self-run surveys cost panel fees plus questionnaire time, and survey software pricing lists what platforms charge.
Bottom line
Brand research turns a name into numbers: who knows it, what they attach to it, and how that compares with competitors. Qualitative methods find the associations, quantitative methods size them, a tracker shows if they're moving, and brand strategy follows from all three.
Getting it wrong has a concrete cost. A change to brand identity, such as a logo, a rename or a repositioning, launched without a baseline leaves companies reading customer opinion through sales figures and social feeds, after the change is public and hard to undo.
Start brand research with the decision, size the sample for the subgroups that matter, and keep the questions fixed long enough to see a trend.