Monetization Strategy Template
 By Jan Suski. I go deep on every review, checking every number against its source and digging up details other coverage misses, a habit from six years of SEO and link building for tech companies. Bylines at Surfer, Brand24, and Senuto. How the scoring works.
Get the monetization strategy template
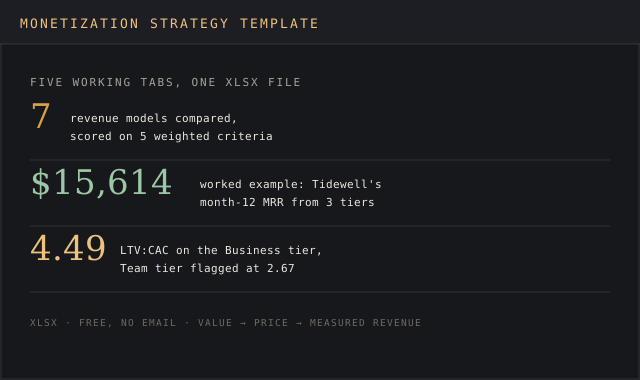
An Excel workbook that takes a product from a blank canvas to a scored revenue model, priced tiers, a revenue forecast, unit economics, and a log of the assumptions you still have to test.
Download XLSXA monetization strategy template is a working spreadsheet that records how a product will generate revenue: who pays, what they pay for, which revenue model collects the money, and which numbers prove the plan is working.
The file on this page has five tabs. One is a strategy canvas, one scores competing monetization models against weighted criteria, one prices the tiers and forecasts monthly recurring revenue, one computes lifetime value against customer acquisition cost, and one logs every assumption with the test that will confirm or kill it.
This page covers the monetization strategy definition, the seven revenue models most products choose from with real world examples and verified numbers from Spotify, eBay, Netflix and Microsoft, a full worked example on a hypothetical scheduling app, data monetization, and the mistakes that sink a monetization plan before launch.
It's built for founders pricing a first product, product managers adding a paid tier to a free one, and finance leads who have to defend a revenue target in a board deck. Simon-Kucher's own research found that 72 percent of innovations fail to meet their financial targets or fail entirely, and the firm's fix is to settle willingness to pay before resources go into the build.
Download the free monetization strategy template
Download the monetization strategy template (XLSX)Five tabs: strategy canvas, model scoring, pricing and forecast, unit economics, and assumptions log, pre-filled with the Tidewell example and ready to clear.

The workbook opens in Excel, Google Sheets and LibreOffice Calc without reformatting. Every computed cell uses SUMPRODUCT, RANK, ROUND, IF, TEXT or plain arithmetic, so the formulas survive the trip into Sheets unchanged.
What a monetization strategy is
A monetization strategy is the plan for turning a product, service, audience or data asset into revenue. Simon-Kucher's definition says it "outlines how your business will convert your products, services, or assets into income streams." Paddle words it as "a plan that aims to generate revenue via your platform, audience, content, or other sources."
Two companies in the same industry can run different monetization models and both work. Netflix and Spotify both sell streaming services; Netflix bills every member on a subscription basis, while Spotify gives most users a free tier and sells the premium model to a minority.
The monetization model is one line inside that plan. It names the mechanism (subscription, freemium, transaction fee, licensing, advertising, affiliate commission or in-app purchases). The monetization strategy wraps the model in everything around it: the target audience, the value proposition, the price points, the acquisition channels, the revenue targets and the metrics that show if the model is holding up.
The simple definition of monetization, stripped of jargon, is charging someone for something they already value. A monetization strategy template forces that value to be named before a price gets attached to it.
Why a written monetization plan beats a pricing page drafted at launch
A pricing page copied from a competitor carries that competitor's cost structure and value metric along with it. A written monetization plan makes the team pick its own value metric first.
Simon-Kucher says a monetization strategy helps with "identifying the most lucrative revenue opportunities and prioritizing investments accordingly." For a product with several possible revenue streams, that ranking is the Model Scoring tab.
The firm also claims its pricing projects lift client profitability by an average of 100 to 500 basis points. That's the consultancy's own figure about its own work, so read it as a vendor claim. The mechanism behind it is easier to check: a team that has scored its options knows which one it's betting on and why.
A written plan also keeps cross functional teams on the same page. Product picks the value metric, marketing owns user acquisition, finance owns the revenue targets, and the canvas shows how each team's monetization efforts contribute to one number. Without it, marketing efforts chase sign-ups the pricing can't convert.
The plan also gives a business strategy something to revisit. Market trends and market dynamics shift: a competitor drops its entry price, a new channel opens, business growth stalls in one segment. A dated canvas with written assumptions turns "should we change pricing" from a gut call into a comparison against what the team expected six months earlier.
Nothing in the template is set in stone; the review date field exists so it gets reopened.
Different monetization strategies, with real monetization examples
The template scores seven revenue models. The usual pattern is one primary model, with a second added as one of the new revenue streams once the first is stable, so a mature product can run various revenue streams side by side. The table compares the pricing models on the two questions that decide fit: who pays, and what drives revenue.
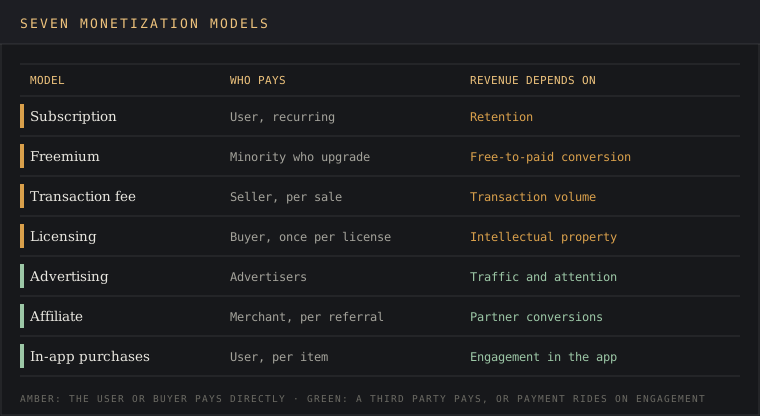
| Monetization model | Who pays | Revenue depends on | Example with a verified figure |
|---|---|---|---|
| Subscription | The user, on a recurring basis | Retention | Netflix, about 302 million paid memberships |
| Freemium | A minority of users who upgrade | Free-to-paid conversion | Spotify, 300 million Premium of 777 million MAUs |
| Transaction fee | The seller, per sale | Transaction volume | eBay, 13.6% final value fee in most categories |
| Licensing | The buyer, once per license | Intellectual property | Office Home 2024, $179.99 one-time |
| Advertising | Advertisers | Traffic and attention | AdSense pays publishers 80% of content ad revenue |
| Affiliate | The merchant, per referred sale | Partner conversions | Amazon Associates, 3% to 10% by category |
| In-app purchases | The user, per item | Engagement inside the app | Apple takes 15% under its Small Business Program |
Subscription model
A subscription model charges a recurring fee for ongoing access. Netflix's FY2024 10-K describes "approximately 302 million paid memberships in over 190 countries." Subscription revenue is predictable because last month's subscribers mostly pay again this month, which is why software companies selling SaaS default to it.
The catch is retention. A subscriber pays only as long as the product keeps delivering ongoing value, so customer satisfaction shows up in the churn rate within a billing cycle and churn eats the forecast from the bottom.
Freemium model
The freemium model gives a free version away and charges for premium features or limits. Spotify's Q2 2026 update reported 777 million monthly active users and 300 million Premium subscribers, a 38.6% paid share.
Spotify is the outlier. Kyle Poyar and Lenny Rachitsky's 2023 benchmark puts a good free-to-paid conversion rate for a self-serve freemium product at 3% to 5%, and a great one at 6% to 8%.
A free tier builds a large user base fast. Turning that user base into revenue is the hard half. The free tier also shapes the user journey: the limit a user hits first becomes the upgrade prompt they see, so it belongs at a point that doesn't break the user experience mid-task.
Transaction fees
A transaction fee model takes a commission on each sale or payment. eBay's seller fee page lists a 13.6% final value fee on most categories up to $7,500, plus a $0.30 or $0.40 per-order fee. Payment gateways run the same model: Stripe charges 2.9% + 30¢ per successful domestic card transaction.
E-commerce platforms and marketplaces live on volume, since volume drives revenue in this model. At a 0.5% platform fee, $1 million in processed payments yields $5,000, which is a drop in the bucket until volume compounds.
Licensing
Licensing sells the right to use software or intellectual property. Microsoft still sells Office Home 2024 as a $179.99 one-time purchase next to Microsoft 365 Personal at $99.99 a year, which puts the two models side by side on one page. SAP pairs enterprise licenses with cloud contracts and reports a cloud user base of over 300 million subscribers.
A license produces consistent revenue only when the intellectual property is a competitive advantage buyers can't get elsewhere, and unlicensed copies (piracy) leak revenue the vendor never sees.
Advertising
The advertising model keeps the product free and sells the audience's attention. Google's AdSense help page says publishers receive 80% of the revenue for content ads after the advertiser platform's fee. Spotify's same Q2 2026 release shows the limit: 494 million ad-supported users produced €446 million, while 300 million Premium subscribers produced €4,331 million.
Ads tie revenue generation to large user bases and high traffic, and every extra ad slot costs user experience.
Affiliate commissions
Affiliate marketing earns a commission for referring a buyer to someone else's product. The Amazon Associates fee schedule pays 10% on Luxury Beauty, 4.5% on physical books and 3% on toys. Overhead is low and the model scales, which suits blogs and review sites, but revenue depends on the partner's checkout converting.
In-app purchases
In-app purchases sell items, credits or upgrades inside mobile apps. Apple's App Store Small Business Program takes a 15% commission on paid apps and in-app purchases for developers under $1 million in prior-year proceeds, so the platform fee belongs in the forecast before the first price is set. Revenue scales with customer interaction inside the app, which makes session length the metric to watch.
Product monetization strategy for software companies
A product monetization strategy for software usually blends two models. The pricing strategy on a SaaS pricing page usually takes one of four shapes, listed below. The right monetization model depends on what customers count as value.
That unit is the value metric. A scheduling app's customers value jobs dispatched and technicians managed; a data API's customers value calls made. Pick the unit that grows when the customer gets more out of the product, and price on it; a value metric rivals haven't matched is a competitive advantage of its own. Charge per seat when value grows per job, and you'll leave the lion's share of revenue with the customer.
A pricing strategy built on the value metric tracks perceived value: customers accept a bigger bill when the bill grows with the thing they bought the product for. That's how a plan can maximize revenue per account and still keep the free users who feed the upgrade funnel; maximum profitability on a spreadsheet is worth nothing if conversion drops to zero.
- Tiered plans: two to four packages separated by limits and premium features.
- Usage-based pricing: a rate per unit of the value metric, billed in arrears.
- Freemium: a free version capped low enough that growing teams hit the ceiling.
- Hybrid: a subscription base plus a transaction fee or usage overage as a second revenue stream.
Trying to have your cake and eat it too, by stacking all four at launch, makes the pricing page unreadable. One primary model, one add-on, and a test plan for the add-on is the shape the template is built around.
What the monetization strategy template contains
The workbook runs left to right, from what the product is worth to what the plan expects to collect. Each tab feeds the next.
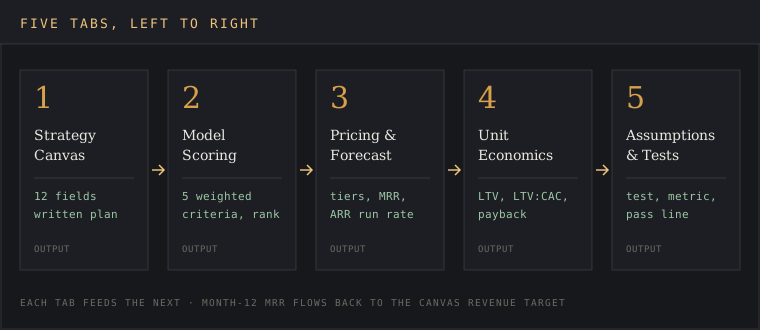
| Tab | What you enter | What it computes |
|---|---|---|
| 1. Strategy Canvas | Twelve fields: product, target audience, value proposition, value metric, primary model, secondary revenue stream (data monetization goes here too), pricing structure, acquisition and distribution channels, 12-month revenue target, metrics, risks and assumptions, review date | Nothing; it's the written plan |
| 2. Model Scoring | Five criteria weights and a 1-to-5 score per model | Weighted total and rank per model |
| 3. Pricing & Forecast | Tier prices, free account base, conversion rates, add-on adoption | Paid accounts, MRR, ARR run rate |
| 4. Unit Economics | ARPA, gross margin, monthly churn, CAC per tier | LTV, LTV:CAC ratio, CAC payback months |
| 5. Assumptions & Tests | Each assumption, its test, metric and pass threshold | Status per assumption |
The canvas maps the target audience and value proposition first because every later number depends on them, and it ties the chosen monetization model to the business objectives written at the top. Customer acquisition and distribution channels sit on the canvas too, since a model that needs a sales team and a product that sells through an app store don't share a cost base.
How to fill in the template, step by step
- Write the value proposition in one sentence on the Strategy Canvas, naming the customer and the outcome they pay for.
- Pick the value metric: the unit that grows when the customer gets more value.
- Set the five criteria weights on Model Scoring so they sum to 100%, then score each monetization model 1 to 5.
- Take the top-ranked monetization model as primary and the runner-up that fits the same value metric as a candidate secondary stream.
- Enter tier prices and conversion assumptions on Pricing & Forecast; check the conversion rate against the 3% to 5% freemium benchmark before trusting the MRR line.
- Fill Unit Economics per tier and read the LTV:CAC and payback cells against the thresholds.
- Log every number you guessed on Assumptions & Tests with the test that will replace the guess.
Step five is where a data driven approach catches pie-in-the-sky forecasts. A 20% conversion rate on a freemium product sits four times above the top of the 3% to 5% good range, and the template's conversion cells are where that shows.
Worked example: monetizing a field-service scheduling app
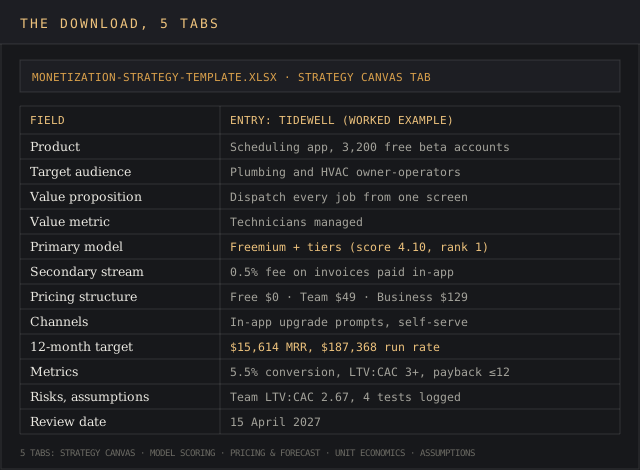
The downloadable file ships filled in for a hypothetical company, Tidewell, a scheduling and dispatch app for small plumbing and HVAC contractors. Tidewell has 3,200 free beta accounts after 18 months and no revenue. Every value below matches the workbook cell for cell.
Model scoring
Tidewell weighted fit with the value metric at 30%, revenue predictability at 25%, and implementation effort, customer acceptance risk and time to first revenue at 15% each.
| Model | Fit 30% | Predictability 25% | Effort 15% | Acceptance 15% | Speed 15% | Weighted total | Rank |
|---|---|---|---|---|---|---|---|
| Freemium + tiered subscription | 4 | 5 | 3 | 4 | 4 | 4.10 | 1 |
| Usage-based (per job) | 5 | 3 | 3 | 3 | 4 | 3.75 | 2 |
| Transaction fee on payments | 3 | 3 | 2 | 4 | 3 | 3.00 | 3 |
| One-time license | 2 | 1 | 4 | 3 | 5 | 2.65 | 4 |
| Advertising | 1 | 2 | 4 | 2 | 3 | 2.15 | 5 |
Freemium with tiered subscriptions wins at 4.10. Usage-based pricing scores highest on fit, but contractors' job counts swing with the seasons, so its predictability score is 3. The transaction fee ranks third and becomes the secondary revenue stream: a 0.5% platform fee on invoices customers pay through the app.
Pricing tiers and revenue forecast
| Tier | Price per month | Limit | Conversion of 3,200 free | Paid accounts | MRR |
|---|---|---|---|---|---|
| Free | $0 | 1 technician, 40 jobs/month | n/a | n/a | $0 |
| Team | $49 | Up to 5 technicians | 4.0% | 128 | $6,272 |
| Business | $129 | Up to 20 technicians | 1.5% | 48 | $6,192 |
Subscription MRR lands at $12,464, an ARR run rate of $149,568. The payments add-on assumes 20% of the 176 paid accounts opt in (35 accounts) at $18,000 of monthly invoice volume each, which at 0.5% adds $3,150 a month. Total month-12 MRR is $15,614, a $187,368 run rate, which goes on the canvas as the revenue target.
The combined 5.5% conversion sits between Poyar and Rachitsky's good and great bands. The Business tier drives revenue almost level with Team ($6,192 against $6,272) from 80 fewer accounts.
Unit economics
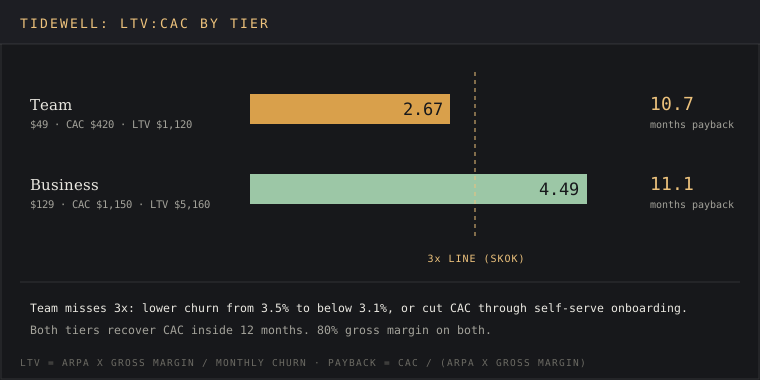
Lifetime value is ARPA times gross margin divided by monthly churn. CAC payback is CAC divided by monthly gross profit per account. David Skok's SaaS Metrics 2.0 sets the lines: "The best SaaS businesses have a LTV to CAC ratio that is higher than 3," and profitability turns anemic when CAC recovery runs past 12 months.
| Tier | ARPA | Gross margin | Monthly churn | CAC | LTV | LTV:CAC | Payback |
|---|---|---|---|---|---|---|---|
| Team | $49 | 80% | 3.5% | $420 | $1,120 | 2.67 | 10.7 months |
| Business | $129 | 80% | 2.0% | $1,150 | $5,160 | 4.49 | 11.1 months |
Business clears both lines. Team misses the 3x ratio, which is a red flag the forecast tab alone would never show. Two levers fix it: cut Team's customer acquisition costs by routing it through self-serve onboarding only, or lower churn below 3.1%, where the ratio crosses 3.
Assumptions to test
- 4% of free accounts upgrade to Team within 12 months. Test: paywall the sixth technician seat for a 400-account cohort for 60 days. Pass: 3% or higher.
- Contractors accept a 0.5% fee on invoice payments. Test: offer it to 50 paid accounts. Pass: 20% opt in.
- Business-tier churn holds at 2.0% a month. Metric: monthly logo churn over two quarters. Pass: 2.0% or lower.
- $49 converts as well as $39. Test: A/B the pricing page for 30 days. Pass: conversion gap under half a point.
Data monetization as a revenue stream
Data monetization is a separate decision from the core revenue model, and the template logs it as a candidate secondary revenue stream. Snowflake defines data monetization as "the practice of using information to generate measurable economic benefits." A product that records transactions, locations or usage already holds the raw material.
Direct data monetization
Direct data monetization sells the data or access to it. Selling raw or aggregated data and data as a service (DaaS), which Snowflake describes as making "data available to customers on demand," are the two common shapes. Aggregated data strips out personally identifiable information, so it carries less compliance risk and, per Snowflake, usually less value.
Monetizing data this way turns data sources into new revenue streams with their own buyers.
Indirect data monetization
Indirect data monetization uses customer data to sell more of the core product. McKinsey's October 2013 article attributed 35 percent of what consumers purchase on Amazon to algorithm-based product recommendations built from consumer preferences.
Data driven recommendations like these turn data into actionable insights about customer preferences, enhance customer experience, and lift revenue generation without a separate price tag. Indirect data monetization also covers operational efficiency gains, such as routing that cuts drive time, which lower cost and leave revenue unchanged.
Tidewell's transaction data arrives as real time data from every dispatched job. Run through basic statistical methods, it yields job-duration benchmarks by trade, and providing analytics on those benchmarks as a premium feature gives contractors valuable insights and actionable insights per job type, sold to them for operational efficiency.
Each data asset on the canvas is a short list of business opportunities, and monetizing data from the core product is the cheapest of them to test.
Data privacy and data integrity
Data privacy decides what's sellable. GDPR Article 83(5) sets fines of up to €20 million or 4% of worldwide annual turnover, whichever is higher. Anonymized data, consent records and data integrity checks belong on the Assumptions & Tests tab before any data monetization line enters the forecast. Cut corners here and the fine wipes out years of the revenue it was meant to add.
Common mistakes in a monetization strategy
Check a first draft for these six errors:
- Pricing on a metric customers don't value. Per-seat pricing on a product whose value grows per job caps revenue at headcount.
- Forecasting freemium conversion from Spotify. Its 38.6% paid share is nearly eight times the top of the 3% to 5% good range for self-serve products.
- Stopping at the revenue line. Monetization efforts measured on MRR alone hide cost; a forecast that hits its target with LTV:CAC under 3 is buying revenue at a loss.
- Putting all your eggs in one basket with a second model that needs a different buyer, such as ads on a B2B tool sold to finance teams, where the ads degrade the customer experience the subscription is selling.
- Never reopening the plan. Simon-Kucher's page says "monetization strategy is not set in stone"; a canvas without a review date hardens into a fixed price list.
- Booking data monetization revenue before the privacy review. A GDPR fine at 4% of turnover outweighs a data line worth a fraction of that.
The devil's in the details on mistake three. Team-tier revenue in the Tidewell example looks healthy at $6,272 a month until the unit economics tab shows each account costs $420 to win and returns $1,120 over its life.
Excel, Google Sheets or a document: which format to use
A monetization plan with a forecast belongs in a spreadsheet, because the numbers recalculate when an assumption changes. The XLSX file runs in Excel and uploads to Google Sheets with every formula intact; Sheets is the better pick when a founder, a product lead and a finance lead all edit the same canvas.
A document format suits the canvas alone, for a board memo or an investor update. Copy the Strategy Canvas tab into the memo and keep the scoring, forecast and unit economics in the workbook, where the cross-tab formulas keep working. For the go-to-market side of the same launch, the go-to-market plan template picks up where the canvas's channel field stops.
FAQ
What are monetization strategies?
Monetization strategies are plans for turning a product, audience or data into revenue. Each one names a monetization model, such as subscription, freemium, transaction fee, licensing, advertising, affiliate or in-app purchases, and attaches prices, channels and success metrics to it.
What are examples of monetization?
Netflix's subscription, Spotify's freemium tier, eBay's 13.6% final value fee, Microsoft's $179.99 Office license, Google AdSense advertising and Amazon Associates commissions are six monetization examples, each running a different revenue model.
What is the simple definition of monetization?
Monetization is charging money for something people already use or value. A monetization strategy is the written plan for how and how much.
How do you monetize something?
Name the value metric, score each candidate monetization model, price the tiers, check unit economics against a 3x LTV:CAC ratio, and test the riskiest assumption first. The template's five tabs follow that order.
Can you give me an example of data monetization?
Amazon's product recommendations are the standard example: McKinsey attributed 35 percent of what consumers purchase on Amazon to them in 2013. That's indirect data monetization, where customer data sells more of the core product.
What are the latest trends in monetization?
Spotify's Q2 2026 numbers show the direction: Premium revenue grew 15% year over year while ad-supported revenue grew 1%. Microsoft sells a one-time Office license next to its Microsoft 365 subscription, and the template's secondary revenue stream field exists for that kind of pairing.
Bottom line
Reach for this monetization strategy template when a product has users and no price, when a free product needs a paid tier, or when a revenue target has to survive questions from someone who controls the budget. The scoring tab settles which model to bet on; the unit economics tab shows if the bet pays, and the assumptions log keeps monetization efforts tied to business goals and long term success past the launch quarter.
For sizing the market the revenue target draws from, the total addressable market template fits better. For pricing a product against named rivals, start with the competitive analysis template and bring the result back to the canvas.