Psychographic segmentation: how to measure values, attitudes and lifestyle
 By Jan Suski. I go deep on every review, checking every number against its source and digging up details other coverage misses, a habit from six years of SEO and link building for tech companies. Bylines at Surfer, Brand24, and Senuto. How the scoring works.
The short version 10 points · 40 seconds
- 01It groups people by what they believe and how they liveValues, attitudes, interests, traits, status
- 02It changes the message, the product, the price and the budgetMatched ad copy sold more in the Matz study
- 03Five variables, and each one needs its own survey itemBFI-2-S scores five traits from 30 items
- 04Interviews come first, then a survey counts the attitudesDigital traces carry a privacy cost
- 05Segments come out of a clustering step run on the answersPew: 27 questions, 10,221 adults, nine groups
- 06Syndicated products sell psychographic segments ready-madeMosaic: 126 million households, 70 types
- 07Matched messages outperform generic ones in field testsUp to 50% more purchases on Facebook ads
- 08Stated values and purchases drift apart65% wanted purpose-driven brands; 26% bought
- 09Three segmentation types answer three separate questionsValues, traits and actions, each from its own data
- 10A small team can run a first pass in five stepsStart from the decision the segments change
Psychographic segmentation is the practice of grouping customers based on psychological traits: their values, attitudes, interests, lifestyle and personality. Two buyers with the same age, income and postcode can hold opposite views on price, risk or sustainability, and this is the layer that records the difference. It's written for marketers and analysts who already hold a customer base and a survey tool.
This lesson assumes you've read the overview of the five types of market segmentation, so it skips the definitions and goes straight to measurement. It covers the five variables and the survey items behind each, how to collect psychographic data, how answers become segments, what ready-made data costs, the published psychographic segmentation examples and where the method breaks.
What psychographic segmentation measures
Psychographic segmentation is one layer of customer segmentation, and it sorts people by internal states a form field can't capture. A demographic variable has one correct answer per person. Psychographic variables are positions on a scale, and a respondent's score only means something next to everyone else's.
That difference drives the cost. The demographic lesson shows demographic segmentation built from census tables & CRM fields a team already owns. Psychographic segmentation in marketing nearly always starts with fresh questions, because no CRM stores how much a customer values status or novelty.
The payoff of psychographic segmentation is a deeper understanding of consumer motivations. A demographic profile says a buyer is 34 and earns $90,000. A psychographic profile says the same buyer ranks durability above price and distrusts discount brands, which changes the copy, the offer and the channel.
What psychographic segmentation adds to a marketing strategy
Using psychographic segmentation changes four decisions in a marketing strategy: the message, the product, the price and where the budget goes. The evidence is strongest for the message. In the 2017 Matz study covered below, the same product sold more when the ad copy matched the reader's extraversion score, which is the core case for tailoring marketing strategies to personality traits.
Psychographics enable a team to create targeted campaigns aimed at a motive, so one product can carry two marketing campaigns: durability for buyers who value security, novelty for buyers high on open-mindedness. Personalized campaigns built this way are personalized marketing strategies with a measured trait behind each target audience.
Product teams read the same psychographic data for unmet lifestyle needs. Consumption patterns that cluster with a value, such as repair-over-replace habits among buyers who rank durability first, point to products the demographic view hides. Pricing strategies follow, since a segment that ranks quality above price accepts a premium tier a discount-seeking segment rejects.
Budget is the quieter payoff of targeted marketing. Marketing efforts aimed at a segment's real motive spend less on people who were never going to respond, and the 40% click lift Matz measured is that difference. Psychographic segmentation offers actionable insights only when each segment maps to a channel or an offer, so name the action before writing a single survey item.
Consumer behaviors are the check on all of it. Psychological factors explain intent, and logged consumer behaviors confirm it: brand loyalty earned through shared values shows up as repeat purchase. That's the point where valuable insights become actionable strategies.
The five psychographic segmentation variables and the item behind each
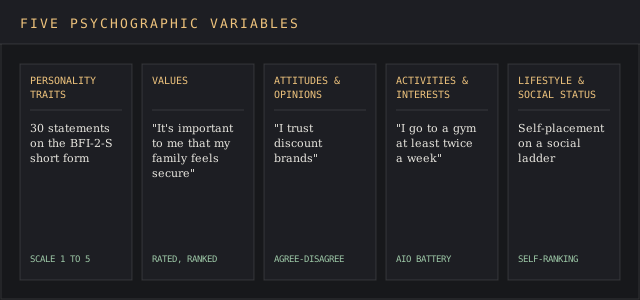
Most textbooks list five inputs to psychographic segmentation: personality traits, values, attitudes and opinions, activities and interests, and lifestyle with social status. Each needs a different kind of question. Treat them as five instruments, since a single "describe yourself" box will miss the mark on all five.
Personality traits
Personality is the best-measured of the five, thanks to decades of academic work on the Big Five. The BFI-2-S short form from Christopher Soto & Oliver John (Journal of Research in Personality, 2017) scores extraversion, agreeableness, conscientiousness, negative emotionality and open-mindedness from 30 statements. Each is rated from 1, disagree strongly, to 5, agree strongly.
Thirty items are short enough to sit inside a wider customer survey. That's why psychographic segmentation projects usually start with personality when they want psychographic factors with a validated scale behind them.
Values
Values are the slow-moving beliefs about what matters: security, achievement, tradition, fairness. They're measured as ranked or rated statements ("It's important to me that my family feels secure"), and they shift over years. That makes values the stable anchor of most psychographic segments.
Attitudes and opinions
Consumer attitudes are narrower and faster-moving: a view on a category, a brand or an issue. Pew Research Center's political typology, covered below, is an attitude instrument at national scale. Attitudes sit closer to a specific purchase than values do, so they shape how marketing messages land, and they change faster.
Activities and interests
Activities, interests and opinions, the AIO battery, ask what people do with their time and what holds their attention. Typical items read "I go to a gym at least twice a week" or "I follow cooking channels." These items are the cheapest to write and the easiest to answer, because they describe habits.
Lifestyle and social status
Lifestyle combines the four above into a pattern of spending and time. Social status sits here too: how people rank themselves and which groups they want to be seen with. In social class psychographic segmentation the variable is self-placement and aspiration, which is why it can disagree with the income field.
How to collect psychographic data
Data collection runs four ways, and each trades cost against depth. Surveys are the core market research method for this work; the research methods lesson compares them with the rest of market research. Most programs combine two:
- Surveys. Structured Likert batteries sent to current and prospective customers. They produce the quantitative data clustering needs and scale to thousands of respondents.
- Customer interviews. Long one-to-one conversations with a small sample. They supply qualitative insights and the vocabulary to write better survey items.
- Focus groups. A small group discussing a category together. Useful for testing how a segment reacts to a message, weak for measuring individuals.
- Digital traces. Likes, follows & content consumed, scored by a model. Cheap per person and the hardest to defend on consent.
The order matters. Interviews first, because qualitative data tells you which attitudes exist in the customer base; the survey then counts how common each one is. Teams that write the survey from scratch without interviews tend to measure the attitudes the marketing team already holds.
Digital traces are where psychographic segmentation gets risky. A 2013 study in PNAS by Michal Kosinski, David Stillwell and Thore Graepel took Facebook Likes from more than 58,000 volunteers and predicted political party correctly in 85% of cases. Its prediction of Openness came close to the test-retest accuracy of a standard personality test, so a model can collect psychographic data no respondent agreed to give.
That's a red flag for any team buying inferred traits. The data source attribution techniques lesson covers how to record where each attribute came from, which matters more for psychographic information than for any other field in a profile.
Turning survey answers into psychographic segments
Segments come out of a statistical grouping step run on the survey answers. The best public worked example is Pew Research Center's 2021 political typology.
Pew surveyed 10,221 adults on its American Trends Panel from July 8 to 18, 2021 and classified the public into nine groups based on their political values and attitudes. One of them, the Stressed Sideliners, made up 15% of the public.
The method appendix shows the steps any psychographic analysis follows. Pew used 27 questions about social and political values, standardized every variable and ran weighted clustering around medoids in R 4.1.1. It compared solutions with different group counts and judged them on cohesion, distinctness and practical size.
Then it reran each model with different random starts. The k-medoids algorithm consistently returned the same groups, which is the stability check most commercial segmentation analysis skips.
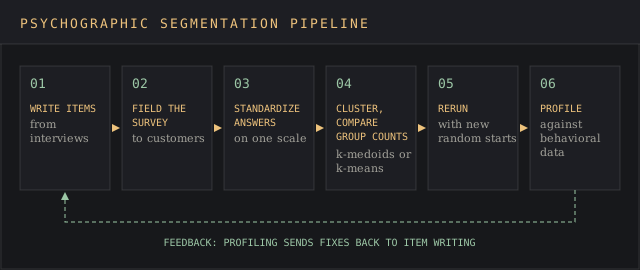
Two lessons transfer to psychographic segmentation on an ordinary customer survey. Choose the number of segments on usefulness as well as fit, since nine was a call Pew made after comparing alternatives. And rerun the model before naming anything, because a segment that disappears on a second random start was noise.
The devil's in the details at the profiling stage. Every cluster gets a name and a description, and that description should come from its average scores and its demographic data. The market intelligence analysis lesson covers how to write that kind of finding so the evidence travels with the label.
Buying ready-made psychographic segments
Running psychographic segmentation from scratch costs time a small team may not have, so syndicated products sell distinct psychographic segments off the shelf. The trade is precision for speed.
Experian's Mosaic USA classifies all U.S. households into 19 groups and 70 types, using more than 400 data attributes across socioeconomics, demographics, lifestyle and behavior. Its database covers 126 million households. Experian says the product surfaces consumer motivations, values and media preferences, so it sits on the border between psychographic and demographic data.
Strategic Business Insights' VALS framework is the other long-running option; the segmentation examples lesson walks through its eight types. Both work the same way: you append a code to each customer record and read your customer base through someone else's model before planning marketing campaigns.
The weakness is fit. A syndicated model was built for a whole country, so its groups won't line up with the attitudes that drive one category. Buy it to get the ball rolling, then validate it against your own survey. The secondary market intelligence lesson covers how to judge any third-party dataset before you rely on it.
Psychographic segmentation examples with published results
Most psychographic segmentation examples online are brand anecdotes with no number attached. Three have figures a reader can check.
The strongest test comes from Sandra Matz, Kosinski and colleagues, published in PNAS in November 2017 and summarised by Cambridge Judge Business School. Across three studies reaching more than 3.5 million Facebook users, ads matched to extraversion or introversion produced up to 40% more clicks and up to 50% more purchases than mismatched or unpersonalised ads.
That's the measured case for using psychographic segmentation in personalized marketing campaigns. It also hit the nail on the head about what the matching needs: a trait score per person, which the study took from Likes.
Dove is the long-running brand case of psychographic segmentation. The company turned its self-esteem positioning into the Dove Self-Esteem Project in 2004 and says it has reached over 82 million young people with self-esteem education. The segment is defined by an attitude, body confidence, and the program targets it directly.
Patagonia builds on values. Its core values, updated in 2022, list environmentalism as "Protect our home planet," and the page links its 1% for the Planet commitment. That's targeted marketing aimed at an audience's values, and the brand loyalty it earns comes from buyers who rank the cause above price.
Where psychographic segmentation fails
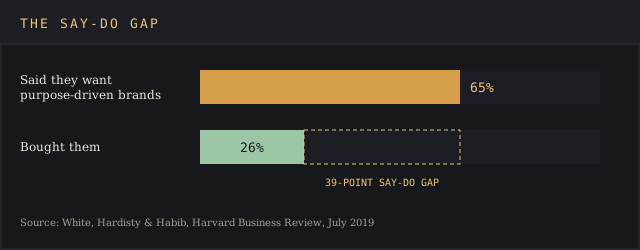
Talk is cheap in a survey. People report the values they'd like to hold, and the gap between stated values and buying behavior is psychographic segmentation's biggest documented weakness.
Katherine White, David Hardisty and Rishad Habib reported the size of it in Harvard Business Review in July 2019: in one survey, 65% said they wanted to buy purpose-driven brands that advocate sustainability, and only about 26% did. A segment built on the stated answer would be more than double the size of the real market, and a plan resting on it puts all your eggs in one basket.
Three more failure modes show up in practice:
- Stability. Psychographic segmentation data ages fast: attitudes move with news & season, so a segment fitted in March can misclassify customers by October.
- Reach. Specific psychographic segments have no targeting field in most ad platforms, so targeted marketing ends up buying a demographic proxy for the audience segments it wants.
- Consent. Inferred personality scores fall under the same privacy scrutiny the 2013 Likes study raised.
The fix is to read between the lines and test psychographic segmentation against behavioral data. Score each psychographic segment against what its members bought in the last year, and drop or merge segments whose purchase behavior and buying behavior are indistinguishable. Psychographic data that survives that test is worth a marketing strategy.
Psychographic vs demographic and behavioral segmentation
Psychographic segmentation and the other two axes answer different questions, and the behavioral segmentation lesson covers the third in full. The table sets them side by side.
| Question | Demographic | Psychographic | Behavioral |
|---|---|---|---|
| What it groups by | Age, income, education | Values, attitudes, personality | Purchases, usage, loyalty |
| Data collection | Census, CRM fields | Surveys, interviews | Transaction and product logs |
| Items per variable | One field | A battery; 30 items for five traits on BFI-2-S | Logged automatically |
| Main risk | Stereotyping | Stated answers drift from actions | Explains what, never why |
| Best use | Reach and media buying | Positioning and marketing messages | Timing, offers, retention |
Combining psychographic insights with the other two is where psychographic segmentation earns its cost. Behavioral data shows which customer segment buys, how often a customer group returns and which consumer behaviors repeat; psychographic data explains the motive, and the demographic layer says where to find more of them.
Implementing psychographic segmentation with a small team
A first pass fits inside a few weeks and a standard survey tool. Five steps, in order:
- Name the decision. Positioning, a product line or one campaign; the customer segments only need to split the customer base on that question.
- Run a round of interviews with customers and pull out the attitudes that recur.
- Write agree-disagree items from those attitudes; Pew used 27 and the BFI-2-S uses 30. Add a validated trait scale if personality matters.
- Survey the customer base, then cluster and rerun the model with new random starts.
- Profile each segment against behavioral data, write customer personas for the survivors and create marketing campaigns that test one message per segment.
Keep the segment count small when using psychographic segmentation for the first time. Four or five target segments that keep the creative team on the same page beat nine that nobody uses, and the customer intelligence framework lesson shows how to keep them updated once the first marketing strategy built on them ships.
FAQ
What is psychographic in market segmentation?
It's the set of psychographic characteristics that describe how people think: values, attitudes, interests, lifestyle and personality traits. Psychographic segmentation explains why two buyers with the same demographics choose differently.
Which is an example of a psychographic variable?
Extraversion is one of the psychographic segmentation variables most teams start with. The BFI-2-S measures it with six of its 30 items, rated on a five-point agree-disagree scale. Concern for the environment and the importance placed on social status are two more psychographic traits.
What is psychographic vs behavioral segmentation?
Psychographic segmentation groups people by stated attitudes from surveys and interviews. Behavioral segmentation groups them by logged actions such as purchases and usage. Strong programs use both and check where they disagree.
Can you give me an example of psychographic analysis?
Pew Research Center's 2021 political typology. It clustered answers to 27 value questions from 10,221 adults into nine groups, using k-medoids, and checked that reruns returned the same groups.
What are psychographic examples?
The psychographic segmentation examples with published figures are the Matz 2017 personality-matched ads, Pew's nine-group values typology and Dove's self-esteem program. Each shows psychographic segmentation tied to a measured outcome.
What is a psychographic target audience?
A target audience defined by a shared attitude or value, for example buyers who rank durability above price. Mapping a target audience's psychographics needs a survey or a syndicated model, because no ad platform field stores it.
Bottom line
Psychographic segmentation measures what demographics can't: the values, attitudes and personality traits behind a choice. It works when the variables are measured with tested survey items, the segments come out of a clustering step that holds up on reruns, and each segment is checked against what its members bought.
Psychographic insights give a deeper understanding of why customers buy, and they're only as good as that check. Skip it and the segments describe the customers people say they are. The HBR survey's 65% against 26% is the price of that mistake: a sustainability segment sized at more than double its real market, with a marketing strategy built on top of it.
The branches rejoin in the next lesson, one documented example per segmentation type, where the psychographic case sits next to the demographic, geographic and behavioral ones.