Renewable energy statistics 2026: capacity, generation and share of the energy mix
 By Jan Suski. I go deep on every review, checking every number against its source and digging up details other coverage misses, a habit from six years of SEO and link building for tech companies. Bylines at Brand24 and Senuto. How the scoring works.
The world added a record 692 GW of renewable power capacity in 2025, taking the total to 5,149 GW, according to the International Renewable Energy Agency. Renewables now make up 49% of global installed power capacity. In 2025 they also overtook coal in electricity generation for the first time, at 33.8% of the world's power, per Ember.
This report gathers renewable energy statistics as secondary data from the bodies that measure them, with renewable energy figures from IRENA for capacity, Ember and the International Energy Agency for generation, the Energy Institute for primary energy, the Tracking SDG7 partners for final energy consumption, and the US Energy Information Administration for the United States. Each figure links to its publisher.
It's for analysts, buyers of energy data and anyone quoting a renewable share. The same year can be reported as a third renewable or under a tenth renewable, depending on which energy data the figure divides by, and that gap gets a section of its own.
The numbers Global and US renewable energy, checked 17 November 2026
Solar supplied about three-quarters of the renewable capacity added in 2025.
Renewables passed coal in global power generation in 2025, by 0.8 percentage points in Ember's count.
Fossil fuels still supplied 82% of the energy the US used in 2025.
I'll write a 2,500+ word report on the slice you name, every figure linked to its source. Yours to publish, from $200.
Renewable power capacity installed in 2025
The International Renewable Energy Agency's Renewable Capacity Statistics 2026, released on 1 April 2026, counts 692 GW of new renewable power capacity in 2025, a 15.5% rise. Renewables made up 85.6% of all new power capacity installed worldwide, down from 92.5% the year before, and total renewable capacity installed reached 5,149 GW. That installed capacity is 49% of global electricity generation capacity.
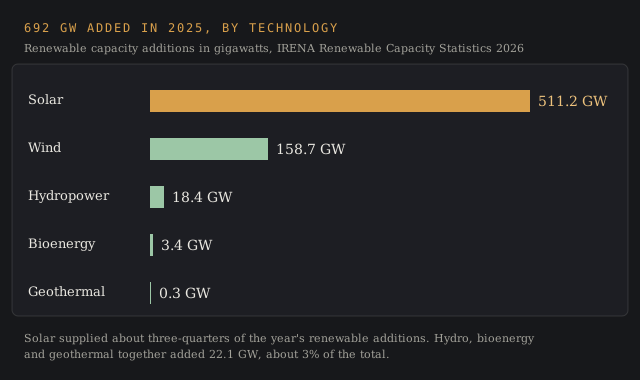
How much solar capacity went in? 511.2 GW, of which solar photovoltaics accounted for 510.3 GW, which makes solar the largest modern renewable source of new capacity. Installed solar capacity reached about 2.4 TW by the end of 2025, the largest installed capacity of any renewable source, per pv magazine's report on the IRENA data, and our solar industry statistics report breaks the solar capacity down by market.
How much wind capacity was added? A record 158.7 GW, a 14% rise in installed wind capacity, and China added 119.4 GW of it. Onshore and offshore wind farms are covered in detail in our wind energy statistics report.
Other renewable energy technologies grew slowly. Hydropower added 18.4 GW, 96% of it in China, bioenergy added 3.4 GW and geothermal energy added 0.3 GW, a drop in the bucket against solar, per the Energy Institute's summary of the IRENA report.
Asia took the lion's share, adding 513.3 GW, 74.2% of the world's new capacity installed, and holds 2,891 GW in total, 56.1% of the global figure. Europe holds 934 GW. Central America and the Caribbean hold 21 GW, the lowest of any region.
Renewable electricity generation and the global energy mix
Renewables generated 10,730 TWh in 2025, 33.8% of global electricity generation, according to Ember's Global Electricity Review 2026. Coal fell to 33.0%, below a third for the first time, so renewable generation passed coal for the first time in a century.
Solar energy generated 2,778 TWh, up 636 TWh or 30%, the largest increase on record, and solar overtook wind. Wind generation rose 205 TWh, or 8.2%. Wind power and solar power together produced 17.3% of the world's electricity generated, a share of the energy generated by power plants that was about 5% a decade ago, per the IEA.
Demand grew 849 TWh, or 2.8%, and wind and solar met 99% of that growth. Fossil fuels generated 38 TWh less than in 2024, a 0.2% fall, with coal down 63 TWh and gas up 36 TWh. The fossil side of that mix is covered in our oil and gas market intelligence guide.
The IEA's Global Energy Review 2026 puts renewable electricity generation growth at about 8.5% in 2025, and the decade before averaged roughly 6% a year. Its renewables share is 34%, up from 32% in 2024 and 23% a decade earlier. Low carbon energy sources, renewables plus nuclear, reached 43%, the highest in 50 years.
Why renewable energy statistics disagree
Ember and the IEA agree on the direction and differ on the margin. Ember counts renewables at 33.8% and coal at 33.0% for 2025. The IEA gives both renewables and coal 34% of generation. One publisher reports an overtake and the other reports a tie, so read between the lines before quoting either as the year coal lost first place. Setting two publishers side by side like this is data triangulation.
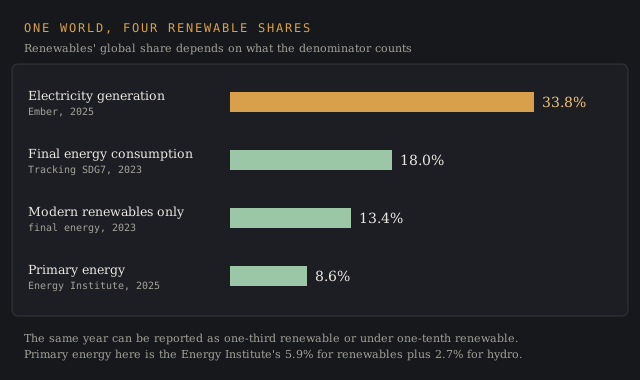
Denominators split the numbers further. Electricity is roughly 20% of final energy use, per POWER's report on the IEA outlook, so renewable energy's share of electricity generation runs far higher than its share of the total energy mix. The same 2025 world shows up as four different numbers.
Copy these lines into an email, fill them in and send. I reply with scope and a price within 2 to 3 business days.
Open the email| Measure | Renewable share | Year | Publisher |
|---|---|---|---|
| Global electricity generation | 33.8% | 2025 | Ember |
| Global electricity generation | 34% | 2025 | IEA |
| Installed power capacity | 49% | 2025 | IRENA |
| Total final energy consumption | 18.0% | 2023 | Tracking SDG7 2026 |
| Modern renewables, final energy consumption | 13.4% | 2023 | Tracking SDG7 2026 |
| Primary energy, renewables plus hydro | 8.6% | 2025 | Energy Institute |
| US primary energy use | 9% | 2025 | EIA |
UN data puts renewable sources at 18.0% of global final energy use in 2023, up from 15.6% in 2015, per the 2026 SDG report, which measures final energy use.
Excluding traditional biomass, the wood and charcoal burned for cooking and heating, modern renewables rose from 10.2% to 13.4%. Traditional biomass fuels make up the gap between the two lines, and solar is now the fastest-growing modern renewable energy source. Burning traditional biomass indoors carries local air pollution costs, so the SDG7 target tracks each modern renewable energy source separately.
The Energy Institute statistical review works in primary energy, the world's primary energy before conversion losses. Renewables, a category that covers renewable power and renewable fuels such as biofuels, made up 5.9% of primary energy in 2025 and hydropower 2.7%, per DieselNet's summary of the 2026 review, with solar at 1.7% and wind at 1.6%. Total energy supply passed 600 exajoules, up 1.7%.
Pick the measure first and the number follows, because the devil's in the details of each definition. A capacity share of 49% and a primary energy share of 8.6% describe the same world energy system, and the renewable energy statistics that circulate rarely say which one they use.
Hydroelectric power generation, wind and bioenergy
Hydropower is still the largest renewable source of electricity. Hydropower generation rose 10% to 4,578 TWh in 2024, 14.3% of global power, per the International Hydropower Association's 2025 World Hydropower Outlook. Installed hydropower reached 1,443 GW including 189 GW of pumped storage, with China at 421 GW, Brazil at 110 GW and the US third at 102 GW.
The International Hydropower Association counts 4,578 TWh of hydropower generation in 2024, up 10% and 14.3% of global power.
Hydropower generation worldwide in 2024
Source: International Hydropower Associatione.g. generation by technology in your country
Source: linked, checked, datedWind farms worldwide reached 1,136 GW of capacity at the end of 2024, with China at 521 GW and the US at 154 GW, per the Lawrence Berkeley National Laboratory's Land-Based Wind Energy Technology Update. Texas held 40.7 GW, 28% of US wind capacity, at the end of 2023, per the EIA.
Bioenergy added 3.4 GW of capacity in 2025, a 2.3% rise, per IRENA, and in the US biomass supplied 57% of renewable energy consumption in November 2025, per the EIA's Monthly Energy Review as reported by GreenTech Lead, because biofuels and wood count on top of biomass power.
Renewable energy statistics for the United States
Renewable energy sources produced about 24% of US utility-scale electricity generation in 2025, per the EIA. Wind turbines produce electricity for about 11% of utility-scale generation and 43% of renewable output, solar about 7%, and hydroelectric power generation about 6%. Nuclear supplied about 18%.
Count small-scale rooftop solar and the share rises to nearly 26%. The SUN DAY Campaign's review of EIA data puts renewables at nearly 26% of US generation and over 36% of US electricity generation capacity in 2025.
The US share of all energy use is 9%. Renewable energy sources supplied 8.83 quads of the 96.26 quads the US used in 2025, and US renewable energy production reached 9.23 quads, per the EIA's renewable energy FAQ. In 2025 fossil fuels still accounted for 82% of the total energy consumed, per the EIA's energy facts, and US emissions rose 3.2% as coal-fired power grew 13%, per the Energy Institute.
Policy changed the outlook. The One Big Beautiful Bill Act, signed on 4 July 2025, ends the federal production and investment tax credits for wind and solar projects that begin construction after 4 July 2026 unless they're placed in service by 31 December 2027, per Kirkland & Ellis. Wind and solar power plants that started construction in time keep the credit, which turned 2026 into a race against time for US developers.
Renewable energy forecasts to 2030 and 2050
The IEA's Electricity 2026 report expects renewable energy output to grow by about 1,050 TWh a year, with solar energy generation adding more than 600 TWh a year through 2030. Coal's share of power generation falls from 34% in 2025 to 27% by 2030, and renewables plus nuclear rise from 42% to 50%.
Regional energy systems and their energy mix move at different speeds, and so does energy generation from renewable technologies. The IEA puts renewables at 48% of EU generation in 2025, rising to 63% by 2030, China at 37% and approaching half, India at 24% and passing a third by 2030, and the US rising to 29% by 2030, the market to keep an eye on as the tax credits expire.
For 2050, the IEA's World Energy Outlook 2025 stated policies scenario has renewables rising from a third of electricity generation today to over half by 2035 and two-thirds by 2050. Renewable energy output grows fourfold by 2050 in that scenario. Other IEA scenarios land elsewhere, and the jury's still out on which policies hold.
Electricity demand is the wild card. Data centres and AI drive part of it, and our data center statistics report tracks that load, and the AI environmental impact statistics break out the AI share. Solar and batteries are the renewable technologies scaling fastest, per IRENA and the Energy Institute, and both renewable technologies sit closest to that new demand.
Climate change and greenhouse gas emissions
Renewable growth sits alongside record fossil use, so greenhouse gases from energy rose again in 2025, with North America behind nearly half of the growth, per OilPrice's analysis of the Energy Institute data.
The Energy Institute's 2026 review found every major energy source, coal, oil, gas, nuclear and hydro included, hit an all-time high in 2025, the second year running. Renewables were the largest source of energy supply growth for the first time outside a recession, and among renewable technologies solar supplied 71% of that increase.
Battery capacity grew 66% in 2025, per the same review, a number that flew under the radar next to the solar records. Storage lets solar energy output shift into the evening peak, which coal and gas power plants used to cover. Solar panels produce electricity only in daylight, so battery capacity decides how much solar power reaches the night. For sector-level emissions data, see our energy market intelligence guide.
Delivered for your site and your byline. Hosting here is optional.
Frequently asked questions
Is renewable energy growing in 2026?
Yes. Renewable energy sources added a record 692 GW in 2025 and generated 8.5% more electricity than in 2024, per the International Renewable Energy Agency and the IEA. The IEA expects renewable generation to keep growing by about 1,050 TWh a year to 2030.
Is Trump in favor of renewable energy?
President Trump signed the One Big Beautiful Bill Act on 4 July 2025, which ends federal tax credits for wind and solar projects that begin construction after 4 July 2026 and aren't in service by the end of 2027. The act left the phase-out of the 45X credit for solar and storage component manufacturing unchanged, per Kirkland & Ellis.
Does Elon Musk believe in renewable energy?
Tesla, which Musk runs, deployed a record 46.7 GWh of battery energy storage in 2025, up 49%, per Utility Dive. In early 2026 Tesla changed its mission statement from accelerating the sustainable energy transition to what Musk called amazing abundance, per Energy-Storage.news.
Which country is no. 1 in renewable energy?
China leads on capacity and generation. It added 440.1 GW of renewable capacity in 2025, per IRENA, and its solar output rose 336 TWh, 40%, per Ember. China's fossil generation fell 0.9%, its first fall since 2015. Its installed solar capacity grew by 378 GW(DC) in 2025, per Ember, and it added 119.4 GW of installed wind capacity, per IRENA.
What percent of the US uses renewable energy?
About 9% of the energy consumed in the US came from renewable sources in 2025, per the EIA. For electricity alone, renewables supplied about 24% of utility-scale generation, or nearly 26% counting rooftop solar.
What are 10 interesting facts about renewable energy?
- Renewables generated more electricity than coal in 2025 for the first time in a century (Ember).
- Solar generation grew 636 TWh in 2025, its largest increase ever (Ember).
- Solar overtook wind in global generation in 2025 (Ember).
- Wind and solar met 99% of the growth in global electricity demand in 2025 (Ember).
- Renewable energy sources are 49% of the world's installed capacity (IRENA).
- Asia holds 56.1% of global renewable capacity (IRENA).
- China added 119.4 GW of the world's 158.7 GW of new wind in 2025 (IRENA).
- Geothermal added 0.3 GW worldwide in 2025 (IRENA).
- Battery capacity grew 66% in 2025 (Energy Institute).
- US renewable consumption hit a record 8.83 quads in 2025 (EIA).
What percentage of energy will be renewable by 2050?
In the IEA's World Energy Outlook 2025 stated policies scenario, renewables supply two-thirds of electricity generation by 2050, up from a third today. Their share of the total energy mix stays lower, because electricity is about a fifth of final energy use today.
Bottom line
2025 set records on every renewable measure for the world's energy systems: 692 GW of capacity added, 5,149 GW installed, and a 33.8% share of global electricity that put renewables past coal. Solar did most of that work.
Quote the measure with the number. Renewables are about a third of energy generation in the power sector, under a fifth of final energy use and under a tenth of primary energy, and all three figures are correct for their own denominator.
Developers, installers and energy consultancies use reports like this one in pitch decks and client briefs.
A report on your topic for a blog page, gated content or a lead magnet.
Written for your client and published under their brand, with my name left off.
Your report on marketintelligencetools.com, with 2 to 3 CTAs carrying your sponsored links.
Default terms: the report is yours to publish, and I keep the right to republish it on this site behind a gate, outside Google's index.
Every agency, review and analysis behind these energy numbers
Capacity: irena.org (Renewable Capacity Statistics 2026, released 1 April 2026), pv-magazine.com (2 April 2026), ei-dev.energyinst.org, hydropower.org (2025 World Hydropower Outlook) and emp.lbl.gov (Land-Based Wind Energy Technology Update, 2025 edition).
Generation and the energy mix: ember-energy.org (Global Electricity Review 2026), iea.org (Global Energy Review 2026, Electricity 2026, World Energy Outlook 2025), powermag.com, unstats.un.org (2026 SDG report), dieselnet.com and energyinst.org (Statistical Review 2026), oilprice.com.
United States and companies: eia.gov (electricity, energy facts and renewable energy FAQ pages; Monthly Energy Review via greentechlead.com), renewablesnow.com (SUN DAY Campaign), kirkland.com (August 2025), utilitydive.com and energy-storage.news.
Every figure was checked against its source on 17 November 2026. Ember and the IEA publish no joint reconciliation of their 2025 coal and renewables shares, so the overtake depends on which of the two you quote.