Wind energy statistics for 2026: capacity, generation, costs and jobs
 By Jan Suski. I go deep on every review, checking every number against its source and digging up details other coverage misses, a habit from six years of SEO and link building for tech companies. Bylines at Surfer, Brand24, and Senuto. How the scoring works.
The numbers Global and US wind power, checked 7 October 2026
China took the lion's share of 2025's record: 120.5 GW of the 165 GW in GWEC's count, and 119.4 GW of 158.7 GW in IRENA's.
Wind generation grew 205 TWh in 2025, just under one-third of solar's 636 TWh increase in Ember's data.
Offshore wind power is 7.1% of the global fleet and runs $105-$167/MWh in Lazard's 2026 range, against $37-$99 for onshore.
The world added a record 165 GW of wind power in 2025, a 40% jump on 2024, according to the Global Wind Energy Council's Global Wind Report 2026 (20 April 2026). Wind turbines generated 2,715 TWh of electricity that year, 8.5% of the world's supply, in Ember's Global Electricity Review 2026.
Those two numbers come from different houses, and the houses disagree. Five publishers put 2025 wind additions between 158.7 GW and 169 GW, and three put wind's share of world electricity anywhere from 8.5% to more than 11%. Every figure on this page comes straight from the horse's mouth: it links to the body that published it, with the report title and release date.
The page is built for analysts, investors, procurement teams and businesses that quote wind energy statistics in models and board decks. It covers global and U.S. wind capacity, offshore wind, state shares, turbine reliability, power prices, jobs and the 2030 forecasts, and it names the source behind each number.
Global wind capacity in 2025
GWEC counts 28,395 wind turbines installed in 2025 across 57 countries, one every 18 minutes and 31 seconds, on its Global Wind Day 2026 page. Onshore projects took 155.3 GW of the 165 GW total, up 42%. Offshore wind added 9.3 GW, up 16%. Total capacity reached 1,299 GW, and 138 countries now generate electricity from wind power.
Asia-Pacific installed 131.8 GW, 80% of the global market. The rest of the world split the remainder:
- Europe: 19.1 GW
- North America: 7.3 GW
- Latin America and the Caribbean: 3.7 GW
- Africa and the Middle East: 2.6 GW
Five markets made up 86% of 2025 additions in GWEC's data. India nearly doubled its pace, from 3.4 GW in 2024 to 6.3 GW, an 86% rise. Ember groups the top four (China, India, the United States and Germany) at 82% of installations.
| Country | Wind added in 2025 | Installed capacity, end-2025 |
|---|---|---|
| China | 120.5 GW | 640.5 GW |
| United States | 6.9 GW | 161.2 GW |
| India | 6.3 GW | 54.5 GW |
| Germany | 5.7 GW | 77.7 GW |
| Brazil | 2.3 GW | 36.0 GW |
IRENA's count is net of retirements. Its Renewable Capacity Highlights 2026 records 158.7 GW of new wind in 2025, which lifted the world's installed wind capacity 14.0% to 1,291 GW. Renewables grew 692 GW (+15.5%), and solar & wind took 96.8% of that renewable energy.
Where the wind energy data sources disagree
The devil's in the details of each house's methods. GWEC tallies new installations, IRENA publishes net additions after decommissioning, and Ember and the WWEA run their own counts. The IEA rounds its figure to "around 160 GW" in the Global Energy Review 2026.
| Publisher and report | Released | World, 2025 | China, 2025 |
|---|---|---|---|
| IRENA, Renewable Capacity Highlights 2026 | 31 Mar 2026 | 158.7 GW | 119.4 GW |
| IEA, Global Energy Review 2026 | Apr 2026 | ~160 GW | 117 GW |
| GWEC, Global Wind Report 2026 | 20 Apr 2026 | 165 GW | 120.5 GW |
| Ember, Global Electricity Review 2026 | 21 Apr 2026 | 167 GW | 119 GW |
| WWEA, Annual Report 2025 | 1 Apr 2026 | 169 GW | 130 GW |
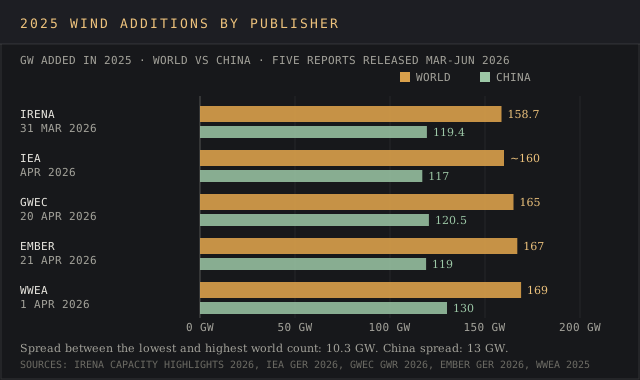
China drives most of the gap. The WWEA's 130 GW sits 13 GW above the IEA's 117 GW, a difference larger than Germany's 5.7 GW and Brazil's 2.3 GW combined. The WWEA also reports a growth rate of 14.3% for the global fleet, up from 11.9%, against IRENA's 14.0%.
The end-of-year totals split three ways:
- WWEA: more than 1,346 GW, with 1,500 GW expected during 2026
- GWEC: 1,299 GW
- IRENA: 1,291 GW
Share of electricity depends on the denominator. Ember measures wind at 8.5% of global generation. GWEC's figure is 9.5% of the "global electricity mix". For example, the WWEA says wind "generates close to 3000 TWh, more than 11% of world demand". Any analysis that blends these numbers in one model should log each publisher, a habit covered in our guide to data source attribution techniques.
Wind generation and its share of electricity
Electricity generated by wind reached 2,715 TWh in 2025 in Ember's count, up 205 TWh, or 8.2%, on the previous year. Wind generation has roughly doubled since 2018, when wind farms produced 1,268 TWh. The 2025 increase by country:
- China: +138 TWh (+14%), the largest growth of any country
- India: +22 TWh, its largest single-year rise
- United States: +12.5 TWh, 59% below 2024's 31 TWh gain
- Brazil: +9.1 TWh
Weather cut into Europe's wind energy output. The IEA cites "lower-than-normal wind speeds, particularly in Europe" for 2025, yet solar PV and wind still reached 30% of EU generation and passed fossil fuels for the first time. Worldwide, wind and solar, the two fastest-growing renewables, supplied 17% of electricity generation, up from 15% in 2024.
Demand is pulling more energy onto the grid. The IEA's key findings put global electricity demand growth near 3% in 2025, and in the United States data centres made up half of all growth in electricity use. That new load draws on the same electricity supply that wind and other renewables feed into the grid, and our AI environmental impact statistics track it in detail.
WindEurope's 2025 statistics (26 February 2026) list the country with the highest wind share in Europe as Denmark, which gets 50% of its electricity from wind power. Lithuania & Ireland follow at 33%, the UK at 31% and Sweden at 30%.
Offshore wind and floating offshore wind
Offshore wind power is a drop in the bucket next to onshore. The GWEC Global Offshore Wind Report 2026 counts 9.3 GW grid-connected in 2025, 6.6 GW of it in China and nearly 2 GW in Europe across three markets. Offshore installed capacity reached 92.5 GW, 7.1% of all wind, spread across 19 markets, and GWEC says it can generate enough electricity to power the equivalent of 102 million homes.
Five markets hold 90.3% of the world's offshore wind: China, the UK, Germany, the Netherlands and Taiwan. Turbine size is one example of the gap: offshore turbines installed in 2025 averaged 10.3 MW, against 3.8 MW for U.S. land-based units. In the EU, the IEA reports offshore additions fell to 1 GW from 1.7 GW, with France and Germany the only installers.
Floating offshore wind is smaller still. RenewableUK's floating offshore wind pipeline report (11 November 2025) counts 277 MW operating across 16 projects in seven countries. Only 25 MW was commissioned in 2025, at the PGL project in France. The pipeline holds 221 GW, but RenewableUK expects nearly 2.5 GW operating by the end of 2030.
Developers have been skating on thin ice in the U.S. Ørsted's 2025 annual report (6 February 2026) says Revolution Wind and Sunrise Wind both received suspension orders on 22 December 2025. A federal court granted injunctions on 12 January and 2 February, and work restarted. The Danish energy company raised about DKK 60 billion in a rights issue and runs 10.2 GW of offshore capacity with 8.1 GW under construction.
U.S. offshore wind installed capacity stood at 971.3 MW at the end of July 2026 in the EIA's Electric Power Monthly. Two projects are due online in 2026, per the EIA's capacity outlook: Vineyard Wind 1 (800 MW) and Revolution Wind (715 MW).
U.S. wind power capacity and generation
Wind farms in the United States generated about 464 billion kWh in 2025, up from 6 billion kWh in 2000, according to the Energy Information Administration's Wind explained page. That was 10.5% of utility-scale electricity generation. The Lawrence Berkeley National Laboratory puts the 2025 share at 10.3% in its annual wind energy technology review, the Land-Based Wind Energy Technology Update: 2026 Edition (August 2026).
Wind has been the leading source of renewable energy in the country since 2019. That year U.S. wind generation hit 300 million MWh and passed hydropower, the previous top renewable energy source, by 26 million MWh, the EIA reported in February 2020.
The utility-scale wind fleet reached 165,461.3 MW at the end of July 2026, 12.6% of the country's 1,315,876.2 MW of utility-scale electricity generation capacity. Onshore wind makes up 164,490.0 MW of it. Wind ranks fourth among sources, behind natural gas at 516,453.3 MW, coal at 167,790.5 MW and solar at 166,702.2 MW. The EIA's time-adjusted series shows U.S. wind capacity grew from 74,162.7 MW in 2016 to 154,574.1 MW in 2025, more than double.
Annual additions have slowed. Developers added more than 14 GW in both 2020 and 2021, and 6.9 GW in 2025 in LBNL's count, which puts land-based wind capacity at 161 GW. The EIA says 11.8 GW is expected in 2026, 14% of all planned additions, led by the 3,650 MW SunZia Wind project in New Mexico, the largest onshore wind project in the U.S.
Tax credits set the clock. Sections 45Y and 48E, the clean electricity credits renewables projects claim, came from the Inflation Reduction Act of 2022, and the One Big Beautiful Bill Act ends them for wind and solar placed in service after 31 December 2027 unless construction began by 4 July 2026, per IRS Notice 2025-42. That put a hard date on the future of the credits, and developers in the queue ran it down to the wire.
Wind energy data by state
Texas generates the most wind power of any state, with about 42,300 MW of wind turbines at the end of 2024 supplying 22% of in-state generation, the EIA's Texas profile shows. Iowa ranks second by output and first by share. Zero in on share and the plains states lead the list.
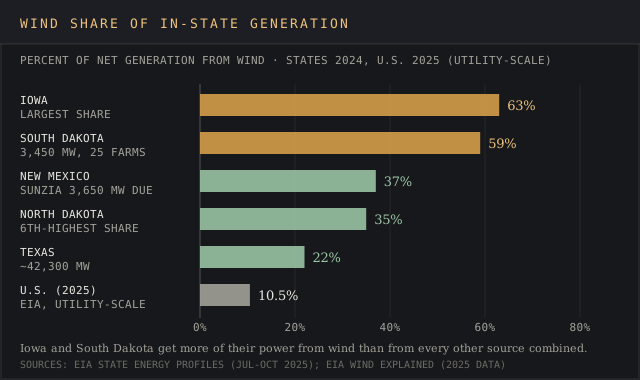
The list below is the text version of the chart.
- Iowa: 63% of 2024 net generation, the largest wind share of any state
- South Dakota: 59%, second after Iowa, from 3,450 MW at 25 active wind farms (EIA)
- New Mexico: 37%, with a 522 MW facility as the state's largest power plant (EIA)
- North Dakota: 35%, the sixth-highest share, from about 4,500 MW at the start of 2025 (EIA)
Renewable energy supplied 40% of North Dakota's in-state electricity in 2024, almost all of it wind. In South Dakota, renewable energy produced 81%, and the 300 MW Deuel Harvest project is the biggest of the state's existing wind farms.
The American Clean Power Association says wind provides a quarter of the electricity in nine states, and the U.S. Wind Turbine Database (version 7.2, 20 November 2024) maps 74,695 turbines across 45 states plus Guam and Puerto Rico, with interactive maps for each site.
Wind turbines: size, output and failure rates
Wind turbines generate electricity by turning the kinetic energy of moving air into rotation, and a generator in each nacelle converts that rotation into power sent down power lines to the grid, the EIA explains. Bigger rotors catch more energy. In LBNL's 2026 update, land-based turbines installed in the U.S. in 2025 averaged 3.8 MW, with a 102 m hub height and a 141 m rotor diameter.
Capacity factors set how much electricity a wind farm delivers. American turbines ran at 34.2% in 2025 in EIA Table 6.07.B, against 91.0% for nuclear and 24.4% for solar PV. Projects built in 2024 reached 37.1% in LBNL's sample, against 34% fleet-wide.
Failure rates depend on how a failure is defined, so a single headline rate is a red flag. A 2023 University of Strathclyde study, "On the sensitivity of wind turbine failure rate estimates to failure definitions", found a baseline of 9.06 failures per turbine per year, falling to 7.47 with an assembly restriction and ranging from below 1 to over 10 across definitions.
Frequency converters, the power electronics that control what each generator sends to the grid, failed about once per turbine per year, and cooling systems about 0.9 times. Gearboxes, blades, yaw systems & hydraulics round out the parts that fail most often on wind turbines.
Wind energy costs
Onshore wind is among the cheapest new power in Lazard's LCOE+ 2026 (Version 19.0). Its unsubsidized range of $37-$99/MWh overlaps utility solar at $40-$98 and undercuts gas combined cycle at $51-$129. Utility-scale solar's floor sits $3 higher than wind's. With the production tax credit, onshore wind power drops to $11-$81/MWh.
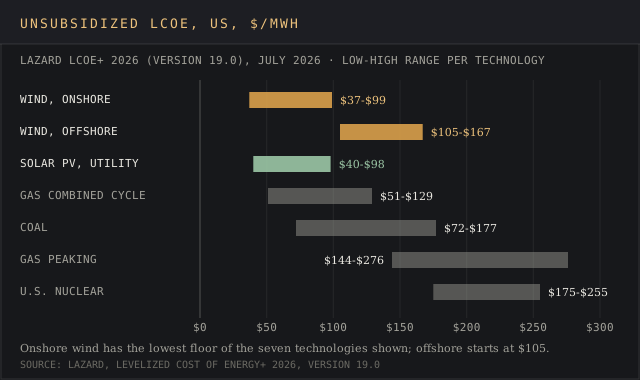
Offshore wind costs an arm and a leg by comparison: $105-$167/MWh. Among fossil fuels, coal runs $72-$177 and gas peaking $144-$276; U.S. nuclear runs $175-$255. Lazard assumes capacity factors of 30% to 55% onshore and 45% to 55% offshore.
Costs have fallen since 2010. IRENA's wind energy page records the global weighted average for onshore wind falling 56% between 2010 and 2020, from USD 0.089/kWh to USD 0.039/kWh. Its July 2025 cost release put onshore wind at USD 0.034/kWh in 2024, 53% cheaper than the fossil fuels alternative. IRENA says 91% of new renewables projects commissioned in 2024 came in cheaper than any new fossil fuel option.
Installed costs for U.S. land-based projects averaged $2,100/kW in 2025, with turbine prices near $1,100/kW, in LBNL's data. For teams pricing projects, our guide to energy market intelligence lists the providers that track renewables prices.
Wind industry jobs and businesses
The land-based wind energy industry supports over 383,000 U.S. jobs, counting direct, indirect and induced positions, the American Clean Power Association says. The U.S. wind industry employs veterans at 9%, against a national average of 5%. Wind supplies enough power to serve the equivalent of more than 48 million American homes, by ACP's count. Land-based projects paid more than $2.7 billion in state and local taxes and land-lease payments last year.
Wind turbine technicians, who install and repair turbines, rank fourth on the Bureau of Labor Statistics list of fastest growing occupations, with 30% growth projected for 2025-35. Nurse practitioners (41%), solar PV installers (37%) and data scientists (35%) rank higher. The BLS profile counts 11,800 technician jobs in 2025 at a median $64,120.
Globally, GWEC counts 1.5 million wind workers and says 628,000 technicians will be needed between 2025 and 2030. WindEurope counts 443,000 people in European wind and projects 607,000 by 2030.
Manufacturers are on a roll. Vestas, which builds turbines in onshore and offshore models, reported 2025 revenue of EUR 18,822 million and 16.3 GW of order intake in its annual report (5 February 2026), with a combined backlog of EUR 71.9 billion and 2026 revenue guidance of EUR 20-22 billion. Developer data and filings like these feed the Enverus and Energy Aspects platforms we review.
Wind power forecasts to 2030
For the future, GWEC expects 969 GW of new wind from 2026 to 2030, an average of 194 GW a year and a 5.2% compound growth rate. On that path the global fleet passes 2 TW by 2029. GWEC's stated goal is tripling to 3 TW by the end of the decade. Keep an eye on the gap between that 194 GW yearly average and the 165 GW built in 2025.
The WWEA sets the bar higher, targeting 10,000,000 MW to cover 40% of demand, which it says needs 350,000 MW of growth per year. Europe plans its own renewables build-out:
- Europe: 151 GW of new wind in 2026-2030, reaching 439 GW
- EU: 112 GW, or 22 GW a year, reaching 343 GW
- Financing: EUR 45 billion in 2025, covering 20.9 GW
In the U.S., the ACP counts nearly 24 GW of land-based wind in the pipeline at the end of Q2 2026, more than $48 billion in investment. Energy security is part of the case: GWEC says UK offshore wind saved at least £30 billion in imported fuel costs over 25 years. For the parallel solar outlook, see our solar industry statistics.
Frequently asked questions
What are 5 facts about wind energy?
Here are five wind power facts with sources. The world added 165 GW in 2025 (GWEC). Wind generated 2,715 TWh, 8.5% of global electricity (Ember). China installed 120.5 GW of the total (GWEC). Iowa generates 63% of its electricity from wind (EIA). Onshore wind costs $37-$99/MWh unsubsidized (Lazard).
Which country is no. 1 in wind energy?
China. Its total capacity reached 640.5 GW at the end of 2025 after it added 120.5 GW that year, per GWEC. The United States is second with 161.2 GW.
Is wind energy growing or declining?
Growing. Wind capacity grew by a record 165 GW in 2025, 40% above the previous year, and generation rose 8.2%. Wind and solar took 96.8% of renewables added that year (IRENA). U.S. growth slowed: 6.9 GW added in 2025, against more than 14 GW in 2020 and 2021.
What is the biggest problem with wind turbines?
Variable output from wind power. American wind turbines averaged a 34.2% capacity factor in 2025, against 91.0% for nuclear, so wind farms need backup supply or storage on the grid. Curtailment reached 9% in the SPP region in 2025 in LBNL's data.
What are 21 interesting facts about wind energy?
The tables above hold more than 21 sourced wind energy data points, from 28,395 turbines installed in 2025 to 277 MW of floating wind in operation. Each one links to the publisher.
What is the failure rate of wind turbines?
Between below 1 and over 10 failures per turbine per year, depending on the definition, in the 2023 Strathclyde study. Its baseline estimate is 9.06. Frequency converters and cooling systems on turbines fail most often.
Bottom line
Wind power added more gigawatts in 2025 than in any year before, and China installed about three-quarters of it. The counts behind that statement run from 158.7 GW to 169 GW depending on the publisher, so any model built on wind energy statistics should name its source and stick to it.
In the U.S., wind supplies about a tenth of electricity, and Iowa and South Dakota generate more than half of theirs from it. The tax-credit deadline in the One Big Beautiful Bill Act shapes what gets built after 2027. Onshore wind stays at the bottom of Lazard's cost range, while offshore wind stays expensive and concentrated in five markets.
The councils, agencies and filings behind each wind figure, and when the 2026 counts land
Global capacity and generation: gwec.net (Global Wind Report 2026, 20 April 2026; Global Wind Day 2026; Global Offshore Wind Report 2026, June 2026), irena.org (Renewable Capacity Highlights 2026, 31 March 2026; cost release of July 2025), ember-energy.org (Global Electricity Review 2026, 21 April 2026), iea.org (Global Energy Review 2026, April 2026), wwindea.org (Annual Report 2025, 1 April 2026) and windeurope.org (2025 statistics, 26 February 2026).
United States: eia.gov (Today in Energy, 20 March 2026; Electric Power Monthly tables 6.01 and 6.07.B; state profiles for Iowa, Texas, South Dakota, New Mexico and North Dakota; Wind explained), emp.lbl.gov (Land-Based Wind Energy Technology Update, 2026 Edition, August 2026), energy.usgs.gov (U.S. Wind Turbine Database, version 7.2, 20 November 2024), irs.gov (Notice 2025-42), cleanpower.org and bls.gov (Occupational Outlook Handbook, 2025-35 projections).
Costs, offshore and companies: lazard.com (LCOE+ 2026, Version 19.0, July 2026), renewableuk.com (floating offshore wind pipeline, 11 November 2025), orsted.com (2025 annual report, 6 February 2026), vestas.com (2025 annual report, 5 February 2026) and strathprints.strath.ac.uk (University of Strathclyde failure-rate study, 2023).
Every figure was checked against its source on 7 October 2026. IRENA, the WWEA, GWEC and Ember published their 2025 counts between 31 March and 21 April 2026, so the 2026 totals are due in spring 2027, and the 2026 to 2030 figures here are forecasts.