Secondary data: types, sources and the fitness checks to run before you use it
 By Jan Suski. I go deep on every review, checking every number against its source and digging up details other coverage misses, a habit from six years of SEO and link building for tech companies. Bylines at Brand24 and Senuto. How the scoring works.
The short version 11 points · 40 seconds
- 01The original purpose limits what secondary data answersSomeone else collected it for their own question
- 02One dataset is primary to its collector, secondary to youBLS runs it, a market researcher reuses it
- 03Seven types cover most secondary research dataInternal records to qualitative archives
- 04NAICS 2022 moved 68,000 jobs out of retail tradeElectronic shopping went to managing offices
- 05A March 2024 payroll level fell by 598,000 jobsThe August 2024 estimate said 818,000
- 06ACS 1-year estimates exist only for 65,000+ areasSmaller towns get only the 5-year estimate
- 07County Business Patterns hides small cellsPublished only with three or more establishments
- 08Google Trends reports a normalized 0 to 100 index50 in Poland and 50 in Germany differ in volume
- 09Eurostat data on the US is for non-commercial useAccess and reuse permission are separate
- 10Old archives carry the questions of their eraPSID began in 1968, Edwardians in the 1960s
- 11Log each fitness check before the analysis startsRecord the release and definition used
Secondary data is data that someone else collected for a purpose of their own, which you then reuse to answer new research questions. A census table, a payroll survey, a sales ledger and archived interview transcripts all qualify once their builders publish or share them.
This page covers what makes data secondary, the seven types you'll find in secondary research, and six fitness checks that follow from the original collection purpose. It's written for researchers who already know how secondary research differs from primary research and now need an understanding of the dataset itself. A credible publisher can still hand you a number collected for the wrong research question.
What makes data secondary
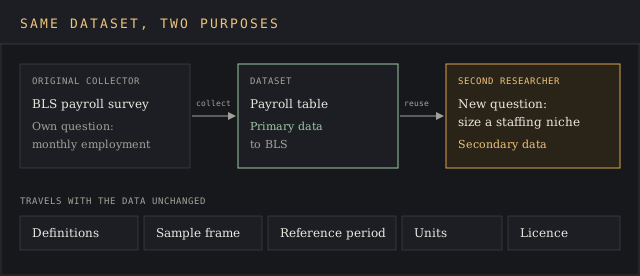
Data turns secondary when it's reused for a purpose other than the one it was originally collected for. The Bureau of Labor Statistics runs its payroll survey to estimate monthly employment. For BLS that's primary data collection. For a market researcher sizing a staffing niche, the same table is secondary data, and the researcher inherits every design choice BLS made.
Understanding that inheritance is the whole subject. The collector's data collection process fixed the definitions, the sample frame, the time period and the units long before your research questions existed. Secondary data may answer your research questions cleanly, or it may answer a neighboring question that only looks like yours. The devil's in the details of the codebook.
Internal secondary data includes CRM exports, invoices, support tickets and other records your organization keeps for operations. External secondary data comes from outside, from a statistics agency, a vendor or a university archive. Both kinds can be quantitative or qualitative, and the difference between qualitative and quantitative research carries over to the checking process.
Collecting primary data means running the data collection yourself. Collecting secondary data means picking among answers that already exist, and the advantages are speed and cost. Primary research takes months of fieldwork, and the rest of this page builds an understanding of what that control is worth.
Seven types of secondary data and what each was collected for
Every type below carries a different original purpose, and that purpose predicts what an evaluation will find. The next lesson, on sources of secondary data with examples, catalogs where to find each one.
| Type | Example | Collected to | First thing to check |
|---|---|---|---|
| Internal records | CRM and billing exports | Run operations and invoice customers | Field definitions that changed when the system did |
| Published statistics | BLS payroll survey, ACS census data | Measure the economy and population | Vintage, revisions and geographic thresholds |
| Administrative records | Unemployment insurance tax filings | Collect taxes or pay benefits | Who is legally excluded from filing |
| Commercial panels | Syndicated retail or audience panels | Sell measurement to paying clients | Panel recruitment and licence terms |
| Academic datasets | Panel Study of Income Dynamics | Answer the original study's hypotheses | Variables measured and the research design |
| Digital trace data | Google Trends, web traffic panels | Run a product, then expose a slice | Units, sampling and normalization |
| Qualitative archives | Archived interview transcripts | Serve the original project's questions | Interview guide and consent scope |
Common secondary data sources include government publications, journal articles, books and scholarly literature, along with other sources such as trade bodies. Statistics agencies document the research methods behind their economic data in full. BLS benchmarks its payroll survey to unemployment insurance tax records covering about 97 percent of in-scope employment, according to its 2024 benchmark article.
Commercial panels and digital trace data dominate secondary research in markets, and they're the hardest to analyze. A vendor's panel was built to sell to clients, so recruitment rules and weighting stay under the radar unless the contract demands access to them. The alternative data providers ranking compares vendors on what they disclose about method. Media monitoring tools that track mentions across platforms produce the same trace data.
Academic datasets come with the fullest documentation of their data collection and the oldest research questions. The Panel Study of Income Dynamics began in 1968 with roughly 5,000 families and reached more than 9,100 families and 24,500 individuals by 2023. Longitudinal data like that lets a researcher analyze five decades of change in social science research at once.
Why a credible source can still give you the wrong data
The checks on source credibility tell you a figure came from a careful agency. Fitness evaluation asks what that agency collected, when, and for whom.
Social research and public health studies document the advantages of secondary data analysis well. It saves the time and money that primary research would take, reaches populations no small team could survey, and spares groups that are already over-researched one more round of surveys.
Researchers use it to compare regions and populations, benchmark a company against industry figures, trace historical trends, examine more variables than one survey collected, and generate hypotheses before primary research adds context. You don't need to spend money on fieldwork to analyze 40 years of household income data, and full text archives turn a time consuming literature review into a week of reading.
The limitations inherent in reuse are just as fixed. You have no control over the quality of the data collected, variables you need may never have been measured, and demographic data may be incomplete. Secondary data analysis is also limited to observational and retrospective research design, because nobody can go back and randomize a 2019 survey. Data may be outdated by the time you find it.
In secondary data analysis the costly errors come from a variable that keeps its name while its meaning changes. The six checks below, one per inherited design choice, address it.
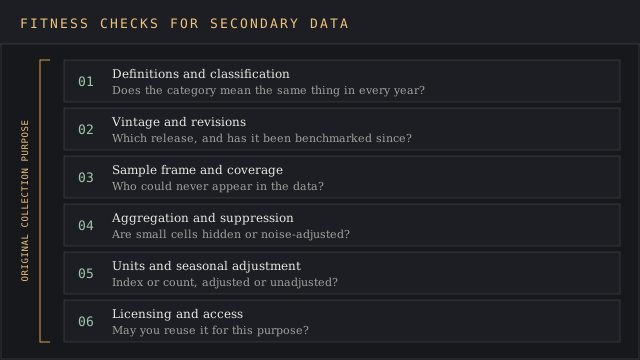
Six fitness checks that come from the original data collection
Definitions and classification changes
Industry codes get rewritten, and a series that crosses the change can jump with no change in the economy. NAICS 2022 removed the distinction between store and nonstore retailers and cut retail trade's three-digit industries from 12 to 9, according to a September 2023 article in the BLS journal Monthly Labor Review by BLS economists Shane Haley and Kennedy Keller.
About 15 percent of electronic shopping employment, roughly 68,000 jobs, moved out of retail trade into corporate managing offices in professional and business services. An e-commerce researcher who stitches a 2017-basis series to a 2022-basis one is comparing two different industries under one label, and the growth rate will miss the mark.
Vintage and revisions
Most official economic research data is published early and corrected later, so a first estimate is rarely set in stone and the evaluation of any figure starts with its release date. Log the vintage of every number you find in the evaluation.
Sample frame and coverage
Surveys can only describe the population their data collection could reach. The Census Bureau's American Community Survey guidance publishes 1-year estimates only for areas with 65,000 or more people, and 1-year supplemental estimates for areas of 20,000 or more. For smaller towns the only available data is the 5-year estimate, the most reliable and least current.
A market analysis of a 30,000-person town that wants 2024 detail is reading a five-year average, and the table header is the only source of that warning. Sampling bias in the original study passes straight through to every secondary analysis of it, and reweighting can't add respondents the frame never contained.
Aggregation level and suppression
Agencies hide or blur small cells to protect respondents. Under the County Business Patterns methodology, a cell is published from reference year 2017 only if it holds three or more establishments. From reference year 2007 the Bureau also infused noise, flagging values changed by 5 percent or more with a J.
That page now carries a notice that it is no longer current, because a Commerce Department administrative order prohibits noise infusion and the Bureau is evaluating alternatives. Keep an eye on method pages as closely as the tables.
Units and seasonal adjustment
The evaluation of units comes before comparing a series with any other data source. Google's Trends documentation says each data point is divided by total searches for its time and place, then scaled from 0 to 100, using a sample of searches, with low-volume terms shown as 0. Analyze a Trends score of 50 in Poland against 50 in Germany and you're comparing two different search volumes.
Adjusted and unadjusted versions of one series differ by design, and mixing them across years invents a trend.
Licensing and access terms
Access to research data and permission to reuse it are separate questions. Eurostat's reuse policy allows free reuse with attribution, and it restricts data on countries outside the EU, EFTA and candidate countries, such as the US, Japan or China, to non-commercial use.
A consultancy reselling a market analysis built on that data is skating on thin ice, with a licensing problem baked into the inputs. The market data pricing report covers what redistribution rights add to a commercial licence.
Worked example: one payroll figure revised by 598,000 jobs
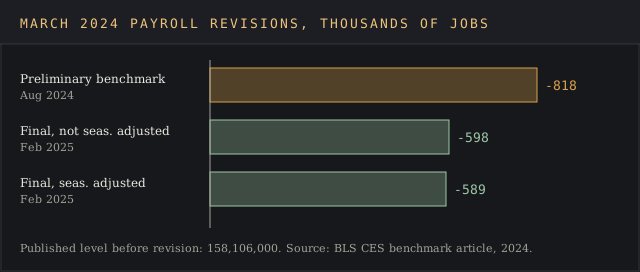
On 21 August 2024, BLS published its preliminary benchmark revision for its payroll survey. It estimated that March 2024 total nonfarm employment was overstated by 818,000 jobs, or 0.5 percent. The benchmark comes from state unemployment insurance tax records, a separate data source.
The final revision arrived on 7 February 2025 with the January 2025 data. Not seasonally adjusted, March 2024 employment came down by 598,000, or 0.4 percent, from a published level of 158,106,000. Seasonally adjusted, the cut was 589,000. Twenty-one months of unadjusted estimates were revised in one benchmark process.
Picture a researcher whose mid-2024 analysis sized a staffing market from then-current payroll growth. Every input was official, every link pointed to bls.gov, and the source passed any credibility test. The figure was still about 600,000 jobs too high, a gap BLS first flagged on 21 August 2024.
Three of the six checks would have flagged it in any secondary analysis. The vintage was pre-benchmark. The adjusted and unadjusted cuts differ by 9,000 jobs, so the seasonal basis matters. Coverage comes from a benchmark frame of about 97 percent of in-scope employment, set once a year. When two sets of numbers disagree like this, data triangulation covers how to reconcile them.
Running secondary data analysis against a fixed question
The secondary data analysis process begins with research questions written down before collecting secondary data. Without them, a researcher ends up barking up the wrong tree and quietly bending the question to fit the first available secondary data. Researchers often refine questions to the available data, and each change belongs in the log.
- Write the research questions and the population, period and unit they address.
- Find candidate datasets, get access, and read each codebook first.
- Run the six fitness checks as a written evaluation and note every mismatch.
- Refine the question where the data forces it, and say so in the write-up.
- Analyze the data and cite the exact release and vintage used.
Qualitative data collected for one project needs the same steps plus an evaluation of its context. The UK Data Service gives access to hundreds of social research collections, among them the Edwardians study, with 453 transcribed life story interviews drawn from 537 recorded in the late 1960s and early 1970s. Qualitative analysis of those transcripts can answer new research questions, but only ones the original interview guide happened to touch.
The data source attribution techniques lesson covers citation method, and a market intelligence analysis built on unlogged versions can't be rerun. Treat the log as part of the market intelligence strategy that pays for the work.
FAQ
What is secondary data, with examples?
Secondary data is data collected by someone else for another purpose and reused for your own research. Examples of secondary data include census data, BLS employment statistics, a company's past sales records, journal datasets and archived interview transcripts.
What is primary and secondary data?
Primary data is collected first-hand for the research project at hand, through surveys, interviews or experiments. Secondary data is existing data collected earlier for a different purpose, and secondary analysis reuses it.
What are 10 examples of secondary sources?
Common sources in secondary research include census tables, labor statistics, administrative tax records, company filings, trade association reports, journal articles, books, syndicated panels, search trend data and qualitative archives. The next lesson lists where to find these secondary sources.
What are 5 disadvantages of secondary data?
The collector controlled the method, so its errors pass to you. Secondary data may use definitions that don't match your question, revisions change published figures, the sample frame leaves coverage gaps, and licence terms restrict reuse. The BLS 2024 benchmark cut a published payroll level by 598,000 jobs.
Is secondary data quantitative or qualitative?
It can be either, and secondary data analysis can use quantitative or qualitative methods. Published statistics and panel data are quantitative data, while archived transcripts, diaries and field notes are qualitative data that suit qualitative research methods such as thematic coding.
What are the advantages of secondary data?
The advantages are lower cost, faster access than primary data collection, samples larger than a small team could survey, and longitudinal data such as PSID's 1968 to 2023 run. Reused data yields valuable insights once the fitness checks pass.
Is secondary data free?
Much government data from national surveys is free to access and download, including ACS and County Business Patterns tables, and published reports sit online or in university libraries. Commercial panels and syndicated data require paid access, and even free data can carry reuse limits, as Eurostat's non-commercial rule for non-EU country data shows.
Bottom line
In secondary research, the data always arrives with someone else's purpose attached. That purpose fixed the definitions, frame, release schedule, units and licence before your question existed.
Collecting secondary data without the fitness evaluation cuts corners that fail quietly. A market estimate built on a pre-benchmark payroll figure, a pre-2022 retail code or a five-year average read as current will look sourced and still be wrong by 598,000 jobs or a whole category.
The next lesson in this path, on running desk research with a source log and stopping rule, turns these checks into a working method.