Secondary data examples: named datasets sorted by the business question they answer
 By Jan Suski. I go deep on every review, checking every number against its source and digging up details other coverage misses, a habit from six years of SEO and link building for tech companies. Bylines at Brand24 and Senuto. How the scoring works.
The short version 11 points · 40 seconds
- 01Each example is a named dataset with a publisherGrouped by the business question it answers
- 02Market size starts in the Economic Census and BEA tablesPlus 1,400 World Bank indicators and Eurostat
- 03Company counts come from CBP, SUSB and Nonemployer StatisticsONS counted 2,786,985 UK businesses in 2026
- 04The average US consumer unit spent $81,905 in 2025BLS CE Surveys, with demographics from the ACS
- 05Competitor disclosures sit free in SEC EDGARFull-text search reaches back to 2001
- 06QCEW counts more than 95% of US jobs by countyFRED has 853,000 series, Comtrade runs from 1962
- 07Search interest and opinion come from Trends and Pew filesJournal articles feed reviews and meta analyses
- 08Read the terms before buying paid secondary dataStatista Starter is $199 a month, billed yearly
- 09Internal records collected to run the business count tooGA4 keeps user-level data for 2 or 14 months
- 10Three free datasets size the US budget gym marketAbout $21.23 per Planet Fitness member a month
- 11Secondary data can't change how the data was collectedSo the research question bends to the dataset
Secondary data examples are datasets originally collected by someone else, for their own purpose, that you reuse to answer a new question, such as a census table, a 10-K, a survey file or last year's support tickets. If the definition is new, start with what secondary data is and where its limits sit, then come back here.
This page is a catalogue for collecting secondary data. Each entry names the dataset, the publisher, what it measures, how often it updates and what it costs, checked by the same method on the publisher's own page in November 2026. Entries are grouped by business question, because a researcher starts from a research question and works back to the data.
It's written for analysts, founders and students doing desk research who need named sources fast. Expect a summary table, eight groups of datasets, a worked gym-market example and the limits to check before citing any of them.
Sources of secondary data, sorted by the question each one answers
Secondary data splits into two groups by origin. External secondary data is collected by someone outside your organization, such as a statistics agency, a regulator or a research firm. Internal secondary data comes from your own systems, such as CRM exports, invoices, support logs and web analytics.
The overview of secondary market research lists those categories in the abstract. The table below goes one level down to named secondary data sources, one per research question, and the sections after it add the rest.
| Research question | Dataset | Publisher | Cadence | Cost |
|---|---|---|---|---|
| How big is the market? | Economic Census | US Census Bureau | Every five years | Free |
| How many companies exist? | County Business Patterns | US Census Bureau | Annual | Free |
| What do households spend? | Consumer Expenditure Surveys | Bureau of Labor Statistics | Annual | Free |
| What do competitors disclose? | EDGAR filings (10-K, 10-Q) | SEC | As filed | Free |
| What crosses borders? | UN Comtrade | United Nations | As countries report | Free tier, premium paid |
| What are people searching? | Google Trends | Near real time | Free | |
| What do people think? | American Trends Panel | Pew Research Center | Per wave | Free account |
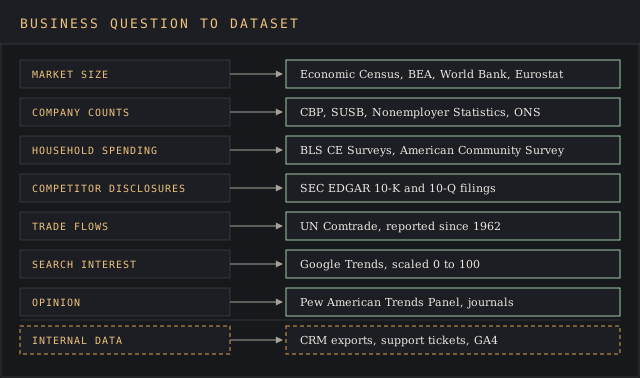
Most of this public data sits on government websites and is easily accessible. Collecting secondary data from them takes hours, and that time saving is the plain case for starting here. Primary data collection on the same question is time consuming, and it would spend money and staff resources for weeks.
How big is the market: census data and national accounts
The Economic Census is the Census Bureau's official five-year measure of US businesses, and the 2022 edition is the current one. It publishes product and service statistics under the North American Product Classification System, plus establishment size, concentration and legal form. Data collected for current economic indicators is measured against that benchmark.
For quarterly research, the Bureau of Economic Analysis publishes GDP by industry with the third estimate of GDP each quarter. The September 30, 2026 release put second-quarter real GDP growth at a 2.2% annual rate.
Outside the US, Eurostat's Structural Business Statistics cover the business economy in NACE sections B to N and P to R, broken down by enterprise size class. For country comparisons, the World Bank's World Development Indicators hold about 1,400 time series for 217 economies, many going back more than 50 years, long enough for trend analysis. That's longitudinal data a single research project would need decades to collect.
These sources give a researcher the denominator for a niche product, and the top-down and bottom-up sizing methods turn it into a market size.
Who the companies are and how many exist
County Business Patterns has been published every year since 1964. It counts establishments with paid employees, their employment in the week of March 12, first-quarter payroll and annual payroll, for nearly 1,000 industries. Geography runs from the nation down to counties, metro areas, ZIP codes and congressional districts.
CBP data leaves things out. It skips crop and animal production, most government employers, private households and anyone without a payroll. A researcher who misses those gaps ends up barking up the wrong tree for a week.
Statistics of U.S. Businesses adds firm count data by enterprise size, the cut you need for firmographic segmentation. Nonemployer Statistics covers businesses with no paid staff and receipts of $1,000 or more, built from data collected through business income tax records.
Nonemployer Statistics is administrative data, meaning records kept to run a tax system and reused for counting. The UK equivalent comes from the Inter-Departmental Business Register, and the ONS counted 2,786,985 VAT or PAYE businesses in March 2026, up 1.9% on 2025.
Administrative data has one advantage over survey data. It covers every registered business above the threshold, so the counts are a full enumeration of the register. Administrative data may still miss informal traders who never registered.
What customers spend and who they are
The BLS Consumer Expenditure Surveys released 2025 figures on October 29, 2026. The average consumer unit spent $81,905, up 4.3% from $78,527, on income before taxes of $110,847. Housing took $27,790, healthcare $6,470 and food away from home $4,142. Quantitative survey data may move without meaning much, and the release marks the 13.2% jump in entertainment spending as not statistically significant at 95% confidence. Without that context, the jump reads as a trend.
Data collected for the CE comes from a weighted sample representing roughly 138 million consumer units. The published tables split them by region, population size of area and type of area, among other cuts, and the public-use microdata lets a researcher rebuild any cut the tables skip.
The American Community Survey answers the who for market research. One-year estimates cover areas of 65,000 people or more, and five-year estimates cover every area from the largest sample. A researcher studying a particular population in a small county needs the five-year file. The guide to demographic segmentation shows what to do with those cuts.
For attitude data, Pew Research Center releases the microdata it collected to anyone with a free account. Recent files include American Trends Panel Wave 169, fielded April 28 to May 4, 2025 on climate and energy. Public opinion polls like these are standard inputs for social research. Social science research reuses the files for secondary analysis years after Pew publishes its own research.
What competitors disclose in SEC filings
SEC EDGAR gives free public access to millions of filings from listed companies. The 10-K carries segment revenue data, store counts and a risk-factor section that rewards reading between the lines. That's the competitor's view straight from the horse's mouth.
EDGAR's full-text search covers every electronic filing since 2001. A researcher can find a competitor's name inside other companies' filings, which turns a needle in a haystack into a five-minute search.
Private company data comes from paid databases, compared in the financial data provider ranking.
Jobs, prices, patents and trade flows
The BLS Quarterly Census of Employment and Wages counts employment and wages collected from employer reports for more than 95% of US jobs, at county, metro, state and national level. The first-quarter 2026 data came out August 28, 2026, so a researcher works with a lag of about five months.
FRED, run by the St. Louis Fed, aggregates 853,000 economic time series from 127 other sources. It's a statistical database in the literal sense, re-serving a wide array of prices, rates and employment series, data collected by other publishers, through one interface and an API.
UN Comtrade holds import and export data collected from nearly 200 countries and areas, reported since 1962. A researcher with free registered access can pull 100,000 records per call and 500 calls a day, and premium tiers reach 250,000.
The USPTO's Open Data Portal, where PatentsView now redirects, serves patent data for free. The patent search tools ranking covers the paid layers built on top of it.
What people search, say and publish
Google Trends draws on sample data from real Google searches, divides each point by total searches for that time and place, then scales the result from 0 to 100. A 100 marks peak relative interest in that context, with no search count attached. Trends works as a quick and dirty demand analysis, so keep an eye on the scale when a researcher quotes it as volume data.
Academic journals are the other big research pool. A literature review treats previous research in peer-reviewed journal articles as secondary sources, and a meta analysis pools the results of other studies into one estimate, a common step in health and social research.
Both are secondary data analysis of academic research someone else ran, using qualitative data as well as quantitative data. The qualitative and quantitative research comparison covers how the two kinds differ.
Historical records, such as old annual reports, archived web pages and back issues of trade journals, hold data on how a market looked before anyone thought to measure it, and they often flag where further research is needed.
Paid and restricted datasets, and their terms
Syndicated research costs money, and a researcher should read the plan terms before signing. Statista lists a free Basic account, Starter at $199 a month and Personal at $649 a month, both billed annually on a 12-month contract that renews at list price. The market research cost report compares those prices with agency work.
Health records are the most restricted secondary data sources. AHRQ's National Inpatient Sample holds billing data collected from about 7 million hospital stays a year, weighted to estimate more than 35 million. The access process requires data use agreement training and a signed agreement before files ship.
Public health researchers doing secondary data analysis accept that paperwork because the NIS approximates a 20% stratified sample of all US community hospital discharges, often the only source of detailed information at that scale. Health records like these provide data at national scale.
Internal secondary data you already own
Organizational records count as research data. A CRM export, a year of support tickets, invoice lines and web analytics were all data collected to run the business, and reusing that existing data for a new research question is secondary analysis by definition. That data costs nothing extra and stays private to your company.
Internal secondary data may decay on a schedule you didn't set. In Google Analytics 4, user-level data retention is set to 2 or 14 months on standard properties. Researchers should export the data they'll need before it ages out, or they're back to square one.
Support tickets and call notes are raw material for qualitative secondary data analysis, as free text coded in a separate process after the fact. The customer intelligence framework covers how to collect and organize that feedback so it can be reused.
Worked example: sizing the US budget gym market from three datasets
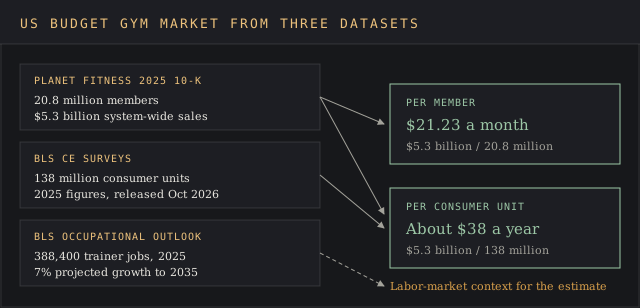
The research question here asks how much Planet Fitness, a listed US budget gym chain, takes per member, and how big that is against household spending. Three free datasets answer it in an afternoon of secondary data analysis, before any primary research.
Planet Fitness's 2025 10-K reports about 20.8 million members and 2,896 clubs at year end. System-wide sales reached $5.3 billion. New members pay from $15 a month for the Classic Card and $24.99 for the Black Card.
A researcher dividing $5.3 billion by 20.8 million members gets about $255 a year, or $21.23 a month. That sits closer to the $24.99 tier than to the $15 headline price, which points to a large Black Card share. The devil's in the details, since the 10-K counts clubs in Canada, Mexico, Panama, Australia and Spain in the same totals.
The CE data supplies the denominator. With roughly 138 million US consumer units, Planet Fitness has about one member for every 6.6 of them. Its $5.3 billion works out to about $38 per consumer unit.
The BLS Occupational Outlook Handbook counts 388,400 fitness trainer and instructor jobs in 2025, projected to grow 7% through 2035, at a median wage of $47,160.
Each figure in the analysis came from a different publisher with a different method, the setup data triangulation exists for. Log every source during the analysis process, using the source attribution techniques, so the estimate can be rechecked against other sources later.
Limits inherent in secondary data, and when to collect your own
The research method is old. Kelly, Martin-Peters and Strohm Farber, in a 2024 research methods paper in the Journal of Pediatric Health Care, date secondary data analysis to the 1960s and credit its cost effectiveness and access to ready-made data for new research questions. They also list the limitations inherent in it. The existing data can't be re-fielded, so a researcher can't alter what was asked, add a question or analyze what wasn't collected.
That shapes the research design and the whole secondary data analysis process. The investigator conducting the original study picked the questions, the sample and the data collection process, and every later researcher inherits all three. The authors' exemplar uses cross sectional data from the 2016 National Survey of Children's Health, which shows associations at one point in time and can't prove what caused what.
Data may also be stale or incomplete. The 2025 CE release notes a gap in CE data collection in October and November 2025, caused by a funding lapse. Outdated information like this is a red flag, and the source credibility checks are built to catch it.
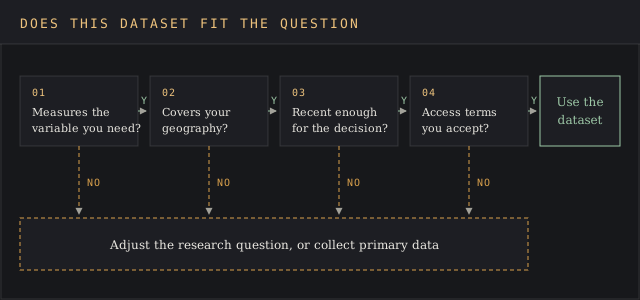
A researcher should switch to primary data collection once the available data can't answer the research question at the geography, date or definition the project needs. Secondary data analysis then shapes the primary data collection by narrowing the questions, setting the sample and giving a baseline for checking results. The market intelligence analysis guide shows how both feed one conclusion.
FAQ
What are five sources of secondary data?
Five common sources of secondary data are government census data (County Business Patterns, the Economic Census), household spending files (the BLS Consumer Expenditure Surveys), company filings on SEC EDGAR, published journal articles, and your own organizational records such as CRM and support data.
What are 10 examples of secondary sources?
Ten examples: the Economic Census, County Business Patterns, Nonemployer Statistics, the American Community Survey, the CE Surveys, EDGAR 10-K filings, QCEW, UN Comtrade, Google Trends and Pew Research Center files.
What are 5 examples of primary and secondary data?
Primary data is collected directly by you for the current project: interviews, your own questionnaire, a focus group, a usability test or a store visit. Secondary data examples are the same kinds of material collected by someone else, such as a Pew Research panel file, a census table, a 10-K, a published research paper or last year's support tickets.
What does secondary data mean?
Secondary data is information originally collected by someone else, for another purpose, that you reuse in secondary data analysis. In a nutshell, the test is who collected it and for what purpose.
Is a literature review secondary data?
Yes. A literature review analyzes studies that other researchers published, so the review is a secondary analysis of their work. A meta analysis also pools the original data of several studies.
Can secondary data be qualitative?
Yes. Interview transcripts deposited in social sciences archives, open-ended answers, support tickets and call notes are qualitative data that can be reused. Kelly et al. note that researchers can draw on both quantitative and qualitative secondary data analysis options.
Bottom line
Most business questions already have a named research dataset behind them. Market size sits in the Economic Census and BEA tables, company counts in CBP and the ONS register, spending in the CE Surveys, competitor numbers in EDGAR and trade in Comtrade. Most of that data is free. Starting with those free resources can save time and widen research opportunities for a two-person research team.
Skipping this step means paying for primary data collection that repeats what a government agency already measured, or citing a figure without knowing the method behind it. Every dataset here was collected for someone else's question, so check its definitions before the numbers go into a deck.
The next lesson turns this catalogue into a research method for planning, searching, logging and stopping, in the guide to running desk research step by step.