Firmographic segmentation: the variables, the data behind them and how to build segments
 By Jan Suski. I go deep on every review, checking every number against its source and digging up details other coverage misses, a habit from six years of SEO and link building for tech companies. Bylines at Surfer, Brand24, and Senuto. How the scoring works.
The short version 11 points · 40 seconds
- 01Firmographics sort companies by traits others can checkIndustry, size, location, ownership, growth
- 02Industry codes come from NAICS, which runs six digits deep20 sectors and 1,012 industries in 2022
- 03Employee count and revenue put firms in different tiersThe SBA small-business test uses both
- 04Pick the entity level before counting anythingEstablishment, firm and enterprise differ
- 05Count the segment against Census totals before you buy5.58 million employer firms under 500 in 2023
- 06Firmographic data comes through four collection routesRecords, websites, surveys and vendors
- 07Named contacts at companies count as personal dataThe UK ICO applies UK GDPR to B2B lists
- 08Firmographic data goes stale at a rate you can measure338,000 establishment births in Q4 2025
- 09Tiers turn a segment count into a sales planA fit score on three or four variables
- 10Technographic and intent layers narrow each tierBombora calls a score of 60 or more a spike
- 11Three classification errors cause most segment failuresPrimary activity, double counts, modelled revenue
Firmographic segmentation splits a market of businesses into groups that share organizational traits: industry type, company size, geographic location, ownership structure and growth stage. It's the B2B half of market segmentation, built for B2B marketing teams and analysts deciding which companies get sales time.
Most of its variables are ones a government agency, a regulator or the company itself already publishes, and a segment defined wrong sends reps after accounts that can't buy.
This lesson assumes you've read the overview of the five types of market segmentation, so it skips the definitions and goes to the mechanics: where each variable comes from, which record you're counting, how fast the file decays and how to turn segments into tiers a sales team will work.
What firmographic data covers, and how it differs from demographic data
Firmographics describe organizations; demographics describe individuals. Demographic data records a person's age, income, gender and education level, the variables covered in demographic market segmentation. Firmographic data records the same kind of structural facts about a company, which is why the field also goes by company demographics, business demographics or firm demographics.
Firmographic data plays the same role in B2B that census data plays in consumer work. It's the base layer in the market intelligence fundamentals most B2B teams start from, and every later layer of target customers gets filtered through it.
Five variables segment companies in most B2B work. Applied to an existing customer base, they also show which segments you already win. Four of them are counted by a government body somewhere. The fifth is inferred.
| Variable | What gets recorded | Who counts it officially | What vendor firmographic data adds |
|---|---|---|---|
| Industry type | 6-digit NAICS code, 4-digit SIC code | Census Bureau (NAICS), SEC (SIC for EDGAR filers) | Proprietary sub-industries, secondary codes |
| Company size | Employee count, annual revenue | Census SUSB size classes, SBA size standards | Modelled revenue for privately owned firms |
| Geographic location | Headquarters address, branch sites | Census tables by state, county and metro area | Every site in the corporate family |
| Ownership structure | Legal form, public or privately owned, parent | Census legal form of organization tables, SEC filings | Parent and subsidiary linkage |
| Growth trajectory | Hiring, funding, growth trends | BLS establishment births and deaths, in aggregate only | Company-level headcount change, funding rounds |
The last row is where segmentation gets expensive. No agency publishes a single company's growth trends, so every company data point in that column comes from a vendor model or from the company's own filings.
Industry type: NAICS codes and the SIC codes still in use
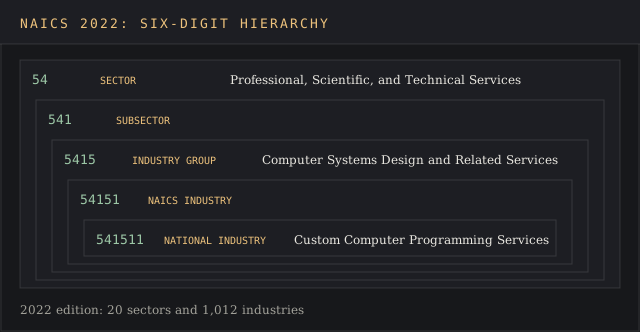
NAICS, the North American Industry Classification System, was developed under the U.S. Office of Management and Budget and is the standard federal statistical agencies use to classify business establishments. The 2022 NAICS Manual sets out a six-digit hierarchy: two digits for the sector, then subsector, industry group, NAICS industry and national industry. The 2022 edition has 20 sectors and 1,012 U.S. industries.
A software consultancy shows how the digits narrow. 54 is Professional, Scientific, and Technical Services. 5415 is Computer Systems Design and Related Services. 541511 is Custom Computer Programming Services, and a segment defined at four digits pulls in IT staffing & managed-service firms that the six-digit version leaves out.
The devil's in the details of the classification rule. When an establishment runs several activities, the manual assigns its code "based on the establishment's principal product or group of products produced or distributed, or services rendered." A hardware maker with a large services arm sits under one code, and a segment built on codes alone catches it or misses it based on which line earned more.
The code also decides which regulations and pain points a message has to address, since a bank or a hospital buys under compliance rules a retailer never sees.
SIC codes, the older four-digit system, are still live. The SEC's SIC code list attaches one to every company filing on EDGAR and uses it to route filings to a review office: 7372 is Services-Prepackaged Software, reviewed by the Office of Technology. Public companies carry that SEC code next to whatever NAICS code a data vendor assigns, and the two don't always describe the same business line.
Company size: employee count, annual revenue and the record you're counting
Company size is measured by number of employees or by annual revenue, and the two often put the same company in different tiers. A reseller with thin margins and a consultancy with fat ones can share an employee band and sit an order of magnitude apart on revenue.
The SBA's small-business test shows the split. Its size standards are "generally based on the number of employees or the amount of annual receipts," and the measure changes by NAICS code. Most manufacturers qualify as small at 500 employees or fewer; most non-manufacturers qualify with average annual receipts under $7.5 million. A segment labelled SMB inherits whichever measure its builder picked.
The harder question is which record holds the count. The Census SUSB glossary uses three. An establishment is "a single physical location at which business is conducted." A firm groups establishments in the same area and industry. An enterprise, which Census also calls the company, is the whole domestic organization those establishments belong to.
Commercial firmographic data splits it the same way. Dun & Bradstreet's firmographic API documentation returns two employee totals for one record, one for the individual entity and one consolidated, and tags each record's family-tree role as Global Ultimate, Domestic Ultimate, Parent or Headquarters. D&B's sample record shows 110 employees at the entity and 125 consolidated.
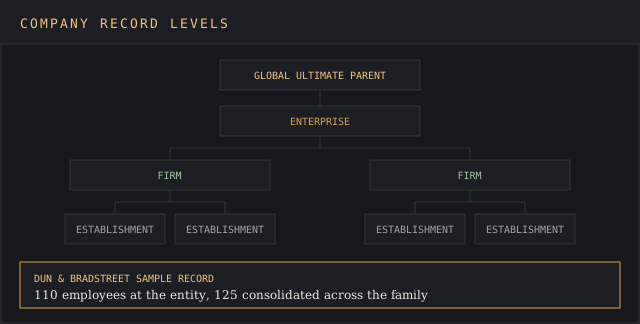
A 110-person branch owned by a larger parent company with tens of thousands of staff doesn't share the purchasing behaviors of a 110-person independent, since the parent's procurement team often signs. Decide at the start which level your firmographic data counts, write it down and keep it fixed.
Count the segment against government totals before buying a list
A team can check how many target businesses exist before it pays anyone. The Census Bureau's 2022 SUSB annual tables count firms, establishments, employment & payroll for employer businesses by 6-digit NAICS code and enterprise employment size, by state, county and metro area, and by legal form of organization.
The headline number frames the market of potential customers. Census counted 5.58 million U.S. firms with at least one employee and fewer than 500 in 2023, up from 5.53 million in 2022. Another 30,427,808 nonemployer establishments had no payroll at all and sit outside every employer count.
The check takes an afternoon. Zero in on the SUSB row for your six-digit codes and size bands, then hold it against the account count a vendor quotes for the same definition. A vendor's firmographic data file far above the Census firm count is usually counting establishments or nonemployers; one far below it has a coverage gap.
Either result is a red flag worth raising before signing, and a buyer who has checked holds a small competitive advantage in the negotiation.
It's the same desk-research habit taught in secondary market intelligence, aimed at a B2B target market, and it lets a team quickly identify the size of each segment for free. The Census tables are providing insights most vendors charge for, and the gap between their count and a vendor's is one of the more valuable insights a buyer can carry into procurement.
How to gather firmographic data
Collecting firmographic data runs through four routes, each strong on different fields. Government organizations publish firmographic data on counts and, for listed firms, financial metrics in SEC filings. Company websites show office locations, product lines, market presence and leadership changes, and help analysts identify companies that changed since the last pull. Forms and surveys get the company to answer for itself.
Third party data providers compile firmographic data and company information across millions of records and fill the gaps with their own models, which is the fastest route and the least transparent on where each field came from.
Surveys are the one way to gather firmographic data where the respondent states the figure, which makes them the most current source on fields that move. The key firmographic questions are short and ask only for relevant information:
- What is your company's industry?
- How many employees work at your company: 1 to 49, 50 to 999, 1,000 to 4,999, or 5,000 or more?
- What was your company's approximate annual revenue last year?
- Which best describes your company's growth trajectory: growing, stable, downsizing or a new startup?
- Which best describes your organizational structure: standalone entity, subsidiary of a larger organization, limited liability corporation, partnership, publicly owned or privately held?
A form that captures a named contact is collecting personal data. The UK ICO's business-to-business marketing guidance says "If you can identify an individual either directly or indirectly it will constitute personal data," and UK GDPR applies even when the pitch is aimed at the company. The same rule covers bought files: ask a vendor how each contact was collected under GDPR before importing it.
The email rules split by entity type. PECR's rule on electronic mail "does not apply to corporate subscribers," but the ICO treats sole traders & some partnerships as individual subscribers who need consent or a soft opt-in. Geographic location belongs there for the same reason: one list emailed into the UK and into a U.S. state runs under two sets of rules.
A segment built on company size alone can't tell those apart, so legal form belongs in the definition.
How fast firmographic data goes stale
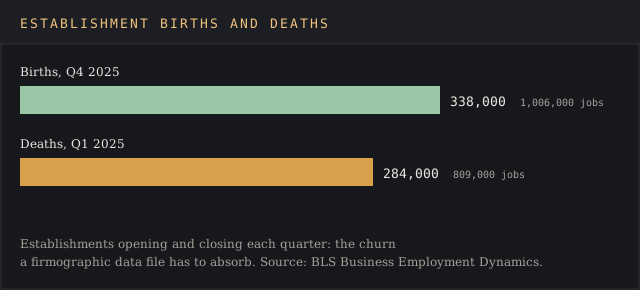
Every firmographic data file starts decaying the day it's pulled. Its latest deaths figure, for the first quarter of 2025, showed 284,000 establishments closing and 809,000 jobs lost.
The Bureau of Labor Statistics' Business Employment Dynamics release recorded 338,000 establishment births in the fourth quarter of 2025, accounting for 1,006,000 jobs.
Those are new and dead records only. Moves, rebrands & new executives sit on top. Dun & Bradstreet, citing its own figures and The Sales and Marketing Institute in a data quality guide, puts the rate at 120 business address changes, 75 phone number changes, 20 CEO departures and 30 new businesses every 30 minutes.
A stitch in time saves nine on refresh schedules. Re-pull the fields that drive the tier (employee count, ownership, leadership) on a short cycle, and the stable ones (industry type, incorporation year) once a year. One quarterly refresh of every field is a drop in the bucket on the fast fields and wasted money on the slow ones.
Turning segments into tiers with fit scoring
A segment is a count. A tier is a decision about who works it. A common split runs three deep: a short list of high value accounts that get named reps & account-based marketing, a middle tier that gets sequenced outreach, and a long tail that gets automated marketing messages and no rep time.
The fit score that sorts them uses three or four variables from the firmographic data, each weighted by past wins. Industry type and company size tend to carry the lion's share, geographic location acts as a filter and growth trajectory breaks ties: a growing, profitable firm tends to have the budget and urgency a downsizing one lacks.
One score helps reps identify companies worth a call and feeds lead generation and lead scoring, so qualified leads reach a rep first and a demo request from outside every segment drops in the queue.
The weights come from your own customer base. Testing which variables separated won deals from lost ones turns firmographic insights into weights. It's ordinary market intelligence analysis run on your CRM, and the full ideal customer profile method gets its own lesson in Path 3A. Software that runs the scoring is compared in the customer segmentation tool rankings.
Sales and marketing efforts fall apart when the two teams score against different definitions. Get both on the same page with one written segment definition, one tier list and one refresh date. That shared file is the cheapest competitive edge firmographic segmentation offers, because a rival with a bigger list and two definitions still sends sales pitches to accounts its own marketing teams excluded.
Layering technographic data and intent on top
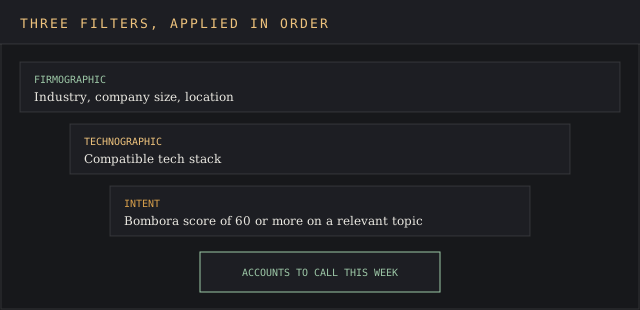
Firmographic data says a company fits. Technographic data says what tech stack it runs, and intent says when it's looking, so each layer cuts the tier down and moves marketing efforts toward fewer accounts.
A tech stack filter removes target businesses that can't use the product: a Salesforce add-on has no buyer at a company running a different CRM, however well it fits on size. Vendors of that data are compared in the technographic data provider rankings.
Intent adds timing. Bombora scores companies on topics against their own historical baseline, and its thresholding guidance says "Businesses with scores of 60 or more on a given topic are considered spiking." Intent vendors sit in the intent data provider rankings.
Order matters. Intent run on an unsegmented list is a needle in a haystack. Intent run on a tier-one firmographic segment helps sales teams identify prospects to call this week. Behavior inside your own product is a further layer, covered in behavioral market segmentation.
Personalized messaging is the payoff. McKinsey's November 2015 article Personalizing at scale states that personalization "can deliver five to eight times the ROI on marketing spend, and can lift sales by 10% or more." Firmographic segments are how B2B teams tailor messaging: they create relevant marketing messages for distinct segments and target audiences, matched to customer needs by industry & size band, the raw material of tailored marketing strategies.
A firmographic segment picks the company. It says nothing about the decision makers inside it, and research on that buying group is covered in B2B buyer insights.
Where firmographic segmentation goes wrong
Three classification errors do most of the damage in B2B market segmentation, and none of them shows up on a dashboard.
The first is the primary-activity rule. A company whose biggest revenue line is hardware sits under a manufacturing code even when its services arm is the size of a mid-market firm, so a services-only segment misses it. Spot-check the firmographic data on the largest accounts in each segment against their company websites.
Counting a subsidiary twice is the second. A global ultimate with eight branches shows up as nine accounts in a file built at establishment level, and three reps end up calling the same procurement team. Roll all firmographic data up to one entity level before tiering.
Modelled revenue is the third. Listed firms report revenue in SEC filings; privately owned companies mostly don't, so the revenue band in their company data is a vendor estimate. Weight revenue lower for private accounts or swap in employee count. The firmographic data provider rankings cover how vendors build those estimates.
A team that buys bigger files to fix low reply rates is barking up the wrong tree when the segment definition is the fault. Record which source supplied each field, using the same data source attribution techniques analysts apply to any intelligence file, so a bad tier can be traced back to the field that caused it.
FAQ
What is firmographic data?
Firmographic data is the set of organizational facts about a company: industry type, company size, location, ownership structure, legal status and growth. Common data points include a NAICS code, employee count, revenue, headquarters address and parent company.
What are some firmographic data examples?
Three firmographic data examples from one Dun & Bradstreet sample record: NAICS 323111, 110 employees at the entity with 125 consolidated, and a legal form of Corporation. Others include an SEC SIC code such as 7372, public or privately owned status and the number of locations.
What is the difference between demographics and firmographics?
Demographics describe people (age, income, education level). Firmographic data describes organizations (industry, size, revenue, location). B2C marketing strategies segment on the first, B2B marketing strategies on the second, and account-based programs use both: firmographics for the account, demographics and role for the decision makers.
What is firmographic targeting?
Firmographic targeting is the activation step: running ads, outreach or territory plans against a firmographic segment of target businesses. It's the base of lead generation for most B2B target audiences, because it filters the list before any marketing efforts go into it.
Why is firmographic data important?
It points a team at the right companies before it spends on reaching a target market. A Census count is free, a tier list stops reps calling accounts outside the segment, and a segment-level message can name the buyer's industry where a generic pitch can't.
Which firmographic data providers are available?
The main vendors include ZoomInfo, Cognism, Crunchbase and People Data Labs, alongside free government firmographic data such as Census SUSB & SEC EDGAR. The ranked list of firmographic data providers compares ten of them with entry prices.
Bottom line
Firmographic segmentation works when every variable has a definition someone else can check: a six-digit NAICS code, an employee band, one entity level, one refresh date. Built that way, a segment can be counted against Census totals, scored against your customer base into tiers and handed to sales teams with a straight face.
Skip the definitions and the cost arrives later as a subsidiary counted three times, a services firm filed under hardware or a revenue band nobody measured. Each error in the firmographic data sends reps after accounts that were never in the target market.
The next lesson on this path, market segmentation examples, sets firmographic segments beside demographic, geographic, psychographic and behavioral ones from real companies.