What an ideal customer profile is, and how to tell if yours works
 By Jan Suski. I go deep on every review, checking every number against its source and digging up details other coverage misses, a habit from six years of SEO and link building for tech companies. Bylines at Brand24 and Senuto. How the scoring works.
The short version 11 points · 40 seconds
- 01An ICP describes the company that gets the most value7 to 10 checkable rules on one page
- 02The ICP picks companies, and a persona describes peopleA TAM counts buyers, an account list names them
- 0386% of buyers are likelier to buy when goals are understoodSalesforce State of Sales research
- 04A 5% retention gain lifted profit above 25% in financial servicesBain, plus 73% of 243 CSOs in Gartner's survey
- 05Three churned out of five gives a 23% to 88% interval95% Wilson interval, the NIST method
- 06The same 60% vs 24% split passes Fisher at 15 and 75p = 0.011, down from 0.14 at 5 and 25
- 07With no CRM history, start from lost deals and interviewsTag each line as evidence or guess
- 0821,532 US plumbing and HVAC establishments have 10 to 49 staffNAICS 238220, County Business Patterns 2023
- 09A $3M target needs 1,670 opportunities, 7.8% of the universe128% of the 1,300 firms at 100 to 249 staff
- 10Compare win rate, cycle and NRR by tier after 6 to 12 monthsWait for about 30 closed deals per tier
- 11Review the profile every quarter with five teamsSales, marketing, success, product, finance
An ideal customer profile (ICP) is a short, rule-based description of the companies your business serves best: the industry, company size, location, tech stack and buying trigger shared by the ideal customers who buy fast, stay and grow. Every rule traces to a number in your business data. If buyer research is new to you, start with the earlier lesson on B2B buyer insights and the buying committee.
This lesson covers what the ICP workbook takes for granted: the definition, four documents it gets confused with, the evidence on fit, and how to judge a pattern from 5, 15 or 75 customers. It then shows how to create an ideal customer profile with no CRM history, check it against Census counts and read the results a year later, for a target audience of founders, RevOps leads and product marketers.
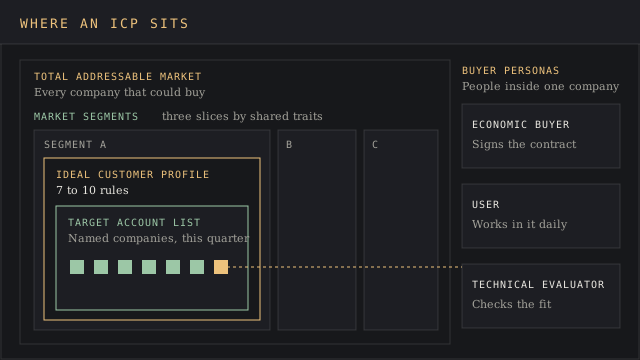
What an ideal customer profile describes, and the four documents next to it
An ideal customer profile describes a company. It lists the common characteristics of the ideal customers where your solution earns its keep: industry, company size by headcount or annual revenue, geographic location, installed software and the event that starts a purchase. Those fields are firmographic, behavioral and environmental, and the firmographic layer has its own lesson on firmographic segmentation and fit scoring.
A good ICP fits on one page. Seven to ten rules, each tagged must-have, nice-to-have or disqualifier, make a detailed description a rep can check on a five-minute discovery call. The perfect customer, or dream customer, it describes should already exist in your customer base or pipeline, because a profile of a company you've never managed to sell to is pie in the sky.
| Document | Describes | Answers | Typical size |
|---|---|---|---|
| Ideal customer profile | A type of company | Which companies fit | 7 to 10 rules |
| Buyer persona | A role inside the company | Who signs, who blocks, what they need to hear | 3 to 5 per ICP |
| Total addressable market | Every company that could buy | How big the prize is | One dollar figure |
| Market segment | A slice of the market by shared traits | Where to compete | Several per market |
| Target account list | Named companies | Who reps call this quarter | Dozens to thousands of rows |
A buyer persona works at the level of the person. It's a semi-fictional portrait built from interviews, with a job title, personal motivations, purchasing habits, budget constraints and personality traits, and it tells the marketing content team which pain points decision makers raise. Ideal customer profiles and buyer personas work as a pair, one picking the company and the other shaping the messaging. Some teams call the ICP an ideal buyer profile.
The TAM sets the size of the prize, and the method sits in how to size a market. Customer segments split that market by traits, as covered in market segmentation. The ICP names the segment of ideal customers you'll win first, and the target account list turns it into company names.
Why an ideal customer profile is important, and what the evidence measures
The published case for an ideal customer profile rests on three findings, each measuring something next to fit.
Salesforce's guide to the ideal customer profile cites its State of Sales research finding that 86% of business buyers are more likely to buy when their goals are understood. A seller working target customers who match a known profile walks in knowing their pain points and can sell to them.
Fred Reichheld's Bain & Company brief Prescription for cutting costs reports that in financial services a 5% increase in customer retention produced a profit increase above 25%. Ideal customers stay loyal longer, and customer lifetime value compounds over each customer lifetime.
Gartner's survey of 243 CSOs and senior sales leaders, fielded in late 2024, found 73% prioritizing growth from existing customers for 2025.
If next year's growth comes from current customers, this year's signings set the ceiling, and a team closing poor fits is wasting time it pays for again at renewal. An ideal customer profile helps focus resources, marketing efforts and sales time on high value customers, the case laid out in why market intelligence is important.
How many customers a pattern needs before it means anything
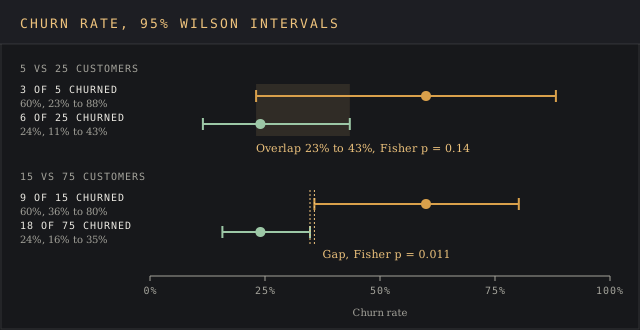
Customer profiling on 20 to 40 customers produces confident patterns that dissolve on the next export. Don't count your chickens before they hatch with a segment of five. Take a SaaS business with 30 customers. Five are logistics firms and three of those churned, a 60% rate. The other 25 lost six, or 24%.
The NIST/SEMATECH e-Handbook recommends the Wilson method for a confidence interval on a proportion. On 3 of 5 the 95% interval spans 23% to 88%. On 6 of 25 it spans 11% to 43%. The ranges overlap from 23% to 43%, so the data can't say which segment churns more.
A Fisher exact test on the same table gives a two-sided p-value of 0.14. Chance alone produces a gap this size about one time in seven.
Triple the counts and the picture changes. Nine of 15 churned against 18 of 75 is the same 60% and 24%, and the intervals now run 36% to 80% and 16% to 35%, with clear space between them. Fisher's test drops to p = 0.011.
Three working rules follow. Treat any segment under 10 customers as an idea to test in next quarter's pipeline, with the data from new leads. Focus on churn, contract value and sales cycle together, since one metric on five customers is a coin toss. And when your best customers share a trait most of the customer base also shares, it describes your history, a trap explained in sampling bias.
How to create an ideal customer profile before you have CRM history
With fewer than 20 paying customers, customer profiling from a spreadsheet has too little data to work on. The ideal customer profile template walks a team from a CRM export through segmenting, interviews and scoring, and assumes that history exists. Before it does, four sources fill the gap.
Lost deals and open pipeline
Lost deals hold the disqualifiers, and the pain points the solution failed to solve. Pull every opportunity that reached a demo and identify the loss reason, company size and industry. Budget losses clustered under 20 staff are a red flag you can write into a rule today. Software for structured loss reviews sits in the win-loss analysis software rankings.
Founder and customer interviews
Interviews with your best customers carry the why behind the numbers. Ask five to eight ideal customers what was happening the month they started looking, who else they evaluated and what would make them leave. A 45-minute founder session captures early sales history that lives in founders' heads.
Record which customer insights came from which interview, following data source attribution techniques, so each rule traces back later. Customer profiling without that trail turns into opinion within two quarters.
Outside data
Public statistics let you zero in on the market your draft describes and check it can carry the plan, using the desk-research method in secondary market intelligence. For US B2B target customers, the Census Bureau's County Business Patterns counts establishments by six-digit NAICS code and employee size class, which lets you identify potential customers and size the target audience before buying a list.
Tag every line you create as evidence or guess. Guesses are fine in version one. They turn into trouble when nobody remembers which lines were guesses, and the team goes back to the drawing board with no record of why.
Worked example: checking the matching universe against a revenue target
A company selling dispatch software to trade contractors, a field service business, drafts this ICP: plumbing, heating and air-conditioning contractors (NAICS 238220) in the US, 10 to 49 employees, running more than five service vans. The plan calls for $3 million in new annual recurring revenue within three years, at an assumed $9,000 per customer per year.
Census County Business Patterns data for 2023 counts 111,207 establishments in NAICS 238220. Of those, 64,871 have fewer than 5 employees, 13,148 have 10 to 19, and 8,384 have 20 to 49. The draft universe of potential customers is 13,148 plus 8,384, or 21,532 establishments.
$3,000,000 divided by $9,000 is 334 customers, and 334 is 1.6% of 21,532. At an assumed 20% win rate, 334 wins need 1,670 qualified opportunities. That's 7.8% of the universe across three years, a stretch and a plausible one.
Now narrow the ideal customer profile to firms of 100 to 249 employees, which sales teams often prefer for the bigger deals. Census counts 1,300 such establishments. The same 334 customers would be 25.7% of every one, and 1,670 opportunities would be 128% of the class. Unless the price per customer rises five-fold, that ICP sends the team on a wild goose chase.
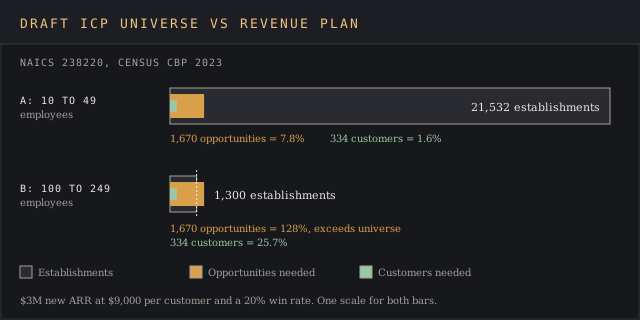
CBP counts establishments, so a contractor with three branches appears three times, and 238220 includes plumbing-only shops. Halve the first universe and 1,670 is still 15.5% of it. The wider method sits in market intelligence strategy.
How to tell 6 to 12 months later if the ideal customer profile works
An ideal customer profile earns its place by changing three numbers in your customer data. Measure each for ICP-tier accounts and non-ICP accounts separately from the same CRM export.
- Win rate on qualified opportunities. Closed-won divided by closed-won plus closed-lost, per tier.
- Sales cycle. Median days from first meeting to signature, per tier, since one 400-day enterprise deal drags an average.
- Net revenue retention. Recurring revenue today from last year's customers, divided by their recurring revenue then, counting expansion, contraction and churn. A cohort that starts at $100,000 and ends at $112,000 has 112% NRR.
The sample-size rules apply here too. Twelve ICP-tier deals against 40 other accounts give a wide interval, and the jury's still out until each tier passes about 30 closed opportunities.
For a fourth reading, Bain's Net Promoter System asks how likely a customer is to recommend you on a zero-to-ten scale, counts 9 and 10 as promoters and 0 to 6 as detractors, and subtracts the second share from the first. Split NPS by tier and customer success teams see which tier is unhappy before renewal.
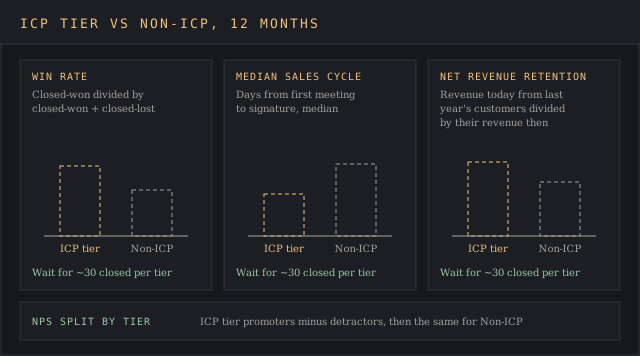
A small or reversed gap means the ideal customer profile describes the wrong trait. Cut your losses on that rule, return to the lost-deal notes and rerun the comparison next quarter. Methods for reading a gap like this sit in market intelligence analysis.
Who owns the ideal customer profile and how often it changes
An ideal customer profile that sales wrote alone gets ignored by marketing. Sales and marketing teams, customer success teams, the product team and finance each see a different slice of customer data, and each needs a vote, with finance bringing contract value and payment history. Marketing and sales teams on the same page about one definition stop arguing over lead quality.
Customer profiling is a quarterly job. Review the profile every three to four months against a fresh CRM export. A quarter is long enough for 20 to 30 new closed opportunities to land, the minimum for a rule change to rest on new evidence. Log each change with its date, its numbers and any industry trends that moved a rule.
An ICP helps marketing teams focus on the right audience and cut spend on channels that reach poor fits, which tightens the marketing process and marketing strategies and lifts the share of qualified leads. Sales turns it into target accounts, ideal customers named one by one, and a successful sales strategy, and the target audience for each campaign, and its messaging, narrows to customer segments that renew.
Customer success flags new customers outside the profile for extra onboarding and service. Tools that score companies against an ICP are compared in the ICP tools rankings, and the data layer underneath sits in the customer intelligence framework lesson.
FAQ
How do you define an ICP?
Define it as seven to ten rules about a company, covering industry, size, location, tech stack and buying trigger, each backed by a number from your customer data.
How do you create an ideal customer profile?
Start from your best customers and top customers by contract value, tenure and sales cycle, and identify the traits they share. Add disqualifiers from lost deals, check segment sample sizes, then confirm the universe can carry the revenue plan.
Where should an ICP start if you have no customers yet?
An ICP starts with lost deals, open pipeline, founder interviews and a government count of the target market.
What is an ICP example?
US plumbing and HVAC contractors (NAICS 238220) with 10 to 49 employees and dispatch run on spreadsheets, buying when they add a second location.
How do you describe an ideal customer?
Describe ideal customers by what can be checked: industry code, headcount band, region, the software in use and the event that starts a purchase. Leave job title and goals to buyer personas, since ideal customer profiles and buyer personas split company from person.
Does an ICP work for B2C businesses and service companies?
Yes, with demographic fields describing the target audience in the place of firmographic ones: age band, household income, region and purchase behaviour. The sample-size and measurement rules apply unchanged to B2C marketing strategies and sales strategy.
Bottom line
An ideal customer profile (ICP) is a short set of checkable rules about the companies a business serves best. Its worth shows up a year later in win rate, sales cycle and net revenue retention for the ideal customers who fit, measured against the ones who don't.
Getting it wrong costs twice. A pattern drawn from five customers sends reps after a segment that churns, and a matching universe smaller than the plan's opportunity count makes the target unreachable before the first call. Both mistakes show up in arithmetic you can do on day one.
When the CRM holds enough history, the ICP template workbook turns it into a profile, a scoring sheet and a quarterly review log.