Desk research: a step-by-step method for market questions
 By Jan Suski. I go deep on every review, checking every number against its source and digging up details other coverage misses, a habit from six years of SEO and link building for tech companies. Bylines at Surfer, Brand24, and Senuto. How the scoring works.
The steps 11 points · 40 seconds
- 01Write one market question with a decision attachedPlus a stop date, before any search
- 02Split the question into three to five sub-questionsOne page holds the whole plan
- 03Check what your own organization already holdsInternal desk research costs nothing
- 04Send each sub-question to the publisher that measures itBLS for labor, SEC for companies, Census
- 05Start a source log on day one, one row per sourceURL, publisher, date, figure, method
- 06Search filings and statistics agencies directlyEDGAR full text covers filings since 2001
- 07Set the hour budget and the stopping rule in advanceStop when three sources add nothing new
- 08Collapse duplicates before comparing what you foundTwo articles quoting one study count once
- 09Record each source's lag next to its figureCensus 2022 counts arrived in June 2024
- 10Report sub-question by sub-question, citing log rowsConclusion first, evidence after
- 11Hand the gaps desk research left to primary researchPricing in one town needs a survey
Desk research is research conducted from existing data: published statistics, company filings, industry reports, research papers and your own organization's records, with no new data collection from participants. Most of it happens at a desk, which is where the name comes from, and it's also called secondary research or library research.
This guide is for analysts and founders who need a market answer this month, and it matters because a figure pulled carelessly at the desk ends up in a board deck.
This page is the working routine. If the definition and the source categories are new, start with how secondary market research works and the four types of market intelligence data; this lesson assumes both.
What follows covers scoping a question, logging sources, a stopping rule, a worked example on US pet care using BLS, SEC and Census data, and the final report. It suits researchers who run research projects alone or in pairs, and it explains each stage of the process with the context a first-timer needs.
What desk research covers, and the two types
The purpose of desk research is to understand what is already known about a subject before anyone spends money to gain more. Digital.gov, the US government's guide for federal organizations' design teams, frames it as building on what others have already discovered, and its desk research guide sorts the work into four kinds: academic, statistical, internal to the organization and external to it.
Desk research is usually conducted at the start of research projects, when a company needs background knowledge to understand a market before it picks a method or spends on fieldwork. Most desk research takes place in the first week, and the findings decide which questions are worth new research.
For most organizations, Digital.gov's four kinds collapse into two types. Internal desk research reads data your organization already collected: CRM exports and contact notes, support tickets from users, win-loss notes, past questionnaire files. External desk research reads everything other organizations publish, from government statistics to competitor annual reports.
The UK Department for Education's content design team describes it as "a way of finding information out about your users without talking to them" in a December 2023 post. That's the whole distinction from primary research. Field research collects new data straight from the horse's mouth; desk research reads data somebody else already collected. Field research also costs more and takes longer, since it needs a sample, a questionnaire and weeks in the field.
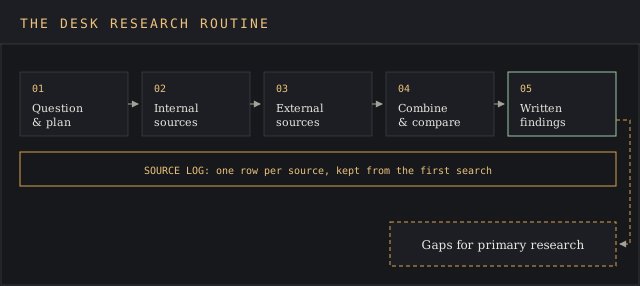
Define the question and the research plan before you search
Desk research projects without a written question turn into a wild goose chase inside a week. The question needs a decision attached: "Should we open 20 grooming locations in Texas in 2027" produces a different reading list than "tell me about pet care".
Objectives go at the top of the plan: what decision the findings feed and what you need to achieve by the stop date. Researchers who skip this step tend to collect data on everything and answer nothing.
Break the question into three to five sub-questions, each of which one kind of publisher covers. For the grooming question: how big is the workforce, how many establishments exist by county, who are the large incumbents and how many sites do they run, and what do customers pay.
The plan is one page. It holds the question, the sub-questions, the hour budget, the stop date and the person who reads the result. Put it on paper, because the plan is what you check yourself against on day three when an interesting tangent or new ideas appear.
Match each sub-question to the data sources that measure it
Start inside. The GOV.UK Service Manual tells teams in discovery to review previous user research and to examine existing data such as analytics, back-office workflow and support logs. In most organizations, the sales department's call notes settle the pricing sub-question faster than any report.
Then go external, and go to whoever measures the thing. Workforce size and pay sit with the Bureau of Labor Statistics. Establishment counts by industry and county sit with the Census Bureau. A public company's store count sits in its 10-K, which makes filings the starting point for any competitor analysis. Industry reports and trade press come last, because most of them quote one of those three.
The internet makes the second-hand copy easier to find than the original, and the relevant information often sits in a methods note three clicks away from the headline table. Each sub-question should end at the publisher that collected the number, and the lesson on tracing a figure back to its source covers how to follow a citation chain.
Keep a source log from the first search
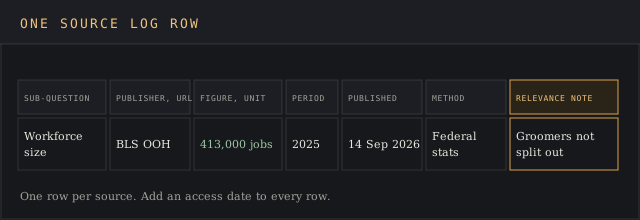
A source log is a spreadsheet with one row per source, started on day one and updated with every page you open. Digital.gov's guidance is blunt on this: "Always properly cite and document desk research sources," and keep citations organized and together. Rebuilding citations from browser history is how desk research conducted over two weeks goes back to square one.
| Log column | What goes in it | Example entry |
|---|---|---|
| Sub-question | Which sub-question the row covers | Workforce size |
| Publisher and URL | The page the figure sits on, never a homepage | BLS Occupational Outlook Handbook |
| Figure and unit | The number exactly as published | 413,000 jobs |
| Reference period | The period the data describes | 2025 |
| Published | When the publisher released it | Page modified 14 Sep 2026 |
| Method | Survey, census, filing, estimate or model | Federal employment statistics and projections |
| Relevance note | What the figure does and doesn't cover | All animal care workers, groomers not split out |
Add an access date to every row as well. Public pages change, and a figure you saw on the publisher's site in March can be revised by May; the access date shows which version the findings rest on.
The relevance note does the most work, because it's how a later reader can understand the scope. It's where you record that a figure covers all animal care workers and not groomers alone, so nobody later quotes it as the size of the grooming workforce.
Search filings, statistics agencies and academic publications directly
Internet search engines rank pages by links, and a statistics table rarely ranks. For company questions, the SEC's EDGAR full-text search covers all filings submitted electronically since 2001, supports the boolean operators OR and NOT plus a NEAR() operator that matches terms within 10 words of each other, and gives free access to every document. Searching "grooming NEAR(5) salons" across 10-K filings returns the public pet retailers that disclose a salon count.
Conducting desk research on government data means reading the series the way its publisher built it. Statistics agencies publish release schedules and methods notes beside the tables. Read the methods note first to understand what the series excludes. Census County Business Patterns, for example, draws on the Business Register, which the Bureau describes as a database of all known employer companies, so a one-person grooming business without staff isn't in it.
Academic databases such as Google Scholar matter when the question is about behavior and the buying environment: why customers switch, how price changes demand. Academic publications also explain the methods behind the numbers, which helps you determine how far a result travels. Digital.gov's advice for scholarly sources is to read the abstracts, then the bibliographies of the papers that look relevant, which turns one good paper into a short literature review.
Time-box the work and set a stopping rule
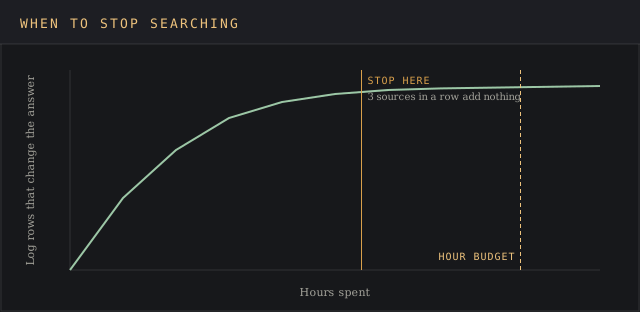
The desk research process has no natural end, so you set one. The hour budget from the plan is the outer limit. The stopping rule is the inner one, and it's written before you start so it can't drift.
A workable rule for most market questions: stop a sub-question when it has an answer from the publisher that collected the data, and the next three sources you open add no row that changes it. Past that point you're looking for a needle in a haystack that isn't there.
The opposite failure is cutting corners on the first sub-question and spending the budget on the fourth. Manage the hours against the plan at the midpoint. If one sub-question has eaten half the time, call it a day on that one, record what's missing and move on.
Combine and compare what you collected
Once the log is full, sort it by sub-question and look for duplicates. Two trade articles and a vendor blog that all quote the same study count as one source; collapse them into the original row and keep the copies only as a note.
The comparison is where new insights come from. Analyze the log one sub-question at a time and note which insights rest on a single source, since those carry the least weight in the findings.
Then compare what's left. Where two independent sources agree, the finding stands. Where they disagree, understand the reference period, the definition and the method in the log before deciding; most disagreements are a different year or a different industry code.
Desk research removes one kind of bias and keeps another. No researchers are shaping participants' responses, since there are no participants. But every figure carries the choices of whoever collected it, which is why the method column exists.
Worked example: sizing US pet care services from desk data
Question: is the US pet care services market large and growing enough for a new chain of 20 grooming and boarding sites? Three sub-questions, three public sources, no paid access.
Analyze the workforce first. The BLS Occupational Outlook Handbook lists 413,000 animal care and service jobs in 2025, projects employment to grow 11 percent from 2025 to 2035, and puts median pay at $35,530 a year. The relevance note matters here: groomers sit inside that total, and BLS doesn't publish them as a separate line.
Incumbents second, the competitor analysis part of the project. Petco's 10-K for the fiscal year ended 3 February 2024 reports 1,423 pet care centers in the US and Puerto Rico and 288 full-service veterinary hospitals. A new 20-site chain is entering a market where one competitor runs about 70 times as many locations.
Establishments third. County Business Patterns breaks out pet care services (except veterinary) under NAICS 812910, by county. The 2022 edition covers nearly 1,000 industries and counts employment for the week of 12 March, and the Census Bureau released it on 27 June 2024. A desk research project conducted in late 2026 is reading establishment counts that are four years old.
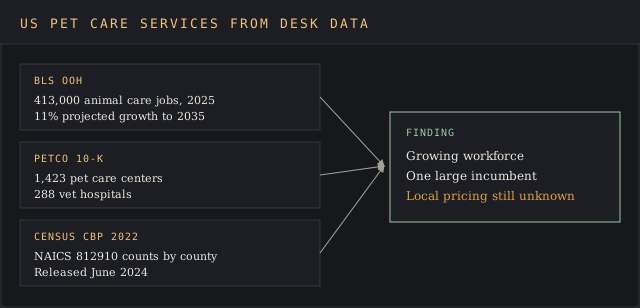
In a nutshell, the desk data settles the size and competition sub-questions and leaves the pricing one open. Nothing published says what a Texas dog owner pays per groom. That gap goes to primary research: a short survey or a round of calls to local salons.
Report findings so the next person can check them
The report takes the sub-questions in order, one short section each, and every figure points to its log row. A reader should understand each answer from the log alone: open it, click the URL and see the same number on the page.
State each source's reference period next to its figure, and give the conclusion before the evidence. A short form works best: question, answer, figure, log row. The analysis section of the report then turns the figures into insights. Keep opinion out of the findings and put it in a separate recommendation paragraph, so a manager can disagree with the recommendation without doubting the data.
End with the open gaps and the method you'd use to close each one. That list is the most useful piece of knowledge for whoever runs the next round, and it means nobody starts from scratch. Companies that manage several research projects a quarter keep the logs and reports in one shared folder, so past materials are searchable before anyone opens a browser.
Where desk research falls short, and when to switch to primary research
Desk research is fast and cheap because the data already exists, and slow to catch change for the same reason. Official series run on release cycles; the 2022 Census establishment release arrived about 18 months after its reference year ended. Anything that moved last quarter won't be in it.
It also can't answer questions nobody has asked. Prices in one town, reasons customers left, reactions to a product that doesn't exist yet: those need new research with real participants. The market research methods lesson covers surveys, interviews and focus groups for that stage.
The advantages are real, and so are the benefits for a two-person shop. Quality depends on the publisher, and the importance of the source log grows with every row, because it's the only record of which figure came from where.
The cost effectiveness case still holds. Every source in the worked example is free to read, and an afternoon of desk research conducted with free sources tells you which three questions are worth paying a survey panel for. Leave no stone unturned at the desk, and you'll focus the field budget where the desk ran out. Direct conversations with users then test ideas the desk research raised.
FAQ
What is meant by desk research?
Conducting desk research means answering a question from data that already exists, such as government statistics, company filings, academic publications and internal records, without collecting new data from participants. It's the same method as secondary research.
Can you give me an example of desk research?
Sizing US pet care services, conducted from three free sources, is one: BLS for the 413,000-job workforce, Petco's 10-K for its 1,423 pet care centers, and Census County Business Patterns for establishment counts by county under NAICS 812910.
What are the disadvantages of desk research?
The data is old by the time it's published, it was collected for someone else's purpose, and it has nothing to say on questions nobody has collected data to analyze. The Census Bureau's 2022 establishment counts, released in June 2024, shows the lag on official data.
Is desk research considered qualitative research?
It can be either. Reading Census counts and BLS projections is quantitative desk research; reading interview transcripts, forum threads or past user research reports is qualitative. What defines the method is the use of existing data.
What is desk top analysis?
Desktop analysis is another name for desk research: reviewing and analyzing existing documents and data from a desk. In consulting and engineering, researchers often use the term for a first-pass review of records before any site visit or fieldwork.
What are the 5 steps of methodology in desk research?
A common five-step form is: write the question and the plan, identify data sources, search and log what you find, combine and compare the data, then analyze it and report the findings with the gaps that remain.
Bottom line
Conducting desk research works when it's run as a routine: a written question, a source log from the first search, a stopping rule set in advance and a write-up that cites every figure. Run that way, an afternoon with BLS, EDGAR and Census covers most of the size and competition questions a market decision needs.
Skip the log or the stopping rule and the cost shows up later, as numbers nobody can trace and hours spent on a sub-question that was settled on day one. The gaps list at the end is the hand-off to primary research, and it's the part that decides where the survey money goes.