Location Intelligence Platforms: 8 Tools Ranked for 2026
 By Jan Suski. I go deep on every review, checking every number against its source and digging up details other coverage misses, a habit from six years of SEO and link building for tech companies. Bylines at Surfer, Brand24, and Senuto. How the scoring works.
· Prefer this source on Google
Quick comparison of location intelligence software
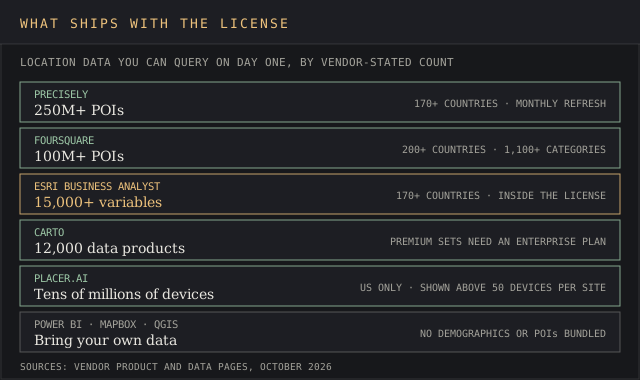
The table carries the one figure that separates these tools fastest: how much location data ships with the license before you upload a single row of your own. The price is the lowest published plan, or Vendr's median where the vendor lists none.
| # | Platform | Bundled location data | Entry price | Best fit |
|---|---|---|---|---|
| 1 | Esri ArcGIS Business Analyst | 15,000+ variables, 170+ countries | $25,281 median (all Esri)* | Site selection teams with a GIS analyst |
| 2 | CARTO | 12,000 data products, premium sets extra | Quote; 30-day free trial | Analysts working in BigQuery, Snowflake or Databricks |
| 3 | Foursquare | 100M+ POIs, 200+ countries | $25/month Spatial Desktop | POI analysis on a small budget |
| 4 | Placer.ai | US foot traffic, tens of millions of devices | Free tier; paid plans by quote | Retail and CRE foot traffic |
| 5 | Precisely | 250M+ POIs, 170+ countries | $25,116 median* | Address-level data for risk and network planning |
| 6 | Microsoft Power BI | Bring your own data; 30,000 points per map visual | $14 a user a month | KPI dashboards that need a map |
| 7 | Mapbox | Maps, geocoding and routing APIs | 50,000 free map loads a month | Developers building maps into apps |
| 8 | QGIS | Bring your own layers | $0 | Analysts with a $0 license budget |
Medians marked * are anonymized buyer-reported contract values published by Vendr. Everything else is the price the vendor publishes itself.
Where these figures come from
Data counts and entry prices are each vendor's own published figure, read in October 2026. The two medians marked * are Vendr's anonymised buyer-reported contract values for Esri and Precisely, and Esri's covers every Esri product, Business Analyst included.
Four of the eight vendors publish no list price, which is par for the course in enterprise GIS: Esri, CARTO, Placer.ai and Precisely. CARTO and Placer.ai quote every paid plan, so their rows carry the pricing model and no figure.
Placer.ai also sits on the real estate data providers ranking, the retail analytics ranking, which covers the POS and pricing side of the same store, and the alternative data providers ranking, which covers foot traffic sold to investors. For people visiting websites, the visitor intelligence software ranking covers IP-matching tools. This page judges all eight as platforms you analyze inside.
A location intelligence platform joins geographic data to business records so a team can see where revenue, risk and customers sit on a map. Esri's own overview names retail, supply chain, real estate and government as the industries running it, and Microsoft's Azure Maps documentation estimates that over 80% of business data carries a location context.
This page ranks eight location intelligence tools on five tests a buyer can run in a week. Every price and data count links to the vendor's own page or to Vendr's anonymised purchase records.
It's written for retail site selection teams, commercial real estate analysts, logistics planners and the BI owners who keep getting asked for a map. Esri Thailand's product page claims more than 90 percent of leaders see location intelligence as a condition of business and community success. That's a vendor's number, so read between the lines.
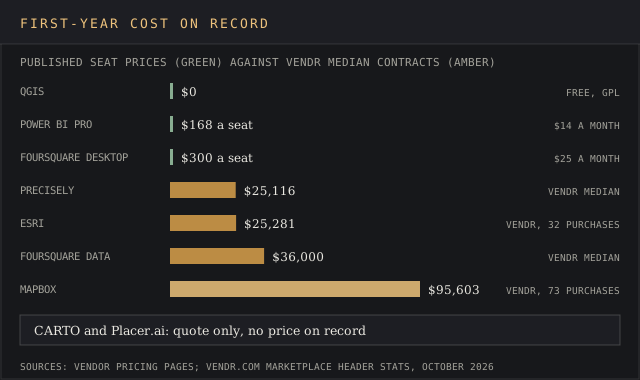
Prices span the whole range. Foursquare's Spatial Desktop Basic tier sits at $0 a month through 2026, while Mapbox's median contract on Vendr runs $95,603 a year across 73 purchases.
Evaluation criteria for location intelligence software
Five criteria decide the shortlist, and the ranking below applies them in this order. Each one returns a number or a yes/no that you can check yourself before a sales call, so purchase decisions rest on evidence.
Location data bundled with the license
Count the variables, data products or points of interest you can query on day one without a second contract. Esri lists 15,000+ variables and QGIS ships zero, the two ends of this list. A platform that ships zero data turns every analysis into a procurement project and adds a purchase cycle before the first insight.
Price on record
A published list price beats a Vendr median, and a Vendr median beats "contact sales". Vendr's header figures are anonymised buyer data, so the number and its purchase count go into the comparison as they stand.
Free way in
Trial length in days, or a free tier with no end date. Esri gives 21 days and CARTO 30, while Placer.ai and Foursquare's Spatial Studio keep a free tier open with no clock running.
Native warehouse connections
Count the cloud warehouses the platform queries in place. CARTO names 6. A tool that can't read Snowflake or BigQuery directly forces an export, and exports go stale the day after they're pulled.
Independent review depth
Count verified reviews on Capterra or TrustRadius. ArcGIS carries 507 Capterra reviews at 4.6 against 2 for Placer.ai. Two reviews tell a buyer little about how a tool behaves after the demo.
Eight tools made the cut. CleverMaps, Kalibrate, GrowthFactor, Unacast and PassBy were reviewed and left out because each had zero verified user reviews on Capterra, TrustRadius or Hacker News to test the vendor's claims against, and only GrowthFactor publishes a price.
Best location intelligence software, ranked
Esri ArcGIS Business Analyst
Best fit
A retail, restaurant or healthcare network that makes site decisions with a GIS analyst on staff.
Business Analyst is Esri's site selection and market analysis product, built on ArcGIS Online. It ships over 15,000 variables on market data across more than 170 countries, and Esri's case studies on the same page run from Chick-fil-A to Moffitt Cancer Center, which covers both the restaurant and the healthcare buyer.
The analysis menu is the deepest here: drive-time trade areas, territory design, location-allocation and sales forecasting sit in one product. It's the jack of all trades of the group.
ArcGIS carries 507 Capterra reviews, five times the 100 on QGIS.
Key features
- 15,000+ demographic, spending and business variables in 170+ countries
- Drive-time and ring trade areas, territory design and location-allocation
- Infographics and reports shareable with Viewer users
- Business Analyst Enterprise bundles 25 Creator and 500 Viewer user types
- Business Analyst Mobile App for demographic & market data in the field
Pricing
Esri's Business Analyst buy page lists what each tier contains and carries zero dollar figures. Vendr's anonymised buyer data puts the median Esri contract at $25,281 a year across 32 purchases, ranging from $2,442 to $103,121. The Advanced Bundle adds 6,000 credits and the Pro tier 10,000; reports draw those credits down.
The 21-day trial includes two Creator and three Viewer users with 500 credits.
Pros
- 15,000+ bundled variables, the largest library of any tool ranked, inside the license
- 507 Capterra reviews at 4.6, so the weak spots are on record
- Covers the analysis, the map and the shareable report in one product
Cons
- Quote-only: buyers negotiate inside a $2,442 to $103,121 Vendr range
- Credits meter reports, so heavy report users pay twice
- Most organizations need a dedicated administrator
The administrator cost shows up in the reviews. A utilities operations reviewer on Capterra, June 2025:
"We have to have someone on staff that is dedicated to running and maintaining our ArcGIS organization."
Kevin S., Operations, Utilities, Capterra, 30 June 2025
An engineering surveyor added on 19 May 2026 that "Geoprocessing tools sometimes run silently and produce empty outputs with zero warning." A systems analyst trainee at a 1,001 to 5,000 person firm saw the upside:
"The analysis tools make it easy to perform complex tasks and allows detailed / high quality visualization for mapping."
Alanna O., Systems Analyst Trainee, Capterra, 27 May 2025
Why it’s ranked #1. Esri's 15,000+ variables ship inside the license, while CARTO sells premium data only on Enterprise plans; 507 Capterra reviews against CARTO's 31 add the evidence.
CARTO
Best fit
A data team working in a cloud warehouse where customer and store tables already live.
CARTO runs spatial analysis inside the warehouse you already pay for. Its pricing page lists Google Cloud, AWS, Azure, Snowflake, Databricks and Oracle as supported, and the free trial runs 30 days with every component, demo datasets and a CARTO Data Warehouse instance included, so a team can hit the ground running.
The Workflows builder is the reason non-coders can use it: hundreds of pre-built spatial components on a drag-and-drop canvas, and a finished workflow can be published as an MCP tool for agents like Claude or ChatGPT to trigger. The Data Observatory lists 12,000 data products from providers including Experian, Fathom, TomTom and the U.S. Census Bureau.
Key features
- Native execution in 6 warehouse platforms, from BigQuery to Oracle
- Workflows: hundreds of drag-and-drop spatial components, schedulable
- Data Observatory with 12,000 data products, Fathom flood data among them
- Workflows published as MCP tools for AI agents
- SSO on every plan; audit logs from the Enterprise tier up
Pricing
CARTO lists four plans and zero dollar figures. Pay As You Go bills monthly on a 12-month contract, metered by consumption. Enterprise, Strategic and Custom are annual quotas by quote.
The catalog FAQ says premium data subscriptions are only available on Enterprise plans, licensed yearly.
Pros
- Reads tables in place across 6 warehouses, so analysis runs on live rows
- 30-day trial opens every component
- 4.8 average across 31 Capterra reviews
Cons
- Quote-only pricing on all 4 plans
- Premium datasets need an Enterprise plan on top
- Trial and student accounts see only samples and public data
The upkeep surfaces in reviews too. A travel security user in automotive, on Capterra:
"There is a high initial time expenditure and the map requires a lot of maintenance to keep it up to date."
Bennet S., Travel Security, Automotive, Capterra, 21 August 2025
A database analyst testing the free version wrote in July 2019 that "you can perform hot spot analysis and easily adapts to geomarketing management".
Why it’s ranked #2. CARTO's 6 native warehouses and 30-day full trial beat Foursquare's $25 desktop seat for teams with data already in the cloud; it trails Esri because premium data costs an Enterprise plan extra.
Foursquare
Best fit
A small analytics team that needs global POI data and a cheap desktop seat.
Foursquare built its places data on 16B+ user check-ins, and Foursquare Places now covers 100M+ points of interest in 200+ countries, with 50+ attributes and 1,100+ categories, delivered daily, weekly or monthly depending on tier.
Spatial Desktop runs $0 a month through 2026, $25 a month on Standard and $100 on Pro, the most open pricing on this list.
Spatial Workbench is $250 a month with a 30-day trial, and Spatial Studio keeps a free Community tier for geospatial big data mapping. Vendr lists Foursquare as a location technology company and data cloud platform.
Key features
- Places dataset: 100M+ POIs, 1,100+ categories, 50+ attributes
- Spatial Desktop with agent tokens bundled into each paid seat
- Spatial Workbench on MotherDuck compute from $0.60 an hour
- Places API at $15.00 per 1,000 Pro calls in the 501 to 100,000 band
- Open Source Places release for teams that want raw data
Pricing
Desktop seats run $0, $25 and $100 a month. Enterprise data deals sit higher: Vendr's anonymised buyer data shows a $36,000 median, ranging from $13,200 to $189,835. Attribution, Audience and Proximity are quote-only.
Pros
- A $0 desktop tier through 2026 and $25 paid seats
- Global POI coverage in 200+ countries
- Published per-call API pricing in four bands
Cons
- Data contracts jump to a $36,000 median
- The free open-source release excludes the paid tiers
- Studio Enterprise pricing is quote-only
That second con came up the day Foursquare announced its open dataset: Hacker News user snthd wrote on 20 November 2024 that "'Places Pro' and 'Premium Data' are not open source."
Why it’s ranked #3. A $25 monthly seat and 100M+ POIs beat Placer.ai's quote-only paid plans on price on record; Foursquare trails CARTO, which queries 6 warehouses in place.
Placer.ai
Best fit
A retailer, landlord or downtown district that needs visit counts to understand who uses a specific US property.
Placer.ai estimates foot traffic from a panel of tens of millions of mobile devices and only shows locations with more than 50 unique devices. The company lists 4,000+ customers, and its own guide names site selection, trade areas, CPG distribution and marketing as the main uses.
Key features
- Visit counts, trade areas and visitor demographics per property
- Chain and industry benchmarks with no cap on properties analyzed
- Dedicated customer success manager included in the subscription
- SOC 2 and ISO 27001 certifications, renewed annually
Pricing
Placer.ai's pricing page lists plans with zero prices attached. A freemium account shows a small slice of the platform; paid packages are quoted per seat or as enterprise-wide licenses for larger organizations. Vendr's Placer Labs listing describes foot traffic insights and carries zero price data.
Pros
- A permanent free tier
- Property-level foot traffic from tens of millions of devices
- Unlimited properties, chains and industries in a paid plan
Cons
- US coverage only
- Quote-only on every paid plan, with zero Vendr price data
- 2 Capterra reviews, the thinnest evidence base on this list
A parks and recreation director summed up the use on Capterra:
"I can find out how many people visited an event, where they came from, where they went after and some demographic info."
Lori F., Parks and Recreation Director, Government Administration, Capterra, 14 March 2025
Gaps in coverage are the recurring catch. A real estate marketing coordinator wrote:
"Not all of the data has been input for all centers or stores, so sometimes you have to request data be researched."
Alisha W., Marketing Coordinator, Real Estate, Capterra, 1 March 2021
Why it’s ranked #4. A permanent free tier beats Precisely's 30-day MapInfo Pro trial; Placer.ai loses to Foursquare, which lists a $25 monthly seat where Placer.ai quotes every paid plan.
Precisely
Best fit
A risk or network-planning team that needs address-level POI data at national scale.
Precisely is a data vendor with a GIS attached. Its World Points of Interest Premium dataset holds over 250 million POIs in more than 170 countries, 27 million in the US, updated monthly and keyed to a PreciselyID that stays fixed when a business name changes.
MapInfo Pro is the desktop GIS on top, with a 30-day free trial, drivetime analysis and a Snowflake connector. In December 2022 Precisely put its portfolio at over 400 datasets and 9,000+ attributes, serving 12,000 customers in 100+ countries.
Key features
- 250M+ POIs refreshed monthly, each with a PreciselyID
- MapInfo Pro desktop GIS with Python and MapBasic scripting
- Precisely Visits for foot traffic, plus Snowflake and Databricks integration
- Gio AI assistant for natural-language spatial queries
- Free MapInfo Pro Viewer for read-only colleagues
Pricing
MapInfo Pro and the data are quote-only, sold on 1 to 3 year subscriptions. Vendr's anonymised buyer data shows a $25,116 median, ranging from $7,037 to $149,793.
Pros
- The largest POI count of any tool ranked, at 250M+
- Monthly refresh on a stable location ID
- A $25,116 median, $165 under Esri's
Cons
- 3 TrustRadius reviews for MapInfo Pro
- The trial ends after 30 days
- A desktop interface one reviewer calls "old and boring"
An IT consultant at a 1,001 to 5,000 person firm reported on TrustRadius that "Delivery time and route efficiency has been improved" after mapping sales and distribution, and named the cost in the same review:
"UI is old and boring for new users. Takes time to get into comfortable zone."
Verified User, Consultant in Information Technology, TrustRadius, 27 May 2026
Why it’s ranked #5. 250M+ bundled POIs beat Power BI, which ships zero location data; Precisely loses to Placer.ai, whose free tier never expires where MapInfo Pro's trial stops at 30 days.
Microsoft Power BI
Best fit
A business intelligence team that wants store or region KPIs on a map inside reports people already open.
Power BI is a business intelligence tool with a map visual, and that's the right fit for a common job: showing what is happening by region so managers can share one view of the numbers.
The Azure Maps visual plots a ceiling of 30,000 data points with location, legend, size and tooltip fields, which gives sales figures geographic context. Our self-service BI tools ranking covers the rest of the product.
Key features
- Azure Maps visual with bubble layers and a 30,000-point ceiling
- Free Power BI account for building reports
- Shared dashboards across teams on a Pro license
- Premium Per User for larger models and faster refreshes
Pricing
Microsoft lists Power BI Pro at $14.00 a user a month and Premium Per User at $24.00, both paid yearly, with a free account for authoring. Our business intelligence cost report sets those seats against 10 other BI vendors.
Pros
- $14 a user a month, published
- 1,893 Capterra reviews at 4.6
- Maps sit next to the sales numbers they explain
Cons
- Zero bundled demographics or POIs
- 30,000-point ceiling per visual
- Shows what happened and leaves decisions to the reader
A TrustRadius reviewer at a 51 to 200 person firm praised the "great templates such as maps and charts that integrate accurately with data updates" and flagged the limit:
"Hard to integrate data visualizations in a presentation slide, as the data is detailed and hard to showcase as a simple map/chart in the slide"
Verified User, Professional, TrustRadius, 20 November 2025
Why it’s ranked #6. A $14 seat gives business users drag-and-drop maps, beating Mapbox's $95,603 Vendr median; it trails Precisely because it ships zero location data and caps each map at 30,000 points.
Mapbox
Best fit
A product team embedding maps, search or routing into its own app.
Mapbox sells map technology to developers, and the free allowances are generous: 50,000 web map loads, 25,000 mobile users and 100,000 geocoding requests a month before billing starts. Map loads then cost $5.00 per 1,000.
Turn-by-turn navigation for drivers runs through the Navigation SDK at 100 free monthly active users, then $0.30 a user. Teams that build from scratch get the most out of it; at a $95,603 median contract, it can cost an arm and a leg for an internal dashboard.
Key features
- Mapbox GL JS and mobile Maps SDKs
- Geocoding at 100,000 free requests a month
- Directions API at 100,000 free requests, then $2.00 per 1,000
- Custom tileset processing, 10,000 MB free
Pricing
Usage pricing is published. Contract buyers pay a $95,603 Vendr median across 73 purchases, ranging from $10,562 to $470,326, the highest median here.
Pros
- Free monthly allowances on every core API
- Routing and geocoding priced per 1,000 calls
- 4.5 across 38 Capterra reviews
Cons
- Every use needs a developer writing against the API
- Demographics come from a second vendor; Mapbox bundles zero
- Paid support sits outside the base contract
A CTO wrote in March 2023 that "It has a great documentation, easy to set up, a lot of examples are available". A head of product in farming hit the support wall:
"The cheapest support plan costs 50 usd and this only guarantees you that the first response will be within 3 days."
Raphael G., Head of Product, Farming, Capterra, 22 March 2023
Why it’s ranked #7. 100,000 free geocoding requests a month beat QGIS, which hosts zero data; Mapbox loses to Power BI, whose $14 seat skips both the developer and the $95,603 contract.
QGIS
Best fit
A smaller organization with a GIS-trained analyst and zero license budget.
QGIS is free, open source under the GNU General Public License, and current: version 4.2.3 shipped on 25 September 2026, with 3.44.15 as the long-term release. It runs on Windows, macOS, Linux and BSD, and its Buffer tool draws a fixed or data-defined distance around every feature in a layer, the starting point for most catchment work.
Key features
- Full desktop GIS at $0
- Buffer, overlay and geometry tools in the Processing toolbox
- Field data through QField and Mergin Maps on Android and iOS
- Desktop builds for Windows, macOS, Linux and BSD
Pricing
$0 from QGIS.org, no strings attached. The real cost is the analyst's time and every dataset you license separately.
Pros
- $0 license fee on every release
- 4.2.3 shipped 25 September 2026, with 3.44.15 on the long-term track
- 4.5 across 100 Capterra reviews
Cons
- Zero bundled data
- Needs GIS training to use well
- Performance complaints on large jobs
A researcher on Capterra put the appeal plainly:
"One of the things I liked most about this program is that it's free and open source."
Shamza S., Researcher, Capterra, 11 August 2023
A civil engineer gave the other side in March 2025: "Its too slow when it comes to performance."
Why it’s ranked #8. QGIS costs $0 and holds 100 Capterra reviews, the floor for any buyer; it trails Mapbox, which hosts 100,000 free geocoding requests a month where QGIS hosts zero.
What a location intelligence platform does
Esri defines location intelligence as the insights gained from visualizing and analyzing geospatial data, layered with demographics, traffic and weather. Organizations buy it to make site, network and risk decisions with a map in front of them.
Three capabilities define the category:
- Spatial analysis answers distance questions, such as which customers sit within a 10-minute drive.
- Data integration lets you combine demographics, traffic and POIs with your sales table.
- Visualization puts the result on a map that a regional manager can read without training.
A picture is worth a thousand words here. A heat map shows clusters that a pivot table of the same store rows hides, and those hidden relationships are often the reason the project got funded.
GIS is the technology underneath, and most of these tools are built on it. Esri Thailand describes GIS as the software framework that stores, visualizes and analyzes location information so teams can understand what it means. The location intelligence layer adds business context: revenue, churn, footfall, claims.
Predictive work sits on top. Esri's Business Analyst lists sales forecasting, CARTO's Workflows include ML components, and Kalibrate advertises cannibalization modeling for sister stores plus a network plan that lists opportunities for new and existing markets. Each one fits a model to geographic variables and outputs a number per site, so teams can avoid opening a store that takes its sales from a sister location.
Types of location intelligence solutions
CleverMaps, a Czech vendor, splits location intelligence solutions into four categories, and the split maps cleanly onto this ranking.
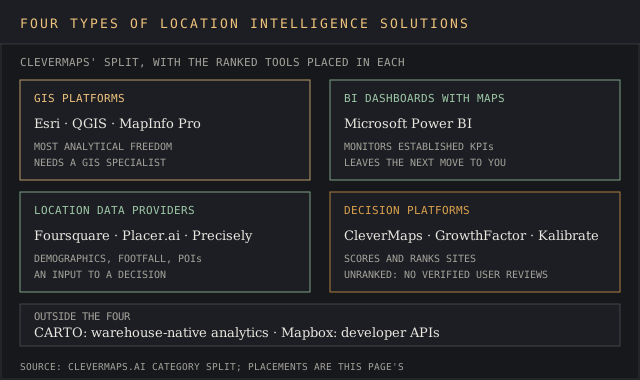
- GIS platforms (Esri, QGIS, MapInfo Pro): the most analytical freedom, and in CleverMaps' account they need specialists and custom analytical logic.
- BI dashboards with maps (Power BI): good for monitoring established KPIs; they show what is happening and leave the next move to a person.
- Location data providers (Foursquare, Placer.ai, Precisely): datasets on demographics, footfall and POIs, an input you still have to turn into a recommendation.
- Decision platforms (CleverMaps, GrowthFactor, Kalibrate): scoring sites, ranking opportunities and recommending locations for repeat decisions.
Picking one site from hundreds of candidates is a needle in a haystack job, and decision platforms are built for that question. They're also the newest type and the hardest to verify.
CleverMaps cites Generali cutting its branch network from 800 to 520. GrowthFactor's homepage shows a site evaluation in 11.6 to 12.4 seconds and says Books-A-Million achieved 19 store openings in 2025, up from 6. Both are vendor case studies, and both tools carry zero verified user reviews to check them against.
Choosing a type starts with the decisions you need to make. Pick GIS for open-ended analysis, BI for monitoring, a data provider when one signal is missing, and a decision platform when the same question repeats every quarter.
Where location data comes from
Every platform here gets its data from one of four places: census and survey demographics, POI registries, mobile device panels, or your own records. The source decides what the numbers can tell you, so combine at least two.
- Demographics: Esri's 15,000+ variables and the U.S. Census American Community Survey in CARTO's catalog.
- POI registries: Precisely's 250M+ places refreshed monthly, and Foursquare's 100M+ built on 16B+ check-ins.
- Device panels: Placer.ai's tens of millions of devices; Kalibrate sells foot traffic as Competitive Insights; Unacast says it blends location data from 12+ suppliers.
- Your own data: sales, loyalty, claims and asset records, the one layer only you hold.
Panel data comes with privacy thresholds. Placer.ai hides any location with 50 or fewer unique devices, so a quiet rural store can come back blank.
Keep an eye on that before you sign: ask each vendor for counts on 50 of your own addresses, including 10 low-traffic ones. A vendor that won't run them is a red flag.
Location intelligence use cases
Four use cases account for the lion's share of buying decisions, and each one points at a different tool on this list.
Site selection and retail
Trade areas, drive times and cannibalization, used to understand where the next store goes. Esri and the decision platforms are built for it, and our retail real estate market report carries the vacancy and rent figures a site model feeds on.
Logistics and routing
Shorter routes cut fuel and transit time for supply chain teams. Mapbox's Directions API gives 100,000 free requests a month, and the MapInfo Pro reviewer in the Precisely entry credits the route efficiency gains achieved to mapping distribution data.
Targeted marketing
Placer.ai lists marketing campaign work in its guide; Foursquare sells Audience and Proximity products that turn visit data into targeting insights for audience segmentation.
Risk and assets
Insurers and utilities map exposures and physical assets against hazards, the location layer of risk intelligence software. CARTO's catalog carries Fathom flood data, and Precisely markets multi-scale spatial clustering for risk assessment. On the asset side, an ArcGIS reviewer from Malawi on Capterra describes Field Maps crews capturing data offline and syncing it back to the office.
Shared maps also settle internal arguments. When sales, real estate & finance look at one dashboard, they're on the same page about which stores underperform, and the debate moves to decisions about them.
Pricing across location intelligence tools
The spread runs from $0 to a $95,603 median contract. Here's what each tool costs at its first realistic step.
- QGIS: $0
- Power BI Pro: $168 a user a year ($14 a month)
- Foursquare Spatial Desktop Standard: $300 a seat a year ($25 a month)
- Precisely: $25,116 Vendr median
- Esri: $25,281 Vendr median, 32 purchases
- Foursquare data contracts: $36,000 Vendr median
- Mapbox: $95,603 Vendr median, 73 purchases
- CARTO and Placer.ai: quote only
The devil's in the details, and the details are usage meters. Esri reports draw down credits, with 500 included per Creator user. Mapbox charges $5.00 per 1,000 map loads past 50,000. Foursquare's Places API bills $15.00 per 1,000 Pro calls. CARTO's premium data needs an Enterprise plan.
Kalibrate says its price depends on third-party data licensed, seat count and analytics, three dials a buyer should get quoted separately.
GrowthFactor is the one decision platform with a published number. Its $5,000 Discovery engagement buys a 30-day analysis with read-only access to the platform, and brands with 40+ stores get it free.
How to run a location intelligence trial
A trial goes better with a fixed test set. Here's a five-step plan that fits inside Esri's 21 days.
- Pick 50 of your own locations: 40 typical, 10 edge cases.
- Load them on day one and time how long the upload takes.
- Run one drive-time trade area and one demographic report on all 50.
- Count blanks: missing foot traffic, missing POIs, unmatched addresses.
- Share one map with a colleague who has no license and see what they can open.
The insights you get back are only as good as the test set.
Don't put all your eggs in one basket. Run two tools side by side on the same 50 addresses, and the coverage gaps show up in an afternoon.
FAQ about location intelligence tools
What software is commonly used for geospatial analysis?
ArcGIS and QGIS are the two most reviewed desktop options, with 507 and 100 Capterra reviews. Teams that keep data in a cloud warehouse run geospatial analysis in CARTO, and developers reach for Mapbox.
What is the best location intelligence software?
Esri ArcGIS Business Analyst for site selection with an analyst on staff, CARTO for warehouse-first data teams, and Foursquare for the lowest paid entry at $25 a month.
What is the most popular GIS software?
By review count, ArcGIS: 507 Capterra reviews against QGIS's 100. Among the free tools on this list, QGIS carries the most reviews.
What is location analysis?
Location analysis measures how distance, density and surroundings change a business result, such as sales per store or claims per postcode. It's the analysis step inside location intelligence software, and the goal is a number per site you can rank.
What is Placer.ai used for?
Foot traffic estimates for US properties: site selection, trade areas, tenant mix and marketing measurement, from a panel of tens of millions of devices.
Do you need a GIS specialist?
For Esri, QGIS and MapInfo Pro, usually yes; one ArcGIS reviewer keeps a dedicated staff member on it. Power BI, Placer.ai and CARTO Workflows target business users.
Bottom line
Esri ArcGIS Business Analyst wins for organizations that pick sites and can staff an analyst: the largest bundled variable library and the most reviewed GIS here. CARTO wins for data teams already in BigQuery, Snowflake or Databricks.
Foursquare is the budget pick for POI work, and Placer.ai is the pick for US foot traffic if you can live with quote-only pricing. Precisely suits risk and network-planning teams who need 250M+ POIs on a stable ID.
Power BI covers teams that only need KPIs on a map, Mapbox covers developers, and QGIS covers anyone with GIS skills and a $0 budget. Start with the decisions you need to make, then test two tools on 50 of your own addresses and compare the insights each returns.