SaaS statistics 2026: market size, spending, churn, marketing and onboarding benchmarks
 By Jan Suski. I go deep on every review, checking every number against its source and digging up details other coverage misses, a habit from six years of SEO and link building for tech companies. Bylines at Surfer, Brand24, and Senuto. How the scoring works.
The numbers SaaS market, spending and benchmarks, checked 4 October 2026
The highest 2026 market estimate is 41% above the lowest, so the publisher you cite sets the size of the SaaS market.
Zylo's average customer wastes $19.8 million a year on unused licenses, equal to 36% of the $55.7 million it spends.
A 101% median NRR means the typical SaaS business grows its installed base by 1% a year before a single new logo signs.
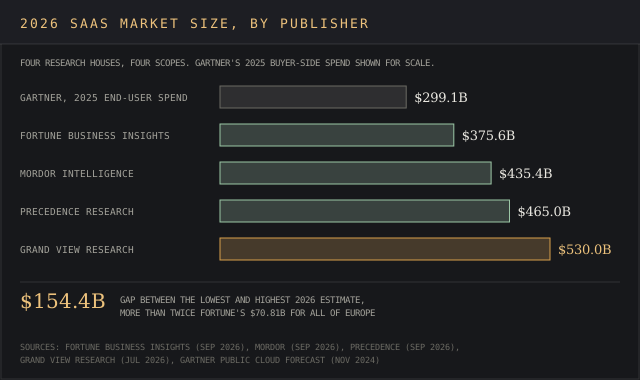
Gartner expects worldwide software spending to reach $1,468 billion in 2026, up 15.5%, according to its 27 July 2026 IT spending forecast. The software as a service share of that total depends on who's counting. Four research houses put the global SaaS market between $375.6 billion and $530.0 billion in 2026, a $154.4 billion gap that's more than twice one house's estimate for all of Europe.
This report gathers the SaaS statistics published in 2025 and 2026 across five areas, covering market size and SaaS spending, the regional and segment splits, the key metrics operators benchmark against (growth, churn, net revenue retention, CAC), SaaS marketing statistics, and SaaS onboarding stats on activation and early retention. Every figure links to the body that published it, with the report name and date.
It's written for founders, finance teams, product marketers and industry analysts who need a sourced number fast. Where publishers disagree, the figures sit side by side with the scope difference behind the gap. For the tools SaaS companies use to watch competitors and pricing, see our SaaS market intelligence guide.
Worldwide software as a service (SaaS) market size in 2026
The research houses agree on direction and disagree on market size by more than $150 billion. Fortune's report, for example, is titled Software as a Service (SaaS) Market Size, Share & Industry Analysis, and it segments the market by deployment, application, enterprise type, industry and region. All four refreshed their software as a service (SaaS) market pages between July and September 2026, and all four put North America first.
| Publisher (page date) | 2025 | 2026 | Long-range forecast | Compound annual growth rate | North America share, 2025 |
|---|---|---|---|---|---|
| Fortune Business Insights (14 Sep 2026) | $315.68B | $375.57B | $1,482.44B by 2034 | 18.7%, 2026 to 2034 | 46.9% |
| Mordor Intelligence (11 Sep 2026) | $370.4B | $435.41B | $976.61B by 2031 | 17.55%, 2026 to 2031 | 42.6% |
| Precedence Research (Sep 2026) | $408.21B | $465.03B | $1,367.68B by 2035 | 12.85%, 2026 to 2035 | 46% |
| Grand View Research (Jul 2026) | $464.7B | $530.0B | $1,109.2B by 2033 | 11.1%, 2026 to 2033 | 44.1% |
Gartner counts end-user spending, the money buyers pay, and its last public worldwide breakdown dates from November 2024. That worldwide public cloud forecast put cloud application services (SaaS) at $299.1 billion for 2025, up 19.2% from $250.8 billion in 2024.
An earlier Gartner release from November 2023 projected worldwide end-user spending on all public cloud services to pass $1 trillion in 2027, a total that counts infrastructure and platform services alongside SaaS.
SaaS made up 42.1% of Gartner's $595.7 billion worldwide public cloud total in 2024 and 41.3% of the $723.4 billion public cloud forecast for 2025, shares implied by Gartner's own table. The same table put worldwide platform as a service at $208.6 billion and worldwide infrastructure as a service at $211.9 billion for 2025, so SaaS stays the largest public cloud segment.
Infrastructure is growing faster than applications. Gartner's July 2026 worldwide forecast puts infrastructure as a service at $287 billion in 2026, up 29.3%, against 15.5% growth for software as a whole. Data center systems, the hardware line, grow 62.5% to $822 billion as cloud providers buy AI servers, inside worldwide IT spending of $6,369 billion. IT services, the biggest line at $1,570 billion, grow 5.3%.
Gartner also expects 90% of organizations to adopt a hybrid cloud approach through 2027, mixing public cloud with other infrastructure.
Why the published SaaS market estimates diverge
The devil's in the details, and scope explains most of the gap. Mordor defines the software as a service (SaaS) market as application software sold on subscription or pay-as-you-go terms, and it excludes platform as a service, infrastructure as a service, perpetual licenses and separate implementation consulting.
Mordor's own comparison table pins a $464.8 billion estimate on a publisher that adds managed services & cloud support revenue, and a $315.7 billion figure on one that leaves out freemium and usage-billed tiers.
Those two anonymized numbers sit within $0.1 billion of Grand View's $464.7 billion and Fortune's $315.68 billion for 2025. Read between the lines and the spread in SaaS market statistics turns into a definition argument, with service revenue counted in one model and left out of another.
The four houses split deployment differently too. Mordor gives public cloud 89.42% of 2025 SaaS revenue. Fortune expects public cloud deployment to hold 65.81% in 2026. Grand View and Precedence both name private cloud as the largest deployment segment, at 44%.
Revision speed is the other variable. Gartner's 2026 software forecast stood at $1,433.6 billion in its February 2026 worldwide update, after a cut from 15.2% to 14.7% growth, and rose $34.4 billion by July. A number quoted from a page refreshed in one quarter can be stale by the next.
Anyone building a sizing model faces the same choices the houses made. Our market sizing template and total addressable market template follow the top-down build Mordor describes, starting from enterprise software spend and applying a SaaS penetration ratio by company size and industry.
Worldwide SaaS market statistics by region
North America leads in every estimate, at 42.6% (Mordor), 44.1% (Grand View), 46% (Precedence) and 46.9% (Fortune) of 2025 global revenue. Fortune values the region at $148.17 billion in 2025 and the U.S. alone at $141.06 billion in 2026. Precedence puts the U.S. software as a service (SaaS) market at $132.19 billion for 2025 and $451.05 billion by 2035.
Fortune's regional split, 2025 to 2026:
- North America: $148.17 billion to $172.68 billion
- Asia Pacific: $69.43 billion (22.00% of global revenue) to $86.06 billion
- Europe: $60.04 billion (19.00% of global revenue) to $70.81 billion
- Latin America: $22.9 billion (7.30%) to $27.59 billion
- Middle East & Africa: $15.14 billion (4.80%) to $18.43 billion
Asia Pacific is the fastest growing region in Mordor's and Grand View's forecasts. Mordor's annual growth rate for the region is 18.7% to 2031, and Fortune's two-year figures imply 24.0% growth between 2025 and 2026. Fortune's 2026 country estimates, for example, put China at $19.44 billion, India at $17.25 billion and Japan at $17.05 billion. Germany ($14.81 billion), France ($13.19 billion) and the U.K. ($12.93 billion) are Europe's three biggest markets.
SaaS applications by segment, pricing model and industry
Customer relationship management is the largest application segment in two of the four houses' models, at 22.0% of 2025 revenue for Grand View and 24.58% for Mordor. Fortune ranks content, collaboration & communication first, at 29.19% of 2026 revenue, the segment holding collaboration tools such as Microsoft 365. Our CRM software cost breakdown shows what customer relationship management seats run per user.
Large enterprises take the lion's share of revenue, from 57.9% (Grand View) and 58.05% (Mordor) to 60.40% (Fortune) and 62% (Precedence). Smaller buyers grow faster, at a 21.90% CAGR in Fortune's model and 19.2% in Mordor's. The small business statistics page covers the firms behind that SME segment.
Fortune's three named growth drivers are integration with other tools, rising adoption of public and hybrid cloud based solutions, and data-driven analytics, with remote work capabilities among the benefits buyers cite. Precedence ties demand for cloud-based collaborative tools to the spread of remote work and hybrid teams, and names enterprise adoption of public cloud services as one of the main drivers of software as a service growth.
Subscription models still dominate. Mordor is the only one of the four houses that segments the market by pricing model, and it puts subscription plans at 68.2% of the 2025 market, with usage-based pricing growing at a 27.9% CAGR as AI compute gets billed per token, call or inference minute.
By industry, healthcare is the fastest-growing segment for both Fortune (26.00% CAGR, 23.37% of 2026 revenue) and Mordor (22.9% CAGR). Grand View gives banking, financial services & insurance the biggest 2025 industry share at 24.7%, and Mordor gives the IT & telecom industry 22.45%. Fortune names IT & telecom the largest industry in 2024.
Fortune ties healthcare growth to providers moving applications and storage to the cloud for hybrid and remote working. Security & compliance applications grow 24.1% a year in Mordor's model, the fastest application segment Mordor tracks.
Major SaaS companies and their scale
The largest software as a service (SaaS) vendors report revenue every quarter, which makes their filings the hardest numbers in the market. Enterprise suites dominate the list.
| Company | Period | Revenue | Growth | Detail |
|---|---|---|---|---|
| Salesforce | FY26, to 31 Jan 2026 | $41.5B | 10% | Agentforce ARR $800M (up 169%), RPO $72.4B |
| Workday | FY26, to 31 Jan 2026 | $9.552B ($8.833B subscription) | 13.1% | Enterprise HR and finance platform, more than 11,500 customers |
| ServiceNow | Q4 2025 | $3.466B subscription | 21% | 603 customers above $5M in annual contract value |
| SEG SaaS Index | 2025 | Median EBITDA margin 9.1% | Top quartile up 6% | More than 100 public SaaS companies |
Salesforce guides to $45.8 billion to $46.2 billion for fiscal 2027 and has raised its fiscal 2030 target to $63 billion. Workday expects 12% to 13% subscription growth in fiscal 2027, a step down from 14.5%. Salesforce and Workday grow at roughly half the 20% to 26% median that private-company surveys find, which is par for the course at their scale, while ServiceNow's 21% subscription growth matches it.
Deal volume says buyers still want assets from the SaaS industry. Software Equity Group counted 2,698 SaaS M&A transactions in 2025, up 28% from 2,107 in 2024, and SaaS made up about 58% of all software M&A. AI-referenced targets accounted for roughly 72% of deals, and private equity buyers took part in nearly 58%. Analytics & data management and content & workflow management were the two busiest product segments, with nearly 38% of deal volume between them.
The U.S. has about 17,000 SaaS companies and Canada about 2,000, a count both Fortune and Precedence publish for the SaaS industry, with Precedence dating it to March 2023.
SaaS spending statistics: what companies pay
Zylo's data shows the average organization spent $55.7 million on SaaS in 2026, up 8%, while its portfolio held flat at 305 SaaS applications (down 0.07%). The median is $20.6 million. Enterprise customers above 10,000 employees spend $123.5 million to $375.5 million, and SaaS spending at the largest companies rose about 16% in a year, per Zylo's own summary of its index, drawn from 40 million licenses and $75 billion in managed spend.
SaaS spend per employee and price inflation statistics
Measured per head, SaaS spending looks smaller. Vertice puts SaaS spend per employee at $9,324 in Q2 2026, up 1.3% after three flat quarters at $9,200. Its SaaS inflation index climbed from 12.1% in April 2026 to 14.2% in May and 16.4% in June, past the previous high of 14.7% in November 2025.
Seventy-nine percent of IT leaders in Zylo's survey saw price increases at renewal, and 61% cut projects because of unplanned SaaS costs. Vertice says shrinkflation compounds it, with vendors pairing list-price increases with reduced access to different features at the same tier.
License waste and redundant applications
Waste remains the elephant in the room. Zylo's license utilization rose from 47% in 2024 to 54% in 2025, which cut average waste from $20.9 million to $19.8 million per organization. Vertice counts 14% of SaaS apps as unused and 51% as underutilized, and 63% of IT teams in BetterCloud's survey say unused SaaS apps and budget pressure push them to consolidate redundant applications.
Renewals carry the cost. SaaS renewals make up 87% of total software spend in Zylo's data, across an average of 211 renewals a year. Vertice says buyers using its pricing benchmarks get an average 33.8% discount from list price, a cost savings claim from a vendor that sells those benchmarks. Our pricing intelligence guide and the software pricing errors study cover the cost optimization side.
AI's share of SaaS spending
AI apps take the fastest-growing share of new spend. Zylo recorded a 108% jump in spend on AI-native apps, 393% among the largest companies, with $1.2 million spent on AI-native SaaS tools by the average organization, for example chat assistants and AI coding tools sold per seat or per token. Use of applications in the AI category grew 181%, the fastest growth in Zylo's dataset.
High Alpha's 2025 survey shows how quickly AI adoption moved over the last decade. None of its respondents founded in 2016 called AI core to the product, against 100% of companies founded in 2025. Fewer than 25% of its respondents measure internal AI adoption with KPIs or dashboards.
BetterCloud's 2026 State of SaaS survey of 525 IT professionals found 22% of current tech stacks are AI-powered, up from 7% a year earlier, and the average company runs 27 AI-powered SaaS apps. More than a third of those AI tools bill on usage or tokens alone.
Gartner's September 2026 forecast puts worldwide AI software at $461.6 billion in 2026, up from $288.2 billion, inside $2.67 trillion of total AI spending (up 49.5%). Server hardware built for AI remains the largest single area of that spending, Gartner says. The AI statistics page has the wider picture.
SaaS security and shadow IT statistics
Employees buy SaaS tools faster than security teams can review them. The Cloud Security Alliance's State of SaaS Security Report 2025, a survey of 420 IT and security professionals commissioned by Valence Security, found 55% of employees adopt SaaS applications without security's involvement. Zylo describes IT and security teams as stretched thin and short of the resources to keep pace.
BetterCloud puts the share of SaaS apps that aren't IT-sanctioned at 44%, and Zylo's count of expensed applications, the ones that slip under the radar of IT review, rose from 125 to 138. BetterCloud's average company runs 118 SaaS applications in 2026, up from 106, the first rise after two years of consolidation.
The CSA figures on SaaS security, in full:
- 86% of organizations rank SaaS security as a high priority, and 76% are raising budgets
- 63% report external data oversharing
- 56% say employees upload sensitive data to unauthorized SaaS solutions
- 58% struggle to enforce access privileges, and 54% lack lifecycle automation
- 46% struggle to monitor non-human identities, and 56% worry about overprivileged API access
Misconfigurations, permissions and visibility
Confidence runs ahead of results. In AppOmni's 2025 State of SaaS Security Report, 91% of organizations said they were confident in their SaaS security posture. Among incidents, 41% involved user permissions and 29% came from misconfigurations, and about 89% of breached organizations believed they'd had appropriate visibility. Only 16% assign SaaS security solely to the security team, while 43% leave it to business units.
Security now slows SaaS purchases too, and buyers vet SaaS tools before signing. IT security review is the biggest single source of delay for 39% of buyers in G2's 2026 survey, rising to 50% among enterprise buyers. The cybersecurity statistics page covers breach costs, and the end of life software page explains what happens when a vendor stops patching.
SaaS business metrics: growth, churn, retention and CAC
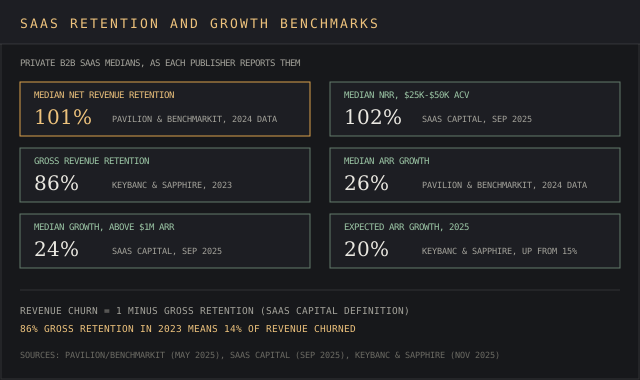
Private SaaS growth turned up in 2025 after two years of decline. The 16th annual KeyBanc Capital Markets and Sapphire Ventures survey, released 13 November 2025, expects ARR growth of 20% in 2025, up from 15% in 2024, and finds 67% of companies already make money from AI features.
| Metric | Value | Publisher, data period |
|---|---|---|
| Median ARR growth | 26% | Pavilion and Benchmarkit, 2024 data |
| Expected ARR growth | 20% in 2025, from 15% in 2024 | KeyBanc and Sapphire, November 2025 |
| Median growth, companies above $1M ARR | 24% | SaaS Capital, September 2025 |
| Median net revenue retention | 101% | Pavilion and Benchmarkit, 2024 data |
| Median NRR at $25,000 to $50,000 ACV | 102% (top quartile 111%, bottom 97%) | SaaS Capital, September 2025 |
| Gross revenue retention | 86% in 2023, approaching 90% | KeyBanc and Sapphire, November 2025 |
| Change in new customer acquisition cost | Up 14% | Pavilion and Benchmarkit, 2024 data |
| Share of new ARR from existing customers | 40%, over 50% above $50M ARR | Pavilion and Benchmarkit, 2024 data |
Churn falls out of gross retention. SaaS Capital defines revenue churn as one minus gross revenue retention, so KeyBanc's 86% for 2023 means 14% of revenue walked out the door, and the 90% norm High Alpha describes ("retaining 9 out of 10 customers") means about 10%. Net retention stays above 100% because upsells and price increases refill the bucket.
SaaS companies focusing on bigger contracts keep more revenue. SaaS Capital finds net retention rises with annual contract value, and companies at the top of the ACV range post the best gross retention, since long buying cycles and dedicated account teams make the product stickier. An NRR below 100% is a red flag in SaaS Capital's data, where those companies grow slower than the 24% median.
Profitability is catching up with growth. SaaS Capital's 2026 spending benchmarks, drawn from more than 1,000 private B2B companies surveyed in March 2026, show median total spend at 96% of ARR for bootstrapped firms and 101% for equity-backed ones. That leaves 83% of bootstrapped companies at or near breakeven against 52% of equity-backed peers, and KeyBanc expects median EBITDA margins to turn positive in 2026.
Customer success and expansion revenue
Expansion becomes the growth engine at scale. High Alpha finds companies above $50 million in ARR take roughly 60% of new ARR from existing customers, and more than 60% of Salesforce's Q4 Agentforce and Data 360 bookings came from expansion.
SaaS Capital's median spend on customer support & customer success is 9% of ARR, up from 8%. High Alpha tells founders to focus on expanding within existing customers. Our customer intelligence guide covers the data teams use to spot expansion and customer retention risk early.
SaaS marketing statistics: budgets, buyers and channels
SaaS companies spend less on marketing than on selling. SaaS Capital's 2026 medians put marketing at 8% of ARR, unchanged, and selling costs at 15%, up from 13%. Equity-backed companies put more resources into marketing, spending 100% more on it than bootstrapped ones.
Pavilion and Benchmarkit find VC-funded companies put 47% of revenue into go-to-market against 33% for PE-backed firms, and Workday's $2.616 billion go-to-market line equals 27.4% of its fiscal 2026 revenue.
Buyers would sooner skip the rep, and the website does more of the work. Gartner's June 2025 survey of 632 B2B buyers found 61% prefer a rep-free buying experience, 73% actively avoid suppliers who send irrelevant outreach, and 69% report inconsistencies between a supplier's website and what its sellers say. For a SaaS business, the pricing page and the website now carry most of the pitch.
Evaluation now takes the most time. Buyers focus on it as the longest stage of the buying process in G2's data, passing research for the first time.
Where software buyers build a shortlist
Where B2B software buyers build a shortlist, per G2's 2026 Buyer Behavior Report (more than 1,000 buyers, published July 2026):
- 82% sourced recommendations for SaaS solutions from an AI chatbot in the last 24 months
- Review sites are the top source shaping the shortlist at 38%, passing AI chatbots (37%) for the first time
- Finance involvement in software decisions jumped from 31% to 46% in a year
- Worry about internal resistance to AI adoption rose from 16% to 29%
- 70% say the pace of AI is pushing them toward shorter contracts
Review sites edge out chatbots by one point, so buyers attach slightly more importance to them and review-site social proof now outranks every other shortlist source, which explains the money vendors put into profiles.
Our G2 pricing breakdown lists what vendors pay for that visibility. High Alpha's 2025 respondents rated events the most effective channel across all ARR bands, with SEO and content marketing gaining as companies scale, and the search engine marketing statistics page covers the paid side.
SaaS onboarding stats: activation, time to value and early retention
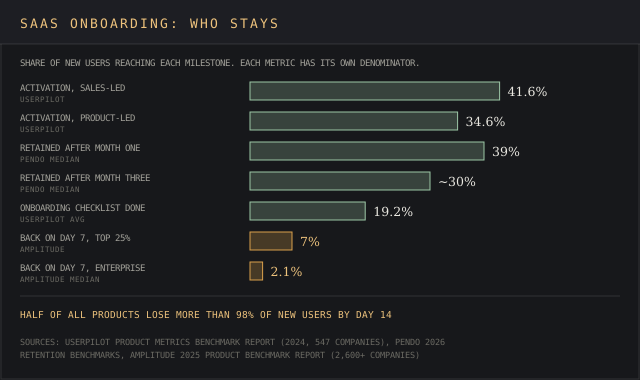
Most new users leave in the first week. Amplitude's analysis of its 2025 Product Benchmark Report, covering more than 2,600 companies, found that getting 7% of a new cohort of users back on day seven puts a product in the top 25% for activation. For half of all products, more than 98% of new users are gone by day 14.
Enterprise software shows the widest gap with new users. The top 10% of enterprise products bring back 12.4% of users on day seven, while the median manages 2.1%. Of the top day-seven performers, 69% were also top performers at three months, so the first week predicts the quarter. Amplitude's advice is to create activation checkpoints across those seven days, each one taking users a step closer to the core action.
Activation and time to value for new users
Userpilot's Product Metrics Benchmark Report, built on first-party data from 547 SaaS companies and published in 2024, gives the onboarding numbers, and sales-led products hit the ground running on every one except one-month retention:
- Average onboarding checklist completion: 19.2% of users, with fintech & insurance highest at 24.5%
- User activation: 41.6% of users for sales-led companies, 34.6% of users for product-led ones
- Time to value: users reach it in about 1 day 11 hours (sales-led) and 1 day 12 hours (product-led)
- Core feature adoption: 26.7% of users sales-led, 24.3% product-led, 31% in HR software
- One-month retention: 48.4% of users for product-led companies, 39.1% for sales-led
Early retention benchmarks for SaaS users
Pendo's 2026 benchmarks land close to Userpilot's figure. The median product keeps 39% of new users after one month and about 30% after three months, so software loses 70% of its users in a quarter.
Pendo's own advice is to create in-app and out-of-app messaging so users keep finding features at their own pace. The top 10% retain 1.7 times as many users as average in month one. Companies with fewer than 200 employees keep 40 of every 100 users after one month, 34 after two and 16.7 after three.
In Userpilot's data, 80% of companies with activation above 50% used video, GIFs or animation to show users around, a cheap fix worth a look before a rebuild.
Vendors of SaaS tools for product analytics publish these benchmarks from their own customers' data, so their customers set the baseline. Our product intelligence guide explains how teams use the same event data to zero in on the activation step, and the Hotjar vs Amplitude comparison covers two of the tools that measure it.
What is replacing SaaS seat licenses
Gartner says up to $234 billion of enterprise application spending is exposed to what it calls agentic arbitrage between now and 2030, roughly 20% of enterprise application SaaS spending by that year, as agents finish tasks across several systems and users open fewer application screens.
Gartner expects enterprise buyers to focus on outcomes and buy fewer new tools or dashboards, and it says new entrants delivering horizontal agentic platforms will take share from legacy SaaS vendors.
In its 1 July 2026 release, Managing VP George Brocklehurst called the shift "less an apocalypse and more of a metamorphosis."
The seat is losing ground in buyers' contracts, and subscription models priced per user are the first to give way. G2 found half of buyers have already been offered a variable-cost option in place of a seat license, another 42% have been told one is coming, and preference for outcome-based pricing doubled from 11% to 23% since 2025.
Zylo found 78% of IT leaders hit unexpected charges tied to AI features or consumption pricing, so each AI add-on can create a budget line nobody planned for.
The incumbents are selling agents on top of seats. For example, Salesforce's Agentforce reached $800 million in ARR, up 169%, and Agentforce accounts in production rose nearly 50% in a quarter, a sign of adoption beyond pilots.
That ARR is still a drop in the bucket next to $41.5 billion of annual revenue, about 1.9% of it. Workday logged 1.7 billion AI actions across its platform in fiscal 2026 after buying Pipedream, an integration platform with more than 3,000 pre-built connectors that cut the manual work of wiring apps together.
Integrations already decide many deals. In the 2024 State of SaaS Integrations Report by Partner Fleet, Paragon and PartnerStack, 84% of software businesses called integrations "very important" or a "key requirement" for their customers, and integrations come up in 60% of deals.
Gartner expects agentic platforms to deliver automation across systems, so users touch fewer application screens and seat counts stop tracking the work done. The jury's still out on how much seat revenue those agent products replace.
How these SaaS statistics were collected
Every one of these SaaS statistics was read on the publisher's own page on 4 October 2026. The sources are research-house reports, Gartner press releases, company earnings releases, and the industry benchmark studies each publisher released under its own name. Figures that appear only on third-party roundup pages were left out.
Several benchmark publishers sell software as a service (SaaS) products to the people they survey. Zylo and Vertice sell SaaS management and procurement tools, BetterCloud and AppOmni sell SaaS operations and security products, and Userpilot, Pendo and Amplitude sell product analytics. The CSA report was commissioned by Valence Security.
Their samples come from their own customers and audiences, for example 547 companies for Userpilot, 2,600 for Amplitude and 525 IT professionals for BetterCloud. Keep an eye on that when lining them up against Gartner or SaaS Capital, which survey the wider business population.
Frequently asked questions
What is the 3 3 2 2 2 rule of SaaS?
It's T2D3, short for "triple, triple, double, double, double", a growth path Battery Ventures partner Neeraj Agrawal laid out in a 2 February 2015 post. A company at $2 million in ARR triples to $6 million, then $18 million, then doubles to $36 million, $72 million and $144 million, the run he tied to a $1 billion valuation.
How big is the SaaS market?
The worldwide software as a service (SaaS) market size was between $375.6 billion and $530.0 billion in 2026, depending on the research house. Fortune Business Insights publishes the low figure and Grand View Research the high one, with Mordor ($435.4 billion) and Precedence ($465.0 billion) in between.
What is the rule of 40 in SaaS?
A company's revenue growth rate plus its profit margin should total at least 40%. A business growing 25% with a 15% EBITDA margin passes. High Alpha's 2025 benchmarks find companies pairing high NRR with low CAC nearly double their growth rates and Rule of 40 scores against peers.
What are the top 10 SaaS metrics?
ARR, ARR growth, net revenue retention, gross revenue retention, revenue churn, customer acquisition cost, CAC payback, expansion share of new ARR, ARR per employee and the Rule of 40. Pavilion and Benchmarkit put ARR per employee at $200,000 for companies with $50 million to $100 million in ARR, and most of the other medians sit in the business metrics table above.
What are the 5 most important metrics for SaaS companies?
Growth, NRR, GRR, CAC efficiency and burn or profit margin cover most investor questions. In 2024 data the medians were 26% growth and 101% NRR (Pavilion and Benchmarkit), with gross retention near 90% (KeyBanc and High Alpha).
Why is SaaS falling?
Growth has slowed at scale and buyers are questioning the per-seat business model. Salesforce grew 10% in fiscal 2026, new customer acquisition costs rose 14% in Benchmarkit's data, and Gartner puts up to $234 billion of application spend at risk from AI agents by 2030.
How many SaaS companies are there?
About 17,000 in the U.S. and 2,000 in Canada, per Fortune Business Insights and Precedence Research, with Precedence dating the count to March 2023.
How to calculate SaaS metrics?
SaaS Capital calculates net revenue retention as December recurring revenue from customers who were customers a year earlier, divided by total recurring revenue a year earlier. Gross retention uses the same formula with upsells, cross-sells and price increases removed, and churn equals one minus gross retention.
What does SaaS stand for?
Software as a service (SaaS) is software the vendor hosts on its own servers, networks and computing resources, accessed online on a subscription or usage basis with no installation on each computer. Gartner files it as cloud application services, the largest public cloud segment in its forecasts.
What is replacing SaaS?
AI agents and usage-based or outcome-based pricing are replacing the per-seat model inside software as a service contracts. Mordor forecasts usage-based SaaS growing at a 27.9% CAGR, and G2 says 91% of buyers have been offered, or told to expect, variable pricing.
Bottom line
The SaaS industry is worth $375.6 billion or $530.0 billion in 2026 depending on whose scope you accept, and Gartner's buyer-side count sits below both. Pick one publisher, name it, and keep its definition when you compare years. Mixing a Grand View base with a Fortune growth rate produces a hybrid forecast with two definitions inside it.
Inside companies, the numbers that matter moved in opposite directions. Prices rose 16.4% in June 2026 while license utilization reached only 54%, and buyers responded by pushing for shorter contracts and variable pricing. On the vendor side, NRR near 101% and gross retention near 90% mean growth still depends on new logos and on onboarding that keeps more than 7% of users past the first week.
The publishers behind every SaaS figure, and the counts nobody publishes
Market size: fortunebusinessinsights.com (report updated 14 September 2026), mordorintelligence.com (page updated 11 September 2026), precedenceresearch.com (September 2026) and grandviewresearch.com (July 2026). Gartner forecasts on gartner.com: releases of 29 November 2023, 19 November 2024, 25 June 2025, 3 February 2026, 1 July 2026, 27 July 2026 and 16 September 2026.
Companies and deals: salesforce.com (fiscal 2026 results, 25 February 2026), newsroom.workday.com (24 February 2026), newsroom.servicenow.com (28 January 2026) and softwareequity.com (2026 Annual SaaS Report).
Spending and security: zylo.com (2026 SaaS Management Index, and its summary updated 8 February 2026), vertice.one (inflation and spend-per-employee pages updated July 2026), bettercloud.com (State of SaaS 2026, statistics page of 18 August 2026), cloudsecurityalliance.org (21 April 2025) and appomni.com (2025 State of SaaS Security Report).
Benchmarks and buyers: investor.key.com (13 November 2025), saas-capital.com (18 September 2025 and 10 June 2026), highalpha.com (2025 SaaS Benchmarks Report), joinpavilion.com (May 2025, 2024 data), company.g2.com (22 July 2026), partnerfleet.io (2024 State of SaaS Integrations Report) and linkedin.com (Neeraj Agrawal, 2 February 2015). Onboarding: userpilot.com (2024), pendo.io (2026 benchmarks) and amplitude.com (30 September 2025).
Every figure was checked against its publisher's page on 4 October 2026. No primary source publishes SaaS application counts by industry, Gartner's last public worldwide SaaS spending split dates from November 2024, and the 17,000 U.S. SaaS companies figure dates to March 2023.