Gen Z statistics 2026: 2 billion people, $12T spending power, 45% thriving
 By Jan Suski. I go deep on every review, checking every number against its source and digging up details other coverage misses, a habit from six years of SEO and link building for tech companies. Bylines at Surfer, Brand24, and Senuto. How the scoring works.
The numbers Gen Z population, money, well-being and work, checked October 2026
Gen Z's spending power is rising fastest at the exact moment 48% of Gen Zs say they don't feel financially secure, so the money is real and it's spent carefully.
Online access is close to universal for U.S. teens, with 95% holding a smartphone and 46% online almost constantly, so a channel plan that skips mobile skips the cohort.
Roughly 50 million eligible voters in 2026, against the nearly 70 million U.S. Gen Zers counted in 2023, means about 7 in 10 of the American cohort can now vote.
Brands, agencies and recruiters quote Gen Z numbers in every plan. Send the country, the age band or the category and I'll source a version you own.
Generation Z is about 2 billion people, a quarter of the global population, and NIQ and World Data Lab project Gen Z's spending power at $12 trillion by 2030. In the United States, members of Generation Z numbered nearly 70 million in 2023, about 21% of the population, by the Annie E. Casey Foundation's KIDS COUNT count. Only 45% of them were thriving in 2025, the lowest reading in three years.
This report collects the figures on Generation Z that marketers, recruiters and analysts cite most, and traces each one to the body that published it: Pew Research Center, the CDC, Deloitte, Gallup, Bank of America, PwC, Piper Sandler, Tufts CIRCLE and the Spend Z global report. It covers population, Gen Z spending and consumer spending forecasts, social media, mental health, money and work.
It's written for brand teams sizing Gen Z consumers, employers hiring Gen Z workers and researchers who need a number with a name attached. Every figure was checked against its publisher in October 2026, and the section on why the houses disagree comes before the advice on using them.
How many Gen Zers there are and who counts as Gen Z
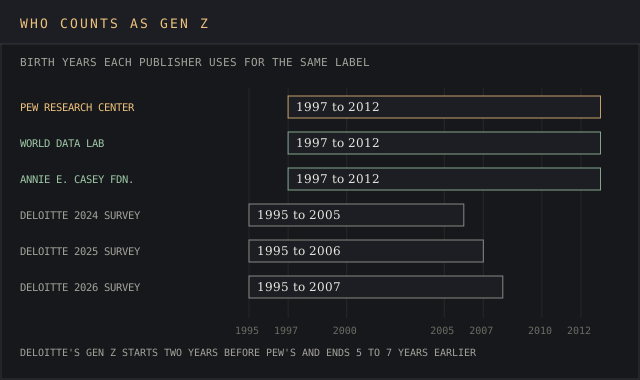
Pew Research Center draws the line at 1997. Its January 2019 note by Michael Dimock, Where Millennials End and Generation Z Begins, puts Millennials at 1981 to 1996 and calls anyone born from 1997 onward Generation Z. Pew, the Spend Z model and the Annie E. Casey Foundation close the cohort at 2012, which makes Gen Zers 14 to 29 years old during 2026.
Birth years and other global gen labels
Generation Z goes by several names in search results and survey reports, and a global gen comparison has to catch all of them:
- Zoomers, the informal label.
- iGen and post-millennials, used in early academic work.
- The homeland generation, a label from generational theory.
- Digital natives, a description that also gets applied to younger generations.
Cutoffs move by publisher and by country, and the next generation starts where Generation Z ends: KIDS COUNT dates Gen Alpha from 2013. Deloitte's global survey defines Gen Z as born from January 1995 to December 2007, two years earlier than Pew at the front end.
Bank of America's 2025 study sampled Gen Z adults aged 18 to 28, and PRRI's fact sheet used 18 to 25. A Gen Z report built on any of these is measuring a different age group, so the birth years belong in the citation.
Copy these lines into an email, fill them in and send. I reply with scope and a price within 2 to 3 business days.
Open the emailLargest generation status and the demographic snapshot
Worldwide, Generation Z is the largest generation. World Data Lab counts 2 billion Gen Zers, about 25% of the global population, and says the cohort is larger than Millennials. Its Spend Z page adds that two thirds of Gen Z live in Asia and Africa.
The U.S. picture runs the other way. KIDS COUNT counted 72.7 million Millennials in 2023 against nearly 70 million Gen Zers, so the largest generation in America is still the one before. California holds about 8.1 million Gen Zers and Texas 6.9 million, while Wyoming and Vermont have about 123,000 and 126,000.
The U.S. cohort keeps growing through immigration. KIDS COUNT data show Gen Z went from 57 million in 2010 to nearly 70 million in 2023, as the last birth years arrived through 2012 and immigration kept adding foreign born young people. Pew put the foreign born share at 6% in 2019, with 22% of Gen Zers having at least one immigrant parent.
Most diverse generation: race, ethnicity and identity
Generation Z is the most diverse generation of American adults. KIDS COUNT's 2023 breakdown, published in the Annie E. Casey Foundation's generation Z statistics, splits the cohort this way:
- 50% non-Hispanic white, against 54% of Millennials, 59% of Gen X and 71% of baby boomers.
- 25% Latino.
- 15% Black.
- 6% Asian or Pacific Islander and 5% multiracial.
Gen Alpha, born from 2013, is already 48% white against 50% for Generation Z, so the title of most diverse generation passes down the line. PRRI's 2023 American Values Atlas found 24% of Gen Z adults identify as LGBTQ, against 15% of Millennials and single digits for older generations: 6% of Gen X and 4% of baby boomers. The figure was 31% for Gen Z women and 18% for Gen Z men.
Spend Z global report and Gen Z report highlights
Most Gen Z spending figures trace back to one source. NIQ and World Data Lab released the Spend Z global report in June 2024, built on World Data Lab's consumer model covering 194 countries, 9,400+ cities and 200+ consumer categories through 2030. Its headline findings:
- Gen Z's spending power reaches $12 trillion a year by 2030, when the cohort overtakes Boomer spending, per the NIQ release.
- Gen Z adds $2.7 trillion in new consumer spending by 2030, on World Data Lab's page.
- Two thirds of Gen Z consumers live in Asia and Africa.
- Gen Z adds more than $9 trillion in global spending by 2034, the most of any generation, in NIQ's release.
- Gen X outspent Generation Z by 40% in 2025 and stays the highest-spending generation until 2033.
Per head, Gen Z spending is already higher. World Data Lab writes that by age 25, U.S. Gen Z mean and median spending outpaces earlier cohorts, and that Gen Z spends more per capita than previous generations did at the same age.
Its page calls Gen Z the richest generation. Gen Z's lead is per person, though, since Gen X still outspends it in total consumer spending. Wolfgang Fengler, World Data Lab's CEO, called Gen Z "the richest" generation ever in the NIQ release. NIQ words the richest generation point as a forecast: Gen Z could become the wealthiest generation in every region.
Gen Z's spending power by region and category
The global report doesn't name the single country with the highest spending growth for Gen Z spending. NIQ's release says North America, Europe and Asia-Pacific keep the bulk of the dollars, and Gen Z holds a larger share of consumption in Sub-Saharan Africa and the Middle East and North Africa. World Data Lab adds that Gen Z spending growth "is not evenly shared" across regions.
On categories the two publishers agree. Health and wellness and alcohol and beverages show the most dynamic demand in Gen Z spending, with beauty and food close behind through 2030. Retailers sell to this cohort in physical stores more than the social-commerce headlines suggest: NIQ found in-store purchases made up almost half of Gen Z's share of dollars.
Gen Z's spending power in these forecasts is consumer spending on goods and services, modelled across 194 countries, so Gen Z spending grows with headcount and with income. The full Spend Z report is a paid NIQ and World Data Lab product. World Data Lab offers a free preview of the global report on its Spend Z page, and that preview is where the 53% buy-button figure below comes from.
Gen Z spending: what Gen Z consumers buy and why
Gen Z spending fell in 2025 even as the long-range forecasts of Gen Z's spending power climbed. PwC's analysis of nearly a million consumer transactions, published in October 2025 as The Gen Z paradox: Spending less, expecting more, found overall Gen Z consumer spending, the Gen Z spending PwC tracks through card and e-receipt panels, dropped 13% from January to April 2025. Apparel, accessories and electronics took most of the cut in consumer spending.
The holiday plan followed suit. Gen Z consumers told PwC they'd cut holiday spending by 23% in 2025, a year after planning a 37% increase, while still budgeting an average of $1,357. Asked what they'd cut over the next six months, 51% named restaurants and takeout, 33% clothing and 29% alcohol. PwC also listed streaming services among the categories Gen Z consumers would trim.
Value drives Gen Z shopping habits and the consumer spending behind them, and PwC's numbers show how far:
- 82% planned to buy cheaper alternatives, or dupes, for the holidays.
- 63% planned to shop for vintage or upcycled products.
- 79%+ wait for sales, and 21% regularly pay full price.
- 59% prefer known brands, and 41% would buy cheaper private-label goods.
- 64% have used buy now, pay later at least once, according to LendingTree data PwC cites.
Store trips are coming back into Gen Z shopping habits too, and purchasing decisions often finish at a shelf. The share of Gen Z shoppers planning to shop in-store more often than usual rose from 27% in 2024 to 37% in 2025, and 41% of them said they wanted to touch and see products. The broader Black Friday statistics show the same tilt toward physical stores during discount weeks.
Purchasing decisions start on a phone and still end in a store for many Gen Z consumers. PwC found 61% of Gen Z prefer to discover new products in-store, and 43% look to social media for gift ideas, so one shopper shows up on both sides of the channel data. Credit is the newest of the Gen Z shopping habits among Gen Z consumers: 11% named buy now, pay later as a top-three holiday payment method in 2025, up from 5% in 2024.
Gen Z teens: teenage spending patterns and Gen Z shopping habits
Gen Z teens spend less than they did a year ago, and teen Gen Z shopping habits run through a handful of brands. Piper Sandler's Fall 2025 Taking Stock With Teens survey of 10,969 U.S. teens, average age 15.7, put self-reported annual Gen Z spending at $2,213 per teen, down 6% year over year. The October 2025 release lists where that money goes:
- Nike leads what retailers sell to teens as the No. 1 clothing and footwear brand, with Hollister and Brandy Melville next in clothing.
- Chick-fil-A is the top restaurant chain, ahead of McDonald's and Chipotle.
- Amazon is the top shopping website for upper-income teens.
- The core beauty wallet is $336 a year, down 2%, and e.l.f. is the No. 1 cosmetics brand among female teens.
- 87% of teens own an iPhone.
Gen Z consumers in high school pick their platforms as narrowly as their brands. The same survey found TikTok was the favorite app for 46% of teens, Instagram for 31% and Snapchat for 14%. Sephora led beauty shopping, which lines up with the category growth in the beauty statistics report.
Personal values and values-led buying
Personal values change the purchasing decisions of Gen Z consumers, and the surveys put numbers on it. Deloitte's 2024 survey of 14,468 Gen Zs in 44 countries found 64% willing to pay more for environmentally sustainable products. NIQ's Spend Z work reported that 77% of Gen Z say they won't buy from countries with poor environmental standards, a filter on Gen Z spending that brands can't discount their way past.
Climate change sits behind much of this. The same Deloitte survey found 54% of Gen Zs say they and their colleagues are putting pressure on their employers to act on climate change. Values reach the job market too. In the same Deloitte 2024 release, 44% of Gen Zs said they had rejected an employer over personal values and 50% had turned down an assignment.
Social media: where Gen Z discovers and shops
Social media platforms are the main discovery channel for Gen Z shopping habits and for Gen Z consumers' purchasing decisions. McKinsey's July 2026 chart from its State of the Consumer survey, with 929 Gen Z respondents fielded in March and April 2026, found social media is Gen Z's most important source for brand discovery and purchase, while baby boomers still rely on stores.
PwC's holiday data show the gap in Gen Z shopping habits against other generations. Gen Z shoppers expected to use social media platforms for gift ideas at 43%, against 30% of all shoppers; 39% planned to use social media for product research, against 27%. World Data Lab reports that 53% of Gen Zers have used buy buttons on social media networks, more than half of the cohort.
TikTok Shop is where many of those buy buttons sit, and the TikTok statistics page tracks its sales. Brands that measure creator influence on conversions can also check the creator economy statistics for ad spend benchmarks.
Gen Z on social media and online video
Nearly half of U.S. teens in Generation Z are online almost constantly. Pew's survey of 1,391 teens aged 13 to 17, fielded September 18 to October 10, 2024, put that share at 46%, up from 24% a decade earlier, and found 95% had access to a smartphone. Reach across social media platforms among Gen Z teens in the same survey:
- YouTube 90%, with 15% on it almost constantly.
- TikTok 63%, nearly two thirds, with 16% almost constantly.
- Instagram 61%, with about half of teens using it daily.
- Snapchat 55%.
- Facebook 32%, down from 71% in 2014 to 2015.
Time on these apps runs to hours. Gallup's survey of 1,591 adolescents aged 13 to 19, fielded in mid-2023, found teens spend 4.8 hours a day on social media, including 1.9 hours on YouTube and 1.5 hours on TikTok. Online videos take the biggest share of that time, and young viewers split daily video viewing between Netflix at 30% and YouTube at 27% in Piper Sandler's Fall 2025 data.
Young viewers also monitor and trim their own screen time, on social apps and on streaming services alike. Pew's 10 facts about teens and social media reports that 44% of teens had cut back on social media in 2024, up from 39% in 2023. Some 45% said they spend too much time there, and 48% said social media has a mostly negative effect on people their age.
Social media also holds significant influence on how teens learn about their own health. Pew found 34% of teens get mental health information on social media at least sometimes, and 63% of those teens call it an important source or the most important one. Online videos are a large part of that feed, since YouTube alone reaches 90% of members of Generation Z in their teens.
Mobile devices are the access point, with 95% of teens holding a smartphone in Pew's data. The platform-by-platform detail sits in five other reports:
- The YouTube statistics report.
- The Instagram statistics report.
- The Snapchat statistics report.
- The wider picture in the social media statistics roundup.
- Subscriptions and churn on streaming services, in the streaming statistics page.
Gen Z mental health statistics
Mental health is the area where the numbers on Generation Z look worst, and the numbers improved slightly after 2021. The CDC's Youth Risk Behavior Survey Data Summary and Trends Report, published August 2024, recorded these 2023 rates for U.S. high school students:
- 40% felt persistently sad or hopeless, down from 42% in 2021.
- 20% seriously considered attempting suicide, down from 22%.
- 16% made a suicide plan and 9% attempted suicide.
- 29% reported poor mental health in the past 30 days.
Personal safety sits in the same CDC series. In 2023, 13% of high school students skipped school at least once in the past 30 days because they felt unsafe at school or on the way, 19% were bullied on school property and 16% were bullied electronically, so personal safety for Gen Z teens reaches onto their phones.
Gen Z young adults report similar strain. A Census Bureau survey in fall 2022 found 33% of young adults ages 18 to 24 felt down, depressed or hopeless on more than half of the days in the prior two weeks, per KIDS COUNT. Oliver Wyman Forum's US and UK survey found about 65% of Gen Z reported at least one mental health condition in the past two years, against about 35% of other generations, and called Gen Z 1.9 times as likely to struggle with mental health issues.
Treatment lags the need. Mental Health America's 2024 State of Mental Health in America report, as summarized by the Annie E. Casey Foundation, found 56% of youth aged 12 to 17 with major depression received no treatment.
Oliver Wyman counted nearly half of Gen Zers being treated for anxiety, depression or post-traumatic stress, against about a quarter of other generations, and 39% using in-person or online therapy services, which is the subject behind the commonly quoted line that over a third of Gen Z seek counseling.
Stress at work is falling from a high. Deloitte's 2024 survey found 40% of Gen Zs felt stressed or anxious all or most of the time, down from 46% in 2023. Young women fell furthest: Gallup counted 37% of adult Gen Z women as thriving in 2025, down from 46% in 2024.
Mental well being shows up in the job data too. Gen Zs with positive mental well-being were far more likely to say their job lets them make a meaningful contribution to society, 67% against 44% for those with poor mental well-being, in Deloitte's 2025 release. Long working hours drove stress for 51% of Gen Zs and Millennials in Deloitte's 2024 data, and mental health issues sit next to money worries in every survey cited in the next section.
Money and Gen Z's greatest concern
Cost of living is Gen Z's greatest concern among members of Generation Z worldwide, and it has topped Deloitte's list for five consecutive years through the 2026 survey. Tufts CIRCLE's survey of 5,549 young people and young adults aged 18 to 29, fielded in early 2026, found 65% named cost of living and inflation as a top concern, ahead of healthcare and housing.
The money pressure shows in five separate surveys:
- 48% of Gen Zs don't feel financially secure, up from 30% a year earlier (Deloitte, May 2025).
- 55%, more than half, have delayed a major life decision, such as starting a family or a business, for financial reasons (Deloitte, May 2026).
- 69%, more than two thirds, say housing availability or affordability directly affects their career decisions (Deloitte, May 2026).
- 56% lived paycheck to paycheck, up 5 points (Deloitte, May 2024).
- 55% of Gen Z adults lack emergency savings to cover three months of expenses (Bank of America, July 2025).

Want a money-pressure chart like this for your own market? Send the country and the survey years.
Email a briefBank of America's 2025 Better Money Habits study, which surveyed 915 Gen Z young adults aged 18 to 28 in April 2025, found 51% call the high cost of living a barrier to financial success. Gen Zers are trying to make ends meet by cutting back: 72% took steps to improve their finances over the prior year, 64%, almost two thirds, cut expenses and 41% reduced dining out.
Poverty sits behind those averages, and housing costs are putting pressure on the same households and their consumer spending. KIDS COUNT reported 16% of Gen Z lived in poverty in 2023, over 10.5 million people, and 35% lived in low-income families, about 22.8 million.
Gen Alpha's poverty rate matched Gen Z's in 2022 and 2023, covering about 6.8 million children. Bank of America found 35% of Gen Z adults say monthly spending ran higher than they expected once they began supporting themselves, rising to 43% for ages 23 to 28.
Expectations for the near future still lean up. Deloitte's 2026 release found 53% of Gen Zs expect their personal finances to improve within the next year, and Gallup found 77% agree they have a great future ahead.
Gen Z workers: job hunting, career preferences and the workforce
Generation Z was set to pass baby boomers in the U.S. full-time workforce in early 2024, on a projection Glassdoor Economic Research published in November 2023 and BNN Bloomberg reported. Glassdoor expects Millennials to stay the largest group of workers until Gen Z overtakes them in the early 2040s.
How many Gen Zers are in the workforce now
Fewer Gen Z young adults ages 20 to 24 are working than Millennials did at the same age, and the ones who do earn more. Zety's Early-Career Labor Market Report, published September 2026 from Bureau of Labor Statistics Current Population Survey data, compared Gen Z in 2021 to 2024 with Millennials in 2005 to 2008:
- Labor force participation averaged 71.1% for Gen Z, against 74.5% for Millennials.
- The employment-population ratio was 65.8%, against 67.9%.
- Unemployment averaged 7.5%, against 8.9%.
- Full-time median weekly earnings, inflation-adjusted, were $756.25, against $673.50, a 12.3% gap in Gen Z's favor.
That answers the hardest-working question with numbers: a smaller share of Gen Z in their early twenties is in the labor force, and those in full-time jobs are paid more in real terms. College students explain part of the participation gap, since just under 50% of the 18 to 24 age group were enrolled in or had completed higher education in recent KIDS COUNT data, against 36% in 2000. Pew counted 57% of 18 to 21 year olds out of high school as college students in 2018.
The pipeline into that workforce is fuller than it was for Millennials. The U.S. high school graduation rate hit a record 87% in 2022, and the share of 16 to 19 year olds out of school without a diploma fell to 4%, against 11% for Millennials in 2000, in KIDS COUNT data.
Job hunting behaviors and employer expectations
The entry-level market is tight and Generation Z knows it. Handshake's April 2026 Class of 2026 report found senior pessimism about careers rose from 46% to 62% in two years. Job postings on its network were 2% lower than a year earlier and 12% below pre-pandemic levels.
Hiring is still growing, slowly. NACE's April 2026 Job Outlook update found employers expect to hire 5.6% more graduates from the class of 2026, from a survey of 185 employers.
AI has entered job hunting fast. Handshake found 85% of the class of 2026 use AI and over a third use it daily, against almost half of the class of 2024 who had never used it. Deloitte's 2026 survey reported 74% of Gen Zs and Millennials use AI in their day-to-day work, up from 57% of Gen Zs a year earlier.
In 2025, 74% of Gen Zs expected GenAI to change how they work in the near future, and 29% used it all or most of the time. The AI adoption statistics report covers usage at the company level.
How Gen Zs view employers and what Gen Z workers want from them, per Deloitte:
- 44% prefer steady progress over rapid promotion, against 25% who want fast promotion (2026).
- 50% want managers to teach and mentor them, and 36% say it happens (2025).
- 89% call a sense of purpose important to job satisfaction (2025), though Gen Zs view purpose differently: some mean societal impact, others pay or work/life balance.
- About one quarter of respondents doubt that higher education prepares them for the job market (2025).
- Good work/life balance is among the top three reasons Gen Zs chose their employer (2025).
- 20% say their organization is scaling back entry-level roles (2026).
Climate plays into job choices for a minority. Deloitte's 2024 survey found 20% of Gen Zs had changed jobs or industries over environmental concerns, with roughly 25% more planning to, and 62% felt anxious about climate change in the prior month. Employee engagement benchmarks for the whole workforce are in the employee engagement statistics.
Gen Z politics, activism and voting
Almost 50 million Gen Zers will be eligible to vote in 2026, up from about 40.8 million in 2024, according to Tufts CIRCLE. Fewer Gen Zs partake in elections than are eligible: more than 21 million eligible Gen Zers didn't cast a ballot in 2024, and nearly half of young people in CIRCLE's 2026 survey were unsure their vote matters or believed it doesn't.
Party lines are loose. PRRI's 2023 data put Generation Z adults at 31% Democrat, 30% independent and 23% Republican, with 36% calling themselves liberal and 27% conservative. CIRCLE's 2026 survey found 43% of young people aged 18 to 29 have no party affiliation, and 62% think the country is headed in the wrong direction. PRRI found 32% of Gen Z adults would vote only for a candidate who shares their views on climate change.
Gen Zs partake in activism beyond voting. In CIRCLE's 2026 survey, 88% said they'd talk with friends and family about issues they care about, 78% would sign petitions and 57% would protest or boycott. Pew's 2020 profile, using 2018 survey data, found seven in ten Gen Zers said government should do more to solve problems.
Gen Z compared with other generations
The table sets Generation Z against older generations on measures where the same publisher reports both, a cleaner comparison than mixing a Gen Z report with a separate study of Millennials. Data vintage varies from 2023 to 2026, and most of these series update once a year.
| Measure | Gen Z | Comparison | Publisher, year |
|---|---|---|---|
| U.S. population | Nearly 70 million | Millennials 72.7 million | KIDS COUNT, 2023 |
| Non-Hispanic white share | 50% | Millennials 54%, Gen X 59%, Boomers 71% | KIDS COUNT, 2023 |
| LGBTQ identification, adults | 24% | Millennials 15%, Gen X 6%, Boomers 4% | PRRI, 2023 |
| Global consumer spending, 2025 | Gen X outspent Gen Z by 40% | Gen X stays highest until 2033 | World Data Lab, 2025 |
| Labor force participation, ages 20 to 24 | 71.1% | Millennials 74.5% at the same age | Zety from BLS CPS, 2026 |
| Full-time median weekly pay, ages 20 to 24 | $756.25 | Millennials $673.50 | Zety from BLS CPS, 2026 |
| Mental health condition, past two years | About 65% | About 35% of other generations | Oliver Wyman Forum |
| Teen Facebook use | 32% | 71% of teens in 2014 to 2015 | Pew, 2024 |
- The market, age band or category to cover
- Regions, years and segments
- Where it runs: blog, white-label, gated or lead magnet
- Whose byline goes on it
- Deadline
- 2,500+ words, human-written
- Every figure linked to its source
- Yours to publish, under your name or none
- Hosting here for +$200, with your sponsored links
Generation Z outpaces prior generations on per-capita spending and real starting pay, and trails them on labor force participation and well-being. Gen Alpha, whose oldest members turn 13 in 2026, is too young for most of these series, though generation alpha already shows up in the KIDS COUNT diversity data at 48% white.
Why the published Gen Z statistics disagree
Three things push two honest Gen Z figures apart, and the first is the birth-year range. Deloitte's cohort runs from 1995, Pew's from 1997, so a Deloitte "Gen Z" percentage includes 29 to 31 year olds that Pew files as Millennials. Bank of America sampled 18 to 28 year olds, Gallup 13 to 28 and Pew's teen work 13 to 17.
Geography is the second. Deloitte surveys 44 countries, Oliver Wyman the US and UK, and Pew, Gallup, PwC and Bank of America the United States. The 48% financial-insecurity rate is a global figure and the 51% cost-of-living barrier is an American one.
Question wording is the third, and mental health is the clearest case:
- CDC: 40% of high school students persistently sad or hopeless in 2023.
- Census Bureau via KIDS COUNT: 33% of 18 to 24 year olds down or hopeless on most days in fall 2022.
- Deloitte: 40% of Gen Zs stressed all or most of the time in 2024, down from 46%.
- Oliver Wyman: about 65% with at least one condition over two years.
The consumer spending forecasts split along the same lines. World Data Lab's $2.7 trillion is new spending added by 2030, NIQ's $9 trillion+ is added by 2034, and $12 trillion is the 2030 total. Secondary pages quote all three as Gen Z spending without the year, which is how a single model turns into three headlines.
How to use Gen Z statistics: a step-by-step guide for marketers and recruiters
Set the objective before pulling a number. A brand sizing a launch needs consumer spending, Gen Z shopping habits and channel data; a recruiter needs labor force and expectations data, and the two rarely come from the same survey.
Step 1: Benchmark against younger generations and older ones
Compare Generation Z with Millennials at the same age, using one publisher for both sides. The Zety comparison of ages 20 to 24 and World Data Lab's age-25 spending benchmark both do this. Flag categories where Gen Z diverges, such as Facebook use at 32% of teens against 71% a decade earlier. The demographic market segmentation guide covers how to set the age cut.
Step 2: Run social, product and merchandising tests
Design discovery tests on the channels Generation Z uses: TikTok, Instagram and YouTube for reach, stores for the 37% planning more in-store trips. Size each segment first with audience segmentation tools. Limited drops and dupes work because 82% of Gen Z shoppers planned to buy cheaper alternatives. Track shopping trends and social-to-shelf latency with social listening tools.
Step 3: Measure hiring, retention and brand signals
Track time-to-hire and candidate drop-off against the 62% senior pessimism Handshake recorded. Run pulse surveys on purpose and well-being, since 89% of Gen Zs call purpose important, and maintain loyalty by delivering the mentoring 50% ask for. A user persona template keeps those findings in one document.
Common mistakes when reading Gen Z statistics
Treating Generation Z as one group is the first mistake, and Gen Z shopping habits show why. A 14-year-old on a $2,213 annual budget and a 29-year-old renting in a major city share a label and almost nothing else, and Gallup's 2025 data split students at 56% thriving from young adults at 39%.
In Gallup's 2025 data, 56% of Gen Z students were thriving, against 39% of Gen Z young adults.
Gen Z students rated as thriving in 2025
Source: Gallupe.g. well-being of Gen Z workers in your country
Source: linked, checked, datedPlatform use isn't purchase intent. YouTube reaches 90% of teens, yet NIQ found almost half of Gen Z dollars still go through physical stores, so reach figures overstate the share of Gen Z spending that starts on social media.
Price is one driver of several. 59% of Gen Z prefer known brands in PwC's data, and 64% will pay more for sustainable products in Deloitte's. A discount strategy built on the 82% dupe figure alone misses both groups of Gen Z consumers.
Quoting a figure without its year is the last trap. The 18.8% suicide-consideration rate and the 41 million voter count both circulate on aggregator pages after newer readings replaced them: the CDC's 2023 figure is 20%, and CIRCLE now puts eligible Gen Z voters near 50 million.
Worked example: applying the Spend Z figures to a launch
A worked example shows the arithmetic, using only the published figures on Gen Z spending above. A beverage brand planning a U.S. Gen Z launch starts with the Spend Z category signal that alcohol and beverages lead demand growth, then narrows to the nearly 70 million American Gen Zers.
Next comes the city list. World Data Lab's model covers 9,400+ cities, and KIDS COUNT shows California and Texas hold about 15 million Gen Zers between them, so those two states are the first test markets.
The timeline follows the channel data. Social media drives discovery for Gen Z per McKinsey, while 37% of Gen Z shoppers plan more store visits per PwC, so a social campaign has to land before the product reaches shelves. Conversion targets then sit against the 53% who have used buy buttons on social media networks, and inventory plans against the 13% drop in Gen Z consumer spending PwC measured in early 2025.
Delivered for your site and your byline. Hosting here is optional.
Frequently asked questions
How many Gen Zers are there?
How many Gen Zers exist depends on the map. World Data Lab counts 2 billion worldwide, 25% of the global population, with two thirds of them in Asia and Africa, and KIDS COUNT counted nearly 70 million in the United States in 2023, about 21% of Americans.
What are some key facts about Generation Z?
Members of Generation Z were born from 1997 to 2012 by Pew's definition, and Gen Z's spending power is projected at $12 trillion by 2030. They're the most diverse adult generation in the U.S. at 50% non-Hispanic white, 46% of teens are online almost constantly, and nearly half of Gen Zs globally, 48%, don't feel financially secure.
What are the 7 basic traits of Gen Z?
No survey lists seven official traits, but the data point to seven measurable patterns: racial diversity, constant connectivity, social-first shopping, price sensitivity, purpose at work, high reported anxiety and loose party ties. Each one maps to a figure in this report.
What does Gen Z spend most of their money on?
Gen Z spending is easiest to see in what it gives up. PwC's survey shows where discretionary money goes by asking what Gen Z would cut first: restaurants and takeout at 51%, clothing at 33% and alcohol at 29%. For teens, Piper Sandler tracks a $2,213 annual budget, with Chick-fil-A, Nike and e.l.f. as the top brands in food, apparel and cosmetics.
What are the top 3 categories that Gen Z spends its money on?
By growth in Gen Z spending, the Spend Z global report names health and wellness, alcohol and beverages, and beauty, with food close behind. By current outlay, restaurants, clothing and alcohol are the three categories Gen Z consumers named in PwC's survey. Gen Z shopping habits in those categories lean toward dupes and discounts.
What percentage of Gen Z is struggling financially?
Deloitte's 2025 survey found 48% of Gen Zs don't feel financially secure, and its 2024 survey put 56% living paycheck to paycheck. Bank of America found 55% of U.S. Gen Z adults lack three months of emergency savings.
Is Gen Z statistically the hardest working generation?
The labor data don't support a hardest-working title. Generation Z young adults ages 20 to 24 had 71.1% labor force participation against 74.5% for Millennials at the same age, though full-time Gen Z workers earned 12.3% more in real terms.
Is Gen Z mostly Democrat or Republican?
Neither holds a majority. PRRI counted 31% of Generation Z adults as Democrats, 30% as independents and 23% as Republicans in 2023, and CIRCLE found 43% of 18 to 29 year olds unaffiliated in 2026.
Is Gen Z more conservative or liberal?
More liberal by self-label. PRRI found 36% of Gen Z adults call themselves liberal, 34% moderate and 27% conservative.
Which generation has the highest IQ?
No U.S. statistical agency publishes IQ scores by generation. The closest national series, eighth-grade math proficiency, fell from 34% in 2011 to 26% in 2022 in KIDS COUNT data, a drop that covers Gen Z and pandemic-era schooling.
What are some common issues faced by Gen Z today?
Cost of living leads, named by 65% of young people in CIRCLE's 2026 survey. Mental health follows, with 40% of high school students persistently sad or hopeless in 2023, then housing, which shapes career decisions for 69% of Gen Zs in Deloitte's 2026 data.
Where can I access the Spend Z global report?
World Data Lab offers a free preview on its Spend Z page, covering consumer spending by country and category for Gen Z consumers, and the full report comes from NIQ and World Data Lab as a paid product. The June 2024 NIQ release summarizes the headline figures.
Bottom line
Generation Z is the largest generation worldwide at 2 billion people, two thirds of it in Asia and Africa, and the most diverse in American adulthood. Gen Z's spending power is heading for $12 trillion by 2030. The same cohort reports the money and well-being strain in this report: 48% financially insecure and 45% thriving.
The figures that hold up are the ones with a publisher, a year and a birth-year range attached. A brand team should start with the Spend Z and PwC numbers on Gen Z spending, a recruiter with Deloitte, Handshake and the BLS-based comparison, and both should re-check every figure against the next annual release. The trend research tools ranking covers software for tracking those shifts between releases.
Consumer brands, agencies and employers publish reports like this one as lead magnets and pitch material.
A report on your topic for a blog page, gated content or a lead magnet.
Written for your client and published under their brand, with my name left off.
Your report on marketintelligencetools.com, with 2 to 3 CTAs carrying your sponsored links.
Default terms: the report is yours to publish, and I keep the right to republish it on this site behind a gate, outside Google's index.
Who published each Gen Z figure, when, and what nobody counts
Population and diversity figures are the Annie E. Casey Foundation's KIDS COUNT tables for 2023, with birth-year cutoffs from Pew Research Center's January 2019 note. Global headcount and spending come from the Spend Z release NIQ and World Data Lab published in June 2024, plus the Spend Z preview page. Spending behavior is PwC's October 2025 Gen Z paradox analysis, Piper Sandler's Fall 2025 teen survey and McKinsey's July 2026 State of the Consumer chart.
Social media figures are Pew's December 2024 teen survey and its July 2025 short read, plus Gallup's 2023 adolescent survey.
Mental health is the CDC Youth Risk Behavior Survey report of August 2024, the Oliver Wyman Forum survey, and Mental Health America's 2024 report as summarized by the Annie E. Casey Foundation. Money and work figures are Deloitte's Gen Z and Millennial Surveys of May 2024, 2025 and 2026, Bank of America's July 2025 Better Money Habits study and Gallup and the Walton Family Foundation's August 2025 release.
Labor data are Zety's September 2026 report built on BLS Current Population Survey data, Glassdoor's November 2023 projection as reported by BNN Bloomberg, Handshake's April 2026 Class of 2026 report and NACE's April 2026 Job Outlook update.
Politics is PRRI's 2023 American Values Atlas and Tufts CIRCLE's April 2026 research. Every figure was checked in October 2026. No U.S. statistical agency publishes IQ by generation, and the Spend Z preview names no single country with the highest Gen Z spending growth.