Online learning statistics for 2026: 10.76 million US college students study online
 By Jan Suski. I go deep on every review, checking every number against its source and digging up details other coverage misses, a habit from six years of SEO and link building for tech companies. Bylines at Surfer, Brand24, and Senuto. How the scoring works.
The numbers US and EU online learning, checked 14 October 2026
The distance education share of US higher education enrollment settled at 54.1% to 54.7% after the 74.0% pandemic peak, 17.7 percentage points above fall 2019.
Virtual public schools enroll 1.15% of US public school students, so K-12 online education is a niche that nearly tripled in nine years.
Completion splits by who pays: 3.13% of all edX participants finished in 2017-18, against 46% of the verified learners who paid for a certificate.
Edtech vendors and universities quote enrollment and completion numbers in every deck. Send the audience and I'll source a version you own.
Fall 2024 put 10,761,754 students at US postsecondary institutions into at least one distance education course, 54.7% of the 19,659,633 enrolled, according to the National Center for Education Statistics' 2025 Digest of Education Statistics, Table 311.15. That share has held between 54.1% and 54.7% for three straight fall terms, against 37.0% in fall 2019.
This report collects online learning figures from the bodies that produced them: the U.S. Department of Education's NCES tables for universities and K-12 virtual schools, NAEP, Eurostat, the Babson Survey Research Group, filings from Coursera, Duolingo, Stride & 2U, and peer-reviewed studies of how well students learn online. One section lines up the market-size estimates the research houses publish, which sit $217 billion apart for 2025.
It's written for university administrators, educators, school district planners, education technology product teams and investors who need a number they can trace to a federal dataset or an SEC filing. The money is real on both sides: Coursera guided to $1.220 billion to $1.245 billion of 2026 revenue, and 2U, the company behind edX, filed for Chapter 11 in July 2024.
Distance learning in US higher education: 54.7% of students in fall 2024
The National Center for Education Statistics, the statistics arm of the U.S. Department of Education, counted 19,659,633 students at US postsecondary institutions in fall 2024. Of those, 10,761,754 took at least one distance education course: 5,214,325 studied exclusively online and 5,547,429 mixed online and campus classes, per Digest Table 311.15, which tracks distance education participation.
Undergraduate students make up most of that headcount. 8,951,854 of 16,385,717 undergraduate students, or 54.6%, were enrolled in at least one online course, and 3,888,681 (23.7%) took every course online. Postbaccalaureate students lean further online: 55.3% took a distance course and 40.5% took nothing else.

Copy these lines into an email, fill them in and send. I reply with scope and a price within 2 to 3 business days.
Open the emailThe pandemic year is the outlier in the series. Students in at least one distance education course, by fall term:
- Fall 2019: 7,254,455, or 37.0% (Digest 2021)
- Fall 2020: 14,056,994, or 74.0%
- Fall 2021: 11,188,134, or 60.0% (Digest 2023)
- Fall 2022: 10,077,192, or 54.2%
- Fall 2023: 10,307,173, or 54.1% (Digest 2024)
- Fall 2024: 10,761,754, or 54.7%
Undergraduate students followed the same arc. NCES Fast Facts on distance learning, a Department of Education summary, puts the percentage of students with at least one online course at 36% of undergraduates in fall 2019, 75% in fall 2020 and 61% in fall 2021, when 9.4 million undergraduate students were enrolled in distance learning.
The spring 2020 switch reached almost everyone. In the 2019-20 National Postsecondary Student Aid Study, 84% of undergraduates said some or all of their classes moved online-only in spring 2020.
Over the past decade the count has grown by about 4.4 million. The Babson Survey Research Group's Grade Increase report (2018) put fall 2016 at 6,359,121 students enrolled in at least one distance course, 31.6% of enrollment, after 5.6% growth from fall 2015. Fall 2024's total is 69.2% higher, and the past three fall terms look close to set in stone at 54.2%, 54.1% and 54.7%.
Who studies fully online: sector, location and graduate share
Fully online study concentrates in graduate programs and for-profit universities. Table 311.15 breaks fall 2024 distance education participation out by level and control of institution:
| Group | Students enrolled | Exclusively online | Some online | Any online |
|---|---|---|---|---|
| Public institutions | 14,327,975 | 23.0% | 32.2% | 55.2% |
| Private nonprofit institutions | 4,260,971 | 28.7% | 17.5% | 46.2% |
| Private for-profit institutions | 1,070,687 | 64.4% | 17.4% | 81.9% |
| Undergraduate | 16,385,717 | 23.7% | 30.9% | 54.6% |
| Postbaccalaureate | 3,273,916 | 40.5% | 14.8% | 55.3% |
| All students | 19,659,633 | 26.5% | 28.2% | 54.7% |
For-profit institutions run the most online programs. 81.9% of their 1,070,687 students took at least one distance course in fall 2024 and 64.4% took only distance courses. Among for-profit postbaccalaureate students the percentage of students fully online reached 88% in fall 2021, per NCES Fast Facts, against 36% at public institutions.
Most fully online undergraduate students stay close to home. The Digest sorts students by location of student: of 3,888,681 exclusively online undergraduates in fall 2024, 2,638,172 (67.8%) studied at an institution in their own state and 1,128,268 crossed a state line. The in-state share was 74% in fall 2021.
Graduate students flip the pattern. 653,688 fully online postbaccalaureate students studied out of state in fall 2024, against 614,789 in state, so graduate programs compete nationally for the same online student regardless of location.
Enrollment is concentrated by institution as well. Babson's 2018 report found the top 5% of institutions, 235 schools, enrolled 46.9% of all distance students in fall 2016, and public institutions held the lion's share at 68.9%.
K-12 online learning: virtual schools, remote learning and student access
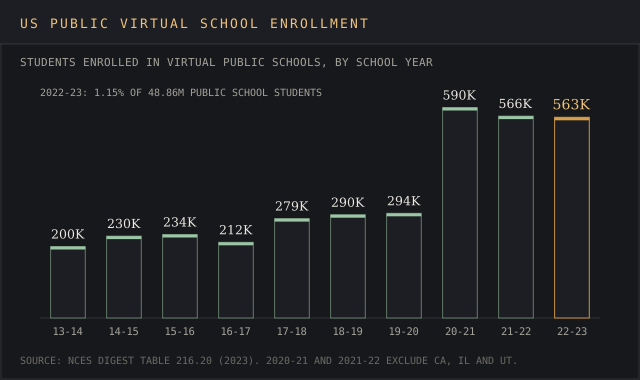
Virtual public schools, which teach students fully online, are a small slice of K-12 education with a steep growth line. The Department of Education's Digest of Education Statistics Table 216.20 counts 562,659 students enrolled in virtual public schools in 2022-23, 1.15% of 48,860,517 public school students, a drop in the bucket next to the 54.7% college figure. The series starts in 2013-14 at 200,343, and the past nine school years nearly tripled it.
Want a virtual school chart like this for your state or district? Send the place and the years.
Email a briefDemand held after reopening. Enrollment doubled in one year, from 293,689 in 2019-20 to 590,267 in 2020-21, and gave back 27,608 students over the next two years. The two pandemic years exclude California, Illinois and Utah, so the national count for those years runs low.
Table 216.20 ends at 2022-23. A Chalkbeat data analysis of newer Department of Education data, published August 27, 2026, puts fully virtual public school enrollment at just over 600,000 in 2024-25, about 1 in 80 public school students, plus 195,000 in primarily online schools with some in-person time. High school students attend fully virtual schools at twice the percentage of younger children: 1.6% against 0.8% in grades 1 to 8.
Outcomes trail the growth. The National Education Policy Center's Virtual Schools in the U.S. 2021 counted 477 full-time virtual schools enrolling 332,379 students in 2019-20 and reported a graduation rate of 54.6% for them, against a national average of 85%. A 30.4-percentage-point gap is a red flag for any district planning a fully online learning environment.
Ratings vary by operator. 37.2% of virtual schools run by for-profit education management organizations earned an acceptable state rating, against 50.7% of district-operated virtual schools and 64.3% of those run by nonprofit operators. The for-profit schools averaged 1,384 students each, more than 3.5 times the size of other virtual schools.
Stride, the education technology operator behind K12-branded virtual schools, averaged 243,900 enrollments in fiscal 2026, up 4.2% from 234,000, on revenue of $2,518.1 million, per its August 4, 2026 results. Career Learning enrollments grew 13.9% to 109,700.
The 2020-21 remote year left a measurable mark on younger students. About 70% of 9-year-olds in NAEP's 2022 long-term trend assessment, which NCES runs for the Department of Education, recalled learning remotely that year, and age-9 average scores fell 5 points in reading and 7 points in mathematics against 2020. It was the first score decline in mathematics in the assessment's history.
NAEP's questionnaire data adds insights on home study conditions. Higher-performing students were more likely to have a desktop, laptop or tablet all the time, a quiet place to work and teachers available for support every day or almost every day, and they reported more confidence recognizing gaps in their understanding and finding online resources. NAEP notes these comparisons don't establish cause and effect.
Teenagers want the classroom back. In Pew Research Center's April-May 2022 survey of 1,316 teens, 65% wanted school completely in person after the pandemic, 18% wanted a mix and 9% wanted it completely online. 30% said they feel less close to their teachers than before the pandemic.
The homework gap follows income. 24% of teens in households earning under $30,000 said they at least sometimes can't complete homework for lack of a reliable computer or internet connection, against 14% at $30,000 to $74,999 and 8% at $75,000 or more.
How effective is online learning: what controlled studies measured
The largest federal review favors blended courses. SRI International's 2010 meta-analysis for the U.S. Department of Education screened more than a thousand empirical studies from 1996 to July 2008 and used 50 independent effects to create pooled estimates. Mean effect sizes against face-to-face instruction:
- Blended learning, 23 contrasts: +0.35, p < .001
- Purely online learning, 27 contrasts: +0.05, p = .46, statistically equivalent
- All online and blended conditions, 50 contrasts: +0.20, p < .001
The authors flagged a confound. Blended conditions often added learning time and instructional elements the control groups never received, so they attributed the blended advantage to that extra time and content. On fully online courses the jury's still out: +0.05 is statistically indistinguishable from zero.
Newer randomized trials test AI tools in instruction. A crossover trial in a Harvard University introductory physics course in fall 2023, by Greg Kestin, Kelly Miller and three co-authors and published in Scientific Reports on June 3, 2025, put an AI tutor used at home against an in-class active learning environment. Median post-test scores reached 4.5 with the tutor against 3.5 in class, from a 2.75 pre-test baseline.
The AI group's median time on task was 49 minutes, against an assumed 60 minutes in class. Students rated engagement at 4.1 with the tutor and 3.6 in class on a five-point scale, and the authors put the gain in understanding at 0.73 to 1.3 standard deviations. The tutor delivered personalized learning on the same content the classroom learning environment covered.
The World Bank's Edo State evaluation in Nigeria, a case study in after-school AI tutoring, ran a six-week program built on generative AI tools in June and July 2024. Students randomly assigned to it gained about 0.3 standard deviations, which the researchers equate to nearly two years of typical learning, and the program outperformed 80% of interventions in a database of developing-world randomized trials.
MOOC completion rates and online course platform scale
Massive open online courses enroll millions and finish few. Justin Reich and José Ruipérez-Valiente's 2019 paper in Science, built on 5.63 million learners and 12.67 million course registrations in edX courses from MIT and Harvard University between 2012 and 2018, found a 3.13% completion rate among all participants in 2017-18, down from nearly 6% in 2014-15.
Paying changes the math. Verified learners, who paid for a certificate, completed at 46% in 2017-18 and 56% in 2016-17. Return visits collapsed: the share of first-time MOOC learners who enrolled again the next year fell from 38% in 2012-13 to 7% in 2016-17. Free registrations are a dime a dozen, and 96.87% of the 2017-18 participants never reached the end.
Class Central, which tracks MOOC providers, counted 220 million learners enrolled outside China by the end of 2021, 40 million of them new that year, across a course library of 19,400 courses from about 950 universities.
The public online education and education technology companies that sell courses report scale in filings and investor presentations:
- Coursera: more than 300 million registered learners and a library of 335,000+ courses after its all-stock combination with Udemy, whose marketplace lets instructors with subject expertise create, teach and sell courses, closed on May 11, 2026; Q2 2026 revenue of $298.6 million, up 60% (earnings release, shareholder letter)
- Duolingo: 58.7 million daily active users (up 23%), 140.6 million monthly active users and 12.7 million paid subscribers in Q2 2026, on revenue of $298.5 million, up 18% (shareholder letter)
- 2U (edX): filed prepackaged Chapter 11 cases on July 25, 2024, cutting debt by more than 50% to about $459 million; edX said it connected more than 86 million people with 260 partners, which include universities, institutions and industry experts (8-K exhibit)
Coursera and Duolingo bring home the bacon at nearly identical quarterly revenue, $298.6 million and $298.5 million. University partnerships are the slow line inside Coursera's numbers. Degrees revenue fell to $13.4 million in Q2 2026 from $15.7 million a year earlier, while the Enterprise segment grew 118% to $140.0 million on the Udemy combination. 2U's restructuring sent edX's owner back to square one with less than half its former debt.
Online learning in Europe: Eurostat's 2024 survey
Eurostat's household survey data found 33% of EU internet users did an online course or used online learning material in the three months before the 2024 survey, up 3 percentage points from 30% in 2023. The spread between member states runs sixfold:
- Ireland: 61%
- Netherlands: 59%
- Finland: 53%
- Bulgaria: 17%
- Cyprus: 11%
- Romania: 10%
Personalized learning and AI tools in online classes
Students jumped on the bandwagon before their schools wrote rules. The College Board found 84% of US high school students using generative AI tools for schoolwork in May 2025, up 5 percentage points from 79% in January 2025, in surveys of students, parents and educators. Roughly 2 in 5 schools or districts don't allow student use, about 1 in 5 allow it without a policy, and 12% leave the decision to each department or grade level.
Schools gate the AI tools on their networks too. 55% of principals said their schools haven't blocked students or teachers from generative AI tools, and 45% reported at least some restrictions. Principals and teachers named academic integrity and teacher support needs among their concerns.
Teachers are moving slower than students. A Gallup-Walton Family Foundation poll published June 25, 2025 found 32% of teachers using AI tools at least weekly, 28% of teachers using them infrequently and 40% not at all. Teachers who use AI weekly reported saving 5.9 hours a week, which the foundation equates to six weeks across a school year. 19% of teachers said their school had an AI policy.
College faculty sit at a similar level. Tyton Partners' Time for Class 2025, subtitled Empowering Educators, Engaging Students and published June 11, 2025 from a survey of over 3,300 students, instructors and administrators across more than 900 US colleges and universities, found weekly use of generative AI tools among 42% of students and 30% of instructors, a university faculty sample separate from the K-12 teachers in the Gallup poll.
Instructors also want the room back. Faculty preference to teach in person rose 9 percentage points to 64%, from 55% in 2023.
Personalized learning is the use case the OECD puts first. Its Digital Education Outlook 2026, published January 19, 2026, explores generative AI in three settings: students learning subject knowledge with AI tools, students and teachers using AI together during instruction, and teachers using it alone to plan and support classroom work.
Enrollment counts show growing demand for AI course content. Coursera reported more than 45 enrollments per minute in generative AI courses in 2026, up from 25 per minute in 2025, across nearly 10,000 GenAI courses. Grand View Research sizes the AI in education market at $8.3 billion in 2025, with a projected future value of $57.2 billion by 2033 at a 25.9% CAGR, and North America held 37.5% of 2025 revenue.
Key factors behind online enrollment: what online college students report
Career goals drive the decision. EducationDynamics' Online College Students Report 2024 surveyed 3,011 online students (1,508 undergraduate, 1,503 graduate) in November and December 2023. 98% enrolled for a career-focused reason, and 42% plan to start a new career that earns more money.
Cost tops the list, par for the course in adult education. The key factors in the same report:
- Cost of tuition and fees: the top enrollment factor, cited by 49%
- Affordability: the top reason to consider an institution, 62%
- Programs matching career goals: 33%
- Location of the online programs: 63% would consider only schools within one hour's drive, and about 5% would look more than two hours away
- Price: 40% enrolled at the least expensive school they evaluated
The satisfaction insights are mixed. 61% of respondents preferred online higher education and 35% preferred classroom learning. Nearly 40% would recommend online study and about 24% were detractors. About 33% of program completers strongly agreed their degree or certificate was worth the tuition they paid.
Challenges of distance learning: motivation, distractions and access
Not all students adapted when classes moved online in spring 2020. The SERU Consortium's survey of 22,519 undergraduates and 7,690 graduate and professional students at five public research universities found 96% of undergraduate students and 88% of graduate students hit at least one obstacle, with lack of motivation the biggest challenge for every group of university students.
The obstacles it counted:
- Lack of motivation: 76% of undergraduates and 56% of graduate and professional students
- Distracting home environment or no suitable study space: 66% of low-income undergraduates, against 50% of upper-middle-class and wealthy undergraduates
- Lack of technology access: nearly one-third of low-income undergraduates, against 11% of wealthier peers
- Time management: low-income graduate students were twice as likely as wealthy peers to be unable to attend classes at the scheduled times
Home connectivity sets the floor for K-12. The Department of Education's Condition of Education reports 97% of 3- to 18-year-olds had home internet access in 2021, 93% through a computer and 4% only through a smartphone. 98% of children in the highest-income quarter had a computer connection at home, against 85% in the lowest.
Logging in from home is easier said than done for the 3% of children without a connection. Among those households in November 2021, 48% said they didn't need one and 24% said it cost too much; for families earning under $40,000 the cost answer rose to 29% to 47%.
Online learning market size: why the published estimates diverge
Research houses publish education technology and online learning market statistics for the same year that differ by a factor of two, because each sizes a different thing, and their forecasts of the future market diverge further. Five current estimates:

- The learner group, market or course type to cover
- Regions, years and segments
- Where it runs: blog, white-label, gated or lead magnet
- Whose byline goes on it
- Deadline
- 2,500+ words, human-written
- Every figure linked to its source
- Yours to publish, under your name or none
- Hosting here for +$200, with your sponsored links
| House | Report and date | What it sizes | Figure | Projected |
|---|---|---|---|---|
| HolonIQ | Market note, 6 August 2020 | Global EdTech and digital spending in education | $404B in 2025 (forecast) | 16.3% CAGR, 2019-2025 |
| Arizton | Global E-Learning Market Research Report 2026-2031, January 2026 | E-learning | $325B in 2025 | $665B by 2031 |
| Statista Market Insights | Online Education outlook, worldwide | Online education revenue | $280.99B in 2026 | $321.31B by 2031, 2.72% CAGR |
| Grand View Research | Education Technology Market Report, 2026-2033 | Education technology | $187.0B in 2025 | $437.5B by 2033, 10.8% CAGR |
| Grand View Research | AI in Education Market Report, May 2026 | AI in education | $8.3B in 2025 | $57.2B by 2033, 25.9% CAGR |
The devil's in the details of each scope note. Three things move the numbers:
- Scope: For example, HolonIQ counts all technology and digital spending by education systems, which it put at 5.5% of a $7.3 trillion global education market in 2025. Statista counts online education revenue. Grand View's AI line counts AI products alone, about 4.4% of its own education technology total.
- Vintage: HolonIQ's $404 billion is a projected figure published in August 2020, during emergency remote teaching.
- Revisions: Statista's outlook carried more than $185 billion for 2024 in October 2024 coverage; its current page shows $280.99 billion for 2026 and 2.72% annual growth projected to 2031, a level 2.72% a year can't reach from $185 billion in two years.
The $325 billion figure has a long tail. ReportLinker forecast an e-learning market of approximately $325 billion by 2025 at a 7.2% CAGR, in a study THE Journal covered on March 9, 2017. Arizton's January 2026 report lands on $325 billion as its measured 2025 base and projected $665 billion by 2031, so two houses nine years apart printed the same number for the same year.
ReportLinker forecast an e-learning market of approximately $325 billion by 2025 back in 2017, and Arizton's January 2026 report measured the same $325 billion as its 2025 base.
E-learning market figure printed for 2025 by two houses
Source: ReportLinker and Ariztone.g. corporate e-learning spend in your country
Source: linked, checked, datedRecycled online learning figures and their origins
Several numbers repeat across statistics roundups with no named publisher behind them. Each one is listed next to the primary figure on the same subject used in this report:
| Recycled figure | Publisher named in roundups | Primary figure on the same subject |
|---|---|---|
| E-learning grew 900% from 2000 to 2020 | None | US distance enrollment grew 69.2%, from 6,359,121 (fall 2016, Babson) to 10,761,754 (fall 2024, NCES) |
| 93% of businesses plan to adopt e-learning in 2025 | None | 33% of EU web users took an online course in 2024 (Eurostat) |
| Online learning takes 40% to 60% less time | IBM, with no IBM report cited | AI-tutored Harvard physics students: 49-minute median time on task and higher post-test scores (Kestin et al., 2025) |
| Online learning lifts retention 25% to 60% | None | Blended learning +0.35 and purely online +0.05 mean effect sizes (SRI, 2010) |
| 75% of online graduates rate it equal or better | None | 61% of online students prefer online study, 35% the classroom (EducationDynamics, 2024) |
| 96% would recommend online learning | None | Nearly 40% would recommend online study (EducationDynamics, 2024) |
| 67% cite career advancement | None | 98% enrolled for a career-focused reason (EducationDynamics, 2024) |
| 73% of US students want online classes to continue | None | 9% of teens want school completely online, 18% a mix (Pew, 2022) |
| AI tools lift engagement 80% | None | Engagement rated 4.1 with an AI tutor against 3.6 in class, on a five-point scale (Kestin et al., 2025) |
Each recycled figure misses the mark on the basics: it loses its sample, date and definition on the way through the roundups. For example, the 900% figure arrives as a bare percentage attached to a 20-year window, which is why the key-figures table above carries only figures with a named publisher and a link.
How online learning data is collected
Each source counts something different, and understanding the definitions decides what a number can prove:
- IPEDS fall enrollment data: each college and university reports a fall snapshot of students by distance education status to the National Center for Education Statistics; Digest Table 311.15 covers degree-granting institutions in the 50 states and the District of Columbia and counts students, so a learner in three online courses counts once.
- NCES Digest Table 216.20: virtual public school enrollment by school year, with California, Illinois and Utah missing for 2020-21 and 2021-22.
- NAEP: run by NCES for the Department of Education, a tested sample plus a student questionnaire, so remote-learning results are correlations.
- Eurostat: a household information and communication technology survey of web users with a three-month recall window.
- Company filings and investor presentations: Coursera reports cumulative registered learners, Duolingo reports daily and monthly active users, and Stride reports average enrollments, so the total number of learners on each platform measures a different thing.
Researchers who analyze data from these sources work with different tools and definitions. A filing is straight from the horse's mouth and still counts every sign-up since launch, while the federal tables keep one definition across years and stay accessible to anyone through the NCES website, whose free resources support custom tables. Readers who want to explore the federal series can build their own in the IPEDS Trend Generator.
Delivered for your site and your byline. Hosting here is optional.
Frequently asked questions
What are the statistics on online learning?
In fall 2024, 10,761,754 US postsecondary students (54.7%) took at least one distance education course and 5,214,325 (26.5%) studied fully online, per the Department of Education's NCES data. Virtual public schools enrolled 562,659 K-12 students in 2022-23. Eurostat counted 33% of EU web users in an online course in 2024.
How many college students are online?
10,761,754 students took at least one distance education course in fall 2024, and 5,214,325 took only distance courses, per the Department of Education's distance education participation table. Among undergraduate students the figures were 8,951,854 and 3,888,681.
What percentage of students prefer online learning?
Among online college students, 61% preferred online higher education and 35% preferred classroom learning in EducationDynamics' 2024 survey. Among US teens, 9% wanted school completely online and 18% wanted a mix in Pew's 2022 survey.
How effective is online learning?
SRI's 2010 meta-analysis for the Department of Education found a mean effect size of +0.20 for online and blended conditions over face-to-face classes, +0.35 for blended alone and +0.05 for purely online instruction, which is statistically equivalent to the classroom. The key advantages in that evidence belong to blended courses.
What is the success rate of online learning?
3.13% of all participants completed MIT and Harvard edX courses in 2017-18, against 46% of verified learners who paid for a certificate. Full-time virtual K-12 schools graduated 54.6% of students in NEPC's 2021 report, against a national average of 85%, so student success depends on the format.
What are 5 disadvantages of online learning?
- Lack of motivation, the top obstacle for 76% of undergraduates in the SERU survey
- Home distractions, cited by 66% of low-income undergraduates
- Uneven access: 85% of the lowest-income children had a computer connection at home in 2021
- Low completion in free courses: 3.13% on edX in 2017-18
- Lower graduation rates at virtual schools: 54.6% against 85%
Not all students face these equally: the SERU and NCES gaps run along family income.
Are online courses still profitable in 2026?
For the largest education technology platforms, yes. Coursera guided to $1.220 billion to $1.245 billion of 2026 revenue at an adjusted EBITDA margin of about 14%, and Duolingo guided to $1,207 million. 2U's July 2024 Chapter 11 filing shows the university-partnership model at its weakest.
Is K12 a good online school?
Stride, which runs K12-branded schools, averaged 243,900 enrollments in fiscal 2026, up 4.2%. NEPC's 2021 report groups virtual schools by operator type: 37.2% of those run by for-profit management organizations earned an acceptable state rating, against 64.3% run by nonprofit operators.
Bottom line
US college and university online learning has settled about 17.7 percentage points above where it stood before 2020, with more than half of all students in at least one distance education course and a quarter fully online. Graduate programs and for-profit institutions carry the highest online shares, and most fully online undergraduates study in their home state.
K-12 virtual schools and free MOOCs are the weak spots in the record, with graduation and completion rates far below their in-person and paid equivalents. Blended courses hold the strongest effectiveness evidence, AI tools offering personalized learning have two randomized trials behind them, and teachers and faculty are adopting those education technology tools slower than their students.
The future of these numbers depends on which series a reader trusts. Market-size figures need their scope note attached, since five houses put the same market between $187 billion and $404 billion. For anything educators or administrators have to defend in a budget meeting, the Department of Education's federal tables and company filings are the numbers to cite.
Edtech platforms, course marketplaces and university marketing teams publish reports like this one as lead magnets and research pages.
A report on your topic for a blog page, gated content or a lead magnet.
Written for your client and published under their brand, with my name left off.
Your report on marketintelligencetools.com, with 2 to 3 CTAs carrying your sponsored links.
Default terms: the report is yours to publish, and I keep the right to republish it on this site behind a gate, outside Google's index.
The federal tables, studies and filings behind each online learning figure, and the gaps in the federal series
Federal and EU data: nces.ed.gov (Digest of Education Statistics Table 311.15 in the 2021, 2023, 2024 and 2025 editions, Table 216.20 in the 2023 edition, Fast Facts on distance learning, and the Condition of Education indicator on home internet access), nationsreportcard.gov (NAEP long-term trend, 2022) and ec.europa.eu (Eurostat release, 24 January 2025).
Research and surveys: science.org (Reich and Ruipérez-Valiente, 2019), sri.com (meta-analysis for the U.S. Department of Education, 2010), nature.com (Kestin et al., Scientific Reports, 3 June 2025), blogs.worldbank.org (Edo State evaluation), escholarship.org (SERU Consortium survey), nepc.colorado.edu (Virtual Schools in the U.S. 2021), pewresearch.org (teen survey, 2 June 2022).
Surveys of students and teachers: bayviewanalytics.com (Babson Grade Increase, 2018), newsroom.collegeboard.org (6 October 2025), waltonfamilyfoundation.org (Gallup poll, 25 June 2025), tytonpartners.com (Time for Class 2025, 11 June 2025), insights.educationdynamics.com (Online College Students Report 2024), oecd.org (Digital Education Outlook 2026, 19 January 2026) and chalkbeat.org (27 August 2026).
Companies and market houses: sec.gov (Coursera, Duolingo and 2U filings), investors.stridelearning.com (fiscal 2026 results, 4 August 2026), classcentral.com (MOOC report, 2021), grandviewresearch.com (education technology and AI in education reports), holoniq.com (6 August 2020), arizton.com (January 2026), statista.com (Online Education outlook), businesstoday.lk (October 2024) and thejournal.com (9 March 2017).
Every figure was checked against its source on 14 October 2026. NCES Table 216.20 stops at 2022-23 and leaves out three states for the two pandemic years, and NEPC's 2023 virtual schools report would not load, so its figures come from the 2021 edition.