Web design statistics 2026: 59% of traffic is mobile and 95.9% of home pages fail WCAG
 By Jan Suski. I go deep on every review, checking every number against its source and digging up details other coverage misses, a habit from six years of SEO and link building for tech companies. Bylines at Surfer, Brand24, and Senuto. How the scoring works.
The numbers Mobile, responsive design, accessibility and careers, checked 7 October 2026
Mobile devices carry the lion's share of global web traffic at 58.99%, yet desktop still converts at 3.4% against roughly 2.0% on mobile web.
Accessibility slipped in 2026: average errors per home page rose 10.1% to 56.1, and low-contrast text now shows up on 83.9% of pages.
Web design careers still grow, at 5% from 2025 to 2035 against a 3% average for all occupations, while graphic design jobs shrink 2%.
Phones generated 58.99% of worldwide page views in September 2026, per Statcounter Global Stats. In February 2026, the WebAIM Million found detectable WCAG 2 failures on 95.9% of the top 1,000,000 home pages.
The median mobile home page weighed 2.6 MB in the HTTP Archive Web Almanac 2025, up 8.4% in a year.
This report collects web design stats on mobile traffic, responsive design, load speed, first impressions, conversion rates, accessibility, market size, AI tools and web design careers. Every figure links to the body that published it, and one section explains why the published numbers disagree, in one case by a factor of nearly two.
It's written for website designers, agency owners, in-house teams & anyone budgeting a website redesign. The web design statistics FAQ at the end answers the questions people search for most, from breakpoints to AI and jobs.
Mobile web design statistics: phones carry 58.99% of global web traffic
Statcounter's September 2026 split is 58.99% mobile, 39.26% desktop and 1.76% tablet, based on over 3 billion monthly page views. It measures page views, so it counts a 10-second phone visit the same as a 20-minute desktop session.
The United States runs closer to even. Statcounter's US platform data shows 49.1% mobile, 48.47% desktop and 2.42% tablet for the same month. A US business has to read its own analytics before it designs for a phone majority, because mobile devices and desktops split its website traffic almost evenly.
Adobe Analytics tracked $257.8 billion in US online spending between November 1 and December 31, 2025, up 6.8%, and 56.4% of online transactions ran through a smartphone, per Adobe's holiday shopping release of January 7, 2026.
Mobile users punish mobile sites that don't fit the screen. Google's 2012 survey of 1,088 US smartphone users, fielded by Sterling Research and SmithGeiger and published as Mobile-friendly sites turn visitors into customers, predates every phone on sale today. Its answers still read like a checklist for a mobile website:
- 74% said they're more likely to return to a mobile friendly site in the future.
- 67% said they're more likely to buy a product or service on a mobile-friendly site.
- 61% quickly move on to another site if they don't find what they want right away.
- 52% said a bad mobile experience made them less likely to engage with a company.
- 50% use a business less often, even one they like, when its site isn't mobile friendly.
- 96% had run into sites that weren't designed for mobile devices.
Each of those percentages now applies to the 58.99% of page views that arrive on mobile devices. Mobile friendly websites keep that majority of web users, and a site without mobile support hands them to the next search result.
Contentsquare's 2026 Digital Experience Benchmark, built on 99 billion sessions across 6,500+ websites, found desktop accounted for 30% of visits yet 47% of total time spent. Every point of traffic that moves to mobile phones pulls the average session down, a drop that slips under the radar when a report tracks visits alone.
Responsive web design statistics: 95.2% of mobile pages set a viewport
Responsive design is close to universal on the one signal anyone can measure at scale. The Web Almanac 2025 SEO chapter found the viewport meta tag on 95.2% of mobile pages and 93.1% of desktop pages. The tag tells a phone to render the page at device width, which every responsive layout needs before its CSS breakpoints can work. By that measure, roughly 95% of websites have implemented responsive design.
Google's position is on the record. Its Search Central documentation lists three mobile configurations (responsive design, dynamic serving and separate URLs) and states: "Google recommends Responsive Web Design because it's the easiest design pattern to implement and maintain."
The same Almanac chapter notes Google completed its move to mobile-first indexing in 2023, so the mobile version of a site now determines its search rankings. Mobile based searches and desktop searches draw on that same mobile-first index, so top ranking websites are judged on the page their mobile users get, which is why Google search statistics and responsive web design statistics get read together.
The 4.8% of mobile pages without a viewport tag are the non mobile optimized sites, roughly 1 page in 21. Phones render those non optimized sites as a shrunken desktop layout, and visitors pinch and zoom or leave.
Non responsive design still drives visitors off. GoodFirms surveyed 200+ web design companies and freelancers for its small-business web design research, updated May 29, 2026:
- 73.1% named a lack of responsiveness across devices as a reason visitors leave a site.
- 53.8% of the web designers cite a lack of responsive design across devices as a trigger for a redesign.
- 88.5% picked slow loading as the top reason a visitor leaves.
Responsive websites are the best of both worlds for a small team: one URL, one codebase and one set of templates for every screen. Mobile optimization then becomes a question of which widths to test, and Statcounter's resolution data answers it.
| Rank | Mobile resolution | Share | Desktop resolution | Share |
|---|---|---|---|---|
| 1 | 414 x 896 | 13.35% | 1920 x 1080 | 28.07% |
| 2 | 360 x 800 | 7.54% | 1536 x 864 | 10% |
| 3 | 384 x 832 | 7.1% | 1366 x 768 | 7.95% |
| 4 | 390 x 844 | 6.05% | 1280 x 720 | 4.71% |
| 5 | 393 x 873 | 4.18% | 2560 x 1440 | 3.95% |
Source: Statcounter, mobile and desktop screen resolutions worldwide, September 2026. All five top mobile widths fall between 360 and 414 CSS pixels, so a responsive website design tested at 360, 414 and 1920 pixels covers the five most common phone widths and the most common desktop screen.
Website load speed: 53% of mobile visits end after 3 seconds
Google's 2016 study The Need for Mobile Speed, covering 10,000+ mobile domains, found 53% of mobile site visits are abandoned if pages take longer than 3 seconds to load. The average mobile website took 19 seconds over 3G, per the announcement on the AMP Project blog.
Speed showed up in revenue too. Publishers whose mobile sites loaded in 5 seconds earned up to 2x the mobile ad revenue of sites loading in 19 seconds. A landing page that sits outside the 3-second window pays for clicks from potential customers who never see the offer.
Pages kept getting heavier since. The Web Almanac 2025 page weight chapter reports:
- Median mobile home page: 2.6 MB, up 8.4% from 2.4 MB in 2024.
- Median desktop home page: 2.9 MB, up 7.3% from 2.7 MB.
- 90th percentile: 8,337 KB on mobile and 9,179 KB on desktop.
- Images: 911 KB of the median mobile home page, against 632 KB of JavaScript, 122 KB of fonts and 77 KB of CSS.
- Requests: 68 on the median mobile page, including 12 images and 22 JavaScript files.
Images are about 35% of the median mobile page (911 KB of 2.6 MB), so image compression is the first lever on mobile load times. Teams that cut corners on image sizes ship pages where the hero photo is still loading when a phone visitor gives up.
Core Web Vitals show how many sites clear Google's own bar. In the Web Almanac 2025 performance chapter, 48% of mobile pages passed all three Core Web Vitals in 2025, up from 44% in 2024 and 36% in 2023. Desktop moved from 55% to 56%.
- Largest Contentful Paint (loading): good on 62% of mobile pages.
- Interaction to Next Paint (responsiveness to input): good on 77%, up from 74%.
- Cumulative Layout Shift (visual stability): good on 81%.
Website speed is the weakest of the three: 38% of mobile pages miss the LCP threshold.
Speed is the deciding factor for web designers too. 88.5% of the GoodFirms respondents picked slow loading as the top reason website visitors leave.
First impressions: 50 milliseconds and 94% of rejections tied to design
Visitors judge a page's look in about 50 milliseconds. Lindgaard, Fernandes, Dudek and Brown reported that visual-appeal ratings formed after a 50-millisecond exposure in their 2006 paper in Behaviour & Information Technology (volume 25, issue 2), and the figure has anchored web design statistics roundups ever since.
Design drives distrust. Sillence, Briggs, Fishwick and Harris watched 15 women aged 41 to 60 search for health information for their CHI 2004 paper on trust in health sites. Design factors made up 94% of the comments when participants rejected a site, against 6% for content.
That sample is small and the topic narrow (health information), yet it's the study behind the 94% design figure repeated across web design stats pages. The larger credibility study came from Stanford: researchers collected comments from 2,684 participants for Consumer WebWatch in October 2002, and the design look of a site came up in 46.1% of comments, the most frequent factor in the study.
Stanford's Guidelines for Web Credibility, drawn from three years of research with over 4,500 people, list "Design your site so it looks professional" as guideline 6. A poorly designed website loses brand image inside that first glance, before any copy gets read, and the user experience never gets a second look from that visitor.
An outdated website design costs the same trust. GoodFirms respondents named outdated design as a reason visitors leave 38.5% of the time and bad content structure 34.6%, and crowded web design topped its list of mistakes small businesses make at 84.6%. Missing calls to action followed at 38.5%, hidden navigation at 30.8% and poor typography at 26.9%.
Design shapes brand perception before content does. The 46.1% of Stanford credibility comments about the look of a site came first, and Salesforce found 80% of customers rate the experience a company provides as important as its products.
Photos, visual elements and flat design
Images earn attention when they carry information. Jakob Nielsen's eye-tracking study of photos as web content found users spent 10% more time looking at real staff portraits on FreshBooks than reading the biographies beside them, though the text took 316% more space. Generic stock photos got ignored as filler.
A picture is worth a thousand words when it shows the product or the people. On Amazon's TV category page in the same study, photos took 18% of viewing time and text took 82%, so other visual elements competed with product copy and lost.
Flat design has a measured cost. Kate Moran's 2017 eye-tracking test with 71 users found pages with weak signifiers, meaning flat buttons and links with few clickability cues, took 22% more time and drew 25% more fixations than strong-signifier versions of the same pages.
User experience suffers when buttons don't look like buttons on mobile sites or desktop, and a website's usability is the sum of hundreds of those small cues. A shadow or an underline decides if a user interaction happens on the first try.
Conversion rates: desktop converts at 3.4%, 74% above mobile web
Contentsquare's 2026 benchmark puts desktop conversion rates at 3.4%, 74% higher than mobile web, which works out to roughly 2.0% on mobile. The same dataset showed conversion rates down 5.1% year over year and engagement down 10%, per the benchmark summary.
Responsive websites earn their keep in sales too: in Google's 2012 survey, 67% of mobile users said they're more likely to buy on a mobile-friendly site. Mobile users bring most visits, so the gap between desktop and mobile conversion rates, 3.4% against about 2.0%, is the number mobile optimization work is trying to close on every mobile website.
The devil's in the details at checkout, and checkout design moves conversion rates on ecommerce websites. Baymard Institute documents an average cart abandonment rate of 70.22% across 50 studies and estimates the average large ecommerce site can gain a 35.26% increase in conversion rate through better checkout design. Its survey of reasons online shoppers abandon a checkout:
- Extra costs too high (shipping, tax, fees): 40%
- Delivery too slow: 20%
- Didn't trust the site with credit card information: 19%
- Site wanted an account: 18%
- Checkout process too long or complicated: 17%
- Website errors or crashes: 17%
Three of the six are web design problems by definition: trust, account walls and errors, each between 17% and 19%. Those are potential customers who already chose a product and left at the payment form.
Ecommerce sales keep gaining share of retail. The US Census Bureau estimated Q2 2026 e-commerce at $340.2 billion, 17.1% of total retail sales and up 12.2% from Q2 2025. Online sales and online shopping now account for about one retail dollar in six in a digital world where online shoppers on phones placed 56.4% of holiday transactions, which is why Shopify statistics and conversion benchmarks get read by the same teams running ecommerce sites.
Design maturity shows up in revenue. McKinsey tracked 300 listed companies over five years for The business value of design (October 2018), logging 100,000+ design actions. Top-quartile scorers on its Design Index posted 32 percentage points higher revenue growth and 56 points higher total returns to shareholders than industry peers. That's the best-documented return on investment in user experience and design, measured in revenue growth.
Measuring this on your own ecommerce sites takes funnel tracking per device. The tools in our ecommerce analytics ranking split conversion by mobile and desktop for ecommerce websites, so potential customers lost at checkout show up as a number per step.
For ecommerce sites the arithmetic is direct. At Contentsquare's averages, moving mobile conversion from about 2.0% to the 3.4% desktop rate would mean about 70% more orders per mobile visit with no extra traffic, and slow landing pages and checkout friction are the two causes the figures above measure. Teams that drop the ball on either one pay for traffic that never converts.
Video content, personalization and user engagement
Video is the default on business websites now. Wyzowl's 2026 video marketing survey found 91% of businesses use video as a marketing tool, and its video marketers report these user engagement results:
- 83% say video has directly increased sales.
- 82% say video has kept visitors on their website longer.
- 82% say video has helped increase web traffic.
- 85% say video has helped them generate leads.
Those are self-reported by marketers, so read them as sentiment from people who sell video. The consumer side is firmer: 63% of people said they'd most like to watch a short video to learn about a product, so users prefer video content to text explainers by Wyzowl's count. Of the same consumers, 85% said a video had convinced them to buy, so websites with video content get credit for conversion from marketers and buyers alike.
Personalization sets the bar for an engaging user experience. McKinsey's November 2021 study The value of getting personalization right found 71% of consumers expect personalized interactions and 76% get frustrated when that doesn't happen. Personalization most often drives a 10% to 15% revenue lift.
AI-driven personalization is turning static pages into dynamic content. One Figma respondent in three is launching AI-powered products, and 51% of those teams are building agents, up from 21% a year earlier.
Consistency is the other half of user satisfaction. Salesforce's State of the Connected Customer research, 6th edition, surveyed 14,300 people: 79% expect consistent interactions across departments, and 80% say the experience a company provides is as important as its products and services.
Website visitors who get both stay. Wyzowl's dwell-time figure and McKinsey's frustration figure measure user retention from two sides, and both depend on a page answering the question in the format users prefer. The user experience on the first visit decides if there's a second, and design changes meant to increase user engagement only get tested when the first user interaction worked.
Accessibility statistics: 95.9% of home pages fail WCAG 2 checks
The WebAIM Million 2026 tested 1,000,000 home pages in February 2026. 95.9% had detected WCAG 2 failures, and the average page carried 56.1 errors, up 10.1% from 51 in 2025. Six failure types account for 96% of all detected errors.
| Failure type | Home pages, 2025 | Home pages, 2026 | Change (points) |
|---|---|---|---|
| Low contrast text | 79.1% | 83.9% | +4.8 |
| Missing alternative text for images | 55.5% | 53.1% | -2.4 |
| Missing form input labels | 48.2% | 51.0% | +2.8 |
| Empty links | 45.4% | 46.3% | +0.9 |
| Empty buttons | 29.6% | 30.6% | +1.0 |
| Missing document language | 15.8% | 13.5% | -2.3 |
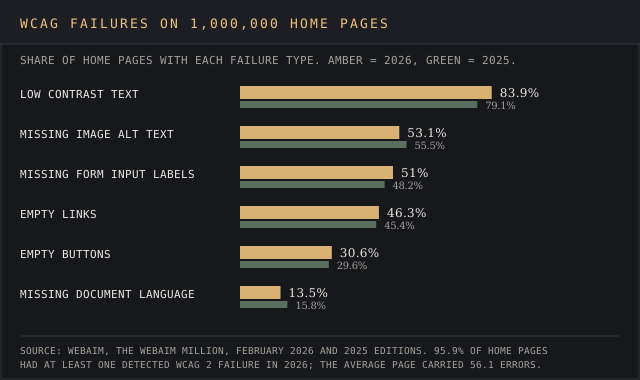
Low-contrast text grew most, by 4.8 points, and it's a pure visual design choice, light gray text on white backgrounds, that degrades the user experience for low-vision readers. Failures like that are par for the course on template sites, where a theme's default palette ships to thousands of pages unchanged.
Alt text is the one bright spot, down 2.4 points to 53.1% of pages. Teams that skip alt text also fail screen-reader users who rely on it to know what an image shows, a user experience no visual review catches.
Teams with voice user interface plans start from the same markup. The document language attribute a screen reader uses to pick a pronunciation was missing on 13.5% of home pages, and empty links and empty buttons give spoken interfaces nothing to announce.
Web design industry and global web design market size
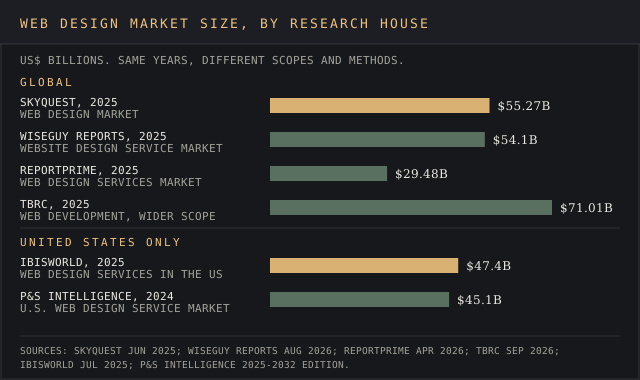
IBISWorld puts US web design services revenue at $47.4 billion in 2025, after 2.3% annual growth since 2020. The industry counts 203,000 businesses, growing at a 4.9% annual rate since 2020, and 889,000 employees.
P&S Intelligence sized the U.S. web design service market at $45.1 billion in 2024 and forecasts $79.5 billion by 2032, a 7.5% CAGR. Two houses, two years and a gap of $2.3 billion, which is close for this web design industry.
The global web design market estimates spread much wider:
- SkyQuest (June 2025): $49.93 billion in 2024 and $55.27 billion in 2025, reaching $124.64 billion by 2033 at a 10.7% CAGR.
- WiseGuy Reports (August 2026): $50.9 billion in 2024 and $54.1 billion in 2025, reaching $100 billion by 2035 at 6.3%.
- Reportprime (April 2026): $29.48 billion in 2025, reaching $47.03 billion by 2032 at 6.90%.
- The Business Research Company (September 2026), sizing the wider development market: $71.01 billion in 2025 and $76.25 billion in 2026, reaching $102.28 billion by 2030 at 7.6%.
What website design costs a small business is a separate number. Basic website design costs $1,000 to $3,000 at three-quarters of the agencies GoodFirms surveyed: 35.1% of agencies quote $1,000 to $1,500 for a website, 24.3% quote $2,000 to $2,500 and 16.21% charge a flat $3,000. The survey covered agencies in the USA, Ukraine and India, so a web design agency in New York and a freelancer in Kyiv sit inside the same brackets.
Those brackets put a basic site within reach of a sole trader, and the custom builds that cost an arm and a leg sit outside this survey.
Small businesses are the buyers behind those brackets, since GoodFirms framed its survey around business websites for small firms. Our small business statistics report counts the firms behind that demand.
Why the published web design statistics disagree
The market estimates disagree on scope before they disagree on growth. Reportprime's $29.48 billion global figure for 2025 is smaller than IBISWorld's $47.4 billion for the US alone, while SkyQuest and WiseGuy put the whole world at $55.27 billion and $54.1 billion. The Business Research Company's $71.01 billion counts development work as well, a wider service set.
Two global houses put the world at about the size two other houses give the US, so the houses disagree about what a web design market contains. Compare each house only with its own earlier editions, and quote the house by name with every figure.
Behavioral web design statistics disagree on age. Roundups of web design stats are a dime a dozen, and most restate a handful of old studies as current findings:
| Figure as quoted | Original study | Year | Sample |
|---|---|---|---|
| 94% of rejections tied to design | Sillence et al., CHI | 2004 | 15 participants |
| 46.1% cite design look for credibility | Stanford for Consumer WebWatch | 2002 | 2,684 participants |
| 50 milliseconds to judge a page | Lindgaard et al., Behaviour & Information Technology | 2006 | Lab experiment |
| 74% more likely to return to mobile-friendly sites | Google, Sterling Research and SmithGeiger | 2012 | 1,088 smartphone users |
| 53% abandon after 3 seconds | Google, The Need for Mobile Speed | 2016 | 10,000+ mobile domains |
Each of those studies describes 3G phones, 2002 browsers or a 15-person lab. The measured series (HTTP Archive, WebAIM, Statcounter, Contentsquare) crawl web pages or count sessions every year and describe the current web.
Responsive adoption depends on the measure. The 95.2% viewport figure counts pages carrying a tag, and a page can carry the tag and still overflow a 360-pixel screen. GoodFirms' 73.1% complaint rate about non-responsive layouts comes from web designers describing the sites they get hired to fix, the ones already headed back to the drawing board.
Self-reported figures run high. Wyzowl's 83% sales figure comes from video marketers, and Figma's AI satisfaction scores come from Figma users; HTTP Archive and Contentsquare measure pages and sessions directly.
AI in web design: 84% of developers use or plan to use AI tools
AI tools are standard in web development. The Stack Overflow Developer Survey 2025, with about 49,000 respondents, found 84% using or planning to use AI tools, up from 76% in 2024, and 51% of professional developers use them daily.
Trust lags use. Positive sentiment fell to 60% from 70%+ in 2023 and 2024, and 46% of developers distrust the accuracy of AI output against 33% who trust it; 3% trust it highly. In the 2024 survey, 81% named increased productivity as the biggest benefit.
Designers rate AI lower than developers do. Figma's 2025 AI Report, a survey of 2,500 Figma users, found:
- 82% of developers and 69% of designers satisfied with their AI tools.
- 67% of developers and 54% of designers saying AI improves the quality of their work.
- 78% agreeing AI makes their work more efficient, while 32% say they can rely on the output.
- One respondent in three launching AI-powered products, up 50% on the year before.
- 51% of those building AI products building agents, up from 21%.
Figma's own resource page of web design statistics adds that 33% of designers use AI to generate raw assets and 40% use it for data analysis in the discovery phase. Agents and AI-driven personalization are the latest trends in that data and the web design trends with numbers behind them, and teams ahead of the curve are shipping them inside products.
AI is a traffic source too. Adobe measured traffic to retail sites from generative AI tools up 693.4% year over year in the 2025 holiday season, a referral channel growing beside organic traffic from search. Our AI statistics report tracks the user numbers behind it.
Web design career statistics: 220,100 jobs at a $99,520 median
The US Bureau of Labor Statistics counts 220,100 web developer and digital designer jobs in 2025 in its Occupational Outlook Handbook, at a median $99,520 a year ($47.85 an hour). Employment is projected to grow 5% from 2025 to 2035, faster than the 3% average, adding 11,300 jobs and about 13,600 openings a year.
| Occupation | Jobs, 2025 | Median pay, May 2025 | Lowest 10% earn under | Highest 10% earn over | Projected change, 2025-35 |
|---|---|---|---|---|---|
| Web and digital interface designers | 132,700 | $104,000 | $53,750 | $201,550 | +5% (combined with web developers) |
| Web developers | 87,400 | $92,650 | $48,100 | $162,290 | +5% (combined) |
| Graphic designers | 253,100 | $62,960 | n/a | n/a | -2% |
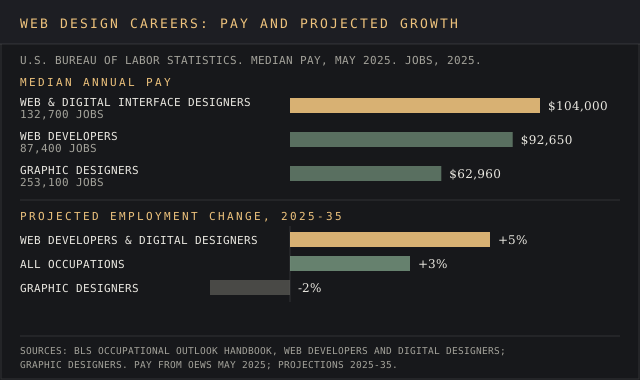
The graphic designers' figures come from the BLS graphic designers profile: 253,100 jobs, a $62,960 median and a 2% projected decline, with about 16,000 openings a year from turnover. Website designers who code or design interfaces sit in the growing category, and web designers whose work is print and static graphics sit in the graphic designers category that BLS projects to shrink.
Freelance web designers are a large slice of the field. BLS counts 18% of web developers and 13% of web and digital interface designers as self-employed, and the information industry employs 27% of interface designers. Our freelance statistics report covers what independent workers earn across fields.
BLS ties the growth to e-commerce, with retail firms adding online offerings, from chains to small retail businesses. It also states that better web development tools and wider use of AI for web development may soften the employment growth of these workers. For web designers weighing website design and development as a career, education runs from a high school diploma to a bachelor's degree.
Where each web design figure was read, and how old the most quoted studies are
Traffic, devices and speed: gs.statcounter.com (platform and screen resolution data, September 2026), almanac.httparchive.org (Web Almanac 2025 page weight, performance and SEO chapters), blog.amp.dev (Google's Need for Mobile Speed study, 8 September 2016), adsense.googleblog.com (Google's mobile survey, September 2012) and developers.google.com (Search Central mobile-first indexing documentation).
Conversion, commerce and engagement: contentsquare.com (2026 Digital Experience Benchmark), baymard.com (cart abandonment list), census.gov (quarterly e-commerce report for Q2 2026), news.adobe.com (2025 holiday shopping release, 7 January 2026), wyzowl.com (2026 video marketing survey), mckinsey.com (The business value of design, October 2018; personalization study, November 2021) and salesforce.com (State of the Connected Customer, 6th edition).
Design research and accessibility: webaim.org (WebAIM Million, February 2026), nngroup.com (eye-tracking studies of photos and flat design), doi.org (Lindgaard et al., Behaviour & Information Technology, 2006), hci.rwth-aachen.de (Sillence et al., CHI 2004), advocacy.consumerreports.org (Consumer WebWatch credibility study, October 2002) and credibility.stanford.edu (Stanford Guidelines for Web Credibility).
Market, AI and careers: ibisworld.com (July 2025), psmarketresearch.com, skyquestt.com (June 2025), wiseguyreports.com (August 2026), reportprime.com (April 2026), thebusinessresearchcompany.com (September 2026), goodfirms.co (updated 29 May 2026), survey.stackoverflow.co (2024 and 2025 Developer Surveys), figma.com (2025 AI Report and web design statistics page) and bls.gov (Occupational Outlook Handbook profiles for web developers and graphic designers).
Every figure was checked against its source on 7 October 2026. The most quoted behavioral figures come from studies run between 2002 and 2016, so each one carries its year, and the annual measured series carry the current picture.
Frequently asked questions
Is web design still in demand in 2026?
Yes, by the BLS numbers. Web developers and digital designers held 220,100 jobs in 2025, with 5% growth projected to 2035 against a 3% average and about 13,600 openings a year. Demand shifts toward interface work: designers earn a $104,000 median, and graphic design jobs are projected to fall 2%.
Is AI replacing web designers?
The jury's still out, and BLS hedges in print: it projects 5% growth while warning that AI may soften it. Figma's survey found 69% of designers satisfied with AI tools and 32% of respondents able to rely on the output.
Is responsive web design still a thing?
It's the default. 95.2% of mobile pages carry a viewport tag, Google recommends responsive web design as the easiest pattern to maintain, and its index has ranked the mobile version of pages since mobile-first indexing finished in 2023. With 58.99% of page views on phones, mobile friendly websites are the baseline, and top ranking websites are judged on their mobile pages.
What are the standard breakpoints for responsive design in 2026?
Statcounter's September 2026 data puts the top five mobile widths between 360 and 414 CSS pixels, led by 414 x 896 at 13.35% and 360 x 800 at 7.54%. On desktop, 1920 x 1080 holds 28.07%, followed by 1536 x 864 at 10% and 1366 x 768 at 7.95%. Test at those widths before picking breakpoint values.
What are some important statistics about web design?
To cut to the chase, five carry the most weight for website design in 2026: 58.99% of page views come from mobile devices, 95.9% of home pages fail WCAG 2 checks, the median mobile home page weighs 2.6 MB, 48% of mobile pages pass Core Web Vitals and desktop conversion rates of 3.4% run against about 2.0% on mobile web. Each comes from a dataset updated every year.
How to get stats on a website?
For your own site, an analytics tool such as Google Analytics gives traffic, devices and conversions, and our Google Analytics vs Hotjar comparison covers adding heatmaps and recordings. The Hotjar review details those recordings, and web analytics pricing runs from $0 upward.
For someone else's website traffic, estimators fill the gap. The Similarweb review and our website traffic analysis tools ranking cover estimated visits and device splits, and the BuiltWith review covers detecting which CMS and frameworks a site runs.
Bottom line
The measured web design statistics for 2026 describe a web that's mostly mobile, mostly responsive on paper and mostly inaccessible in practice. Phones bring the majority of page views, desktop still converts better, and nearly every home page fails a basic accessibility check that a contrast fix or an alt attribute would clear.
The quoted web design statistics and design statistics in general deserve a second look before they go into a pitch deck. Market sizes depend on which house drew the boundary, and the most repeated behavioral figures come from studies run between 2002 and 2016.
For a website redesign, bite the bullet on the measurable items first: page weight, contrast, alt text, mobile conversion rates and loading time on the landing page that gets the most paid traffic. Those are the numbers that move each year, and they're the ones a visitor feels in the first 50 milliseconds.