Cart abandonment rate 2026: a 70.22% average and the reasons shoppers leave
 By Jan Suski. I go deep on every review, checking every number against its source and digging up details other coverage misses, a habit from six years of SEO and link building for tech companies. Bylines at Brand24 and Senuto. How the scoring works.
Seven in ten online shopping carts never become an order, the core of every shopping cart abandonment benchmark. Baymard Institute puts the average documented shopping cart abandonment rate at 70.22%, the plain mean of 50 studies published between 2006 and 2025, in its list updated October 28, 2026. The individual studies run from 55% to 84.27%.
A large share of it is fixable. Among US online shoppers who left a checkout for a reason other than browsing, 40% blamed extra costs such as shipping, tax and fees, and Baymard estimates large ecommerce sites could lift conversion rates 35.26% with a better checkout flow.
This report collects cart abandonment statistics by study, device, industry and cause, explains why the published rates disagree, and adds the recovery and average order value benchmarks that decide how much revenue a store can win back. It's written for ecommerce managers, online retailers and analysts sizing the cost of abandoned carts against their own shopping carts.
The numbers Cart abandonment and recovery, checked November 2026
A shopping cart abandonment rate near 70% is normal: Baymard's 50 studies average 70.22%, and the newest, from Uptain in 2025, reads 71.72%.
Cost causes the most exits: 40% of shoppers who abandoned for a reason other than browsing named extra costs, twice the 20% who named slow delivery.
Recovery pays per message: Klaviyo's abandoned cart emails earn $6.77 per recipient, the highest of any automated flow it measures.
Checkout, payments and email vendors quote abandonment numbers in every pitch. Send the country, the category or the device split and I'll source a version you own.
What the cart abandonment rate measures
The shopping cart abandonment rate is the share of shopping carts that were created and never turned into completed purchases, and it's the clearest measure of customer behavior between product page and payment.
A shopper who adds a product, opens the cart and closes the tab counts as one abandoned cart. A shopper who never adds anything doesn't count at all, which is why a store's shopping cart abandonment rate is always far lower than its share of website visitors who leave without buying. Online cart abandonment measures intent that already exists: the store has already paid to attract customers as far as the cart.
How to calculate cart abandonment rate
The formula is: cart abandonment rate = (1 − completed purchases ÷ shopping carts created) × 100. A store with 850 shopping carts created in a week and 200 orders has a shopping cart abandonment rate of 76.5%. The two counts must cover the same period and the same sessions, or the rate drifts with every campaign. Shopify, covered in our Shopify statistics, lists abandoned checkouts in its own admin.
Cart abandonment against checkout abandonment
Checkout abandonment counts only online shoppers who started the checkout process, entering an email address or a shipping address, then left. It runs lower than shopping cart abandonment, because the window shopping and price comparison that fill online shopping carts happen before the checkout process begins. Report the two side by side; a rising checkout abandonment rate with a flat cart rate points at the checkout process and the checkout flow itself.
Average cart abandonment rate across 50 studies
Baymard's average is a list of studies with no panel of its own. It takes every published study that reports an overall ecommerce cart abandonment rate and calculates an unweighted mean. The list is useful because it shows the spread behind the 70.22%.
| Study | Year | Cart abandonment rate |
|---|---|---|
| Uptain | 2025 | 71.72% |
| SaleCycle | 2023 | 79.53% |
| Fresh Relevance | 2022 | 68.70% |
| SaleCycle | 2020 | 84.27% |
| Fresh Relevance | 2020 | 57.60% |
| Barilliance | 2019 | 77.13% |
| Forrester | 2010 | 55.00% |
| MarketingSherpa | 2006 | 59.80% |
Copy these lines into an email, fill them in and send. I reply with scope and a price within 2 to 3 business days.
Open the emailThe average has barely moved in a decade, because each new study shifts a mean of 50 by a fraction of a point. A store comparing its shopping carts with the average abandonment rate in that list is comparing against two decades of ecommerce stores, desktop-era checkout process designs included.
Why published cart abandonment statistics disagree
The studies measure different shoppers, and every shopping cart abandonment rate on the list depends on whose shopping carts were counted. SaleCycle and Fresh Relevance both sell cart recovery software and report on their own client sites, and the two put 2020 at 84.27% and 57.60%, a 26.67-point gap in the same year. Client mix decides the average abandonment rate: a base heavy with travel and fashion sites reads higher than one heavy with grocery and repeat purchase.
Device mix is the second split. SaleCycle's 2022 client data shows 83.22% abandonment on mobile and 71.81% on desktop, so a dataset that tilts toward phones reads higher before anything else changes. The third is the definition of a cart, which each tool sets for itself, so read between the lines of any benchmark before you compare.
One live benchmark has dropped out of the record. Dynamic Yield, the personalization company Mastercard agreed to buy from McDonald's in December 2021, published a monthly cart abandonment benchmark by device and industry. On November 19, 2026, its benchmark URLs redirected to a Mastercard product page, so its figures can't be checked at the source and aren't used here.
Cart abandonment by industry
Industry shopping cart abandonment rates follow purchase type. SaleCycle's 2023 report, built on more than 6 billion tracked user sessions and 480 million abandoned baskets, ranks travel and fashion above retail. Within retail, groceries and pharmaceuticals sit at the lower end because they're subscription or repeat purchases, as do gardening and DIY and consumer electronics.
Travel is a special case that SaleCycle calls booking abandonment. A shopper who picks dates and a flight, then leaves, is often still on the fence or has gone to compare prices on another site. High consideration and a high average order are par for the course in travel, and the same goes for luxury, where SaleCycle notes average orders almost double those in consumer fashion.
Recovery value also varies by vertical, since abandoned shopping carts carry the average order with them. Klaviyo's 2026 data shows the top 10% of hardware and home improvement brands earning $35.24 per abandoned cart email recipient and the top 10% of automotive brands $27.48, against a $6.77 average across all brands. Big tickets mean each recovered cart is worth more, so a high cart abandonment rate in an expensive category is where the most recoverable revenue sits.
Mobile abandonment against desktop
Mobile abandonment runs higher in every dataset that splits by device, and shopping online on a phone produces more abandoned shopping carts. SaleCycle's 83.22% on mobile against 71.81% on desktop is an 11.41-point gap. Baymard puts the cause in the checkout process: smaller screens, harder form entry and weaker error recovery.
The conversion data tells the same story from the other end. Contentsquare's 2026 benchmark puts desktop conversion at 3.4%, 74% higher than mobile web at about 2%, while mobile carries most of the traffic.
A store where 70% of shoppers arrive on a phone should expect a higher blended shopping cart abandonment rate than a desktop-heavy B2B shop, before any checkout usability issues come into play, and website speed on mobile networks adds to the gap. Our average bounce rate report covers the same device gap one step earlier, at the landing page.
Why shoppers abandon their carts
Browsing is the largest single reason website visitors leave shopping carts behind. Baymard's survey found 42% of US online shoppers abandoned because they were "just browsing / not ready to buy," which is window shopping with a save button. Those shopping carts aren't a checkout failure, and no checkout redesign wins them back.
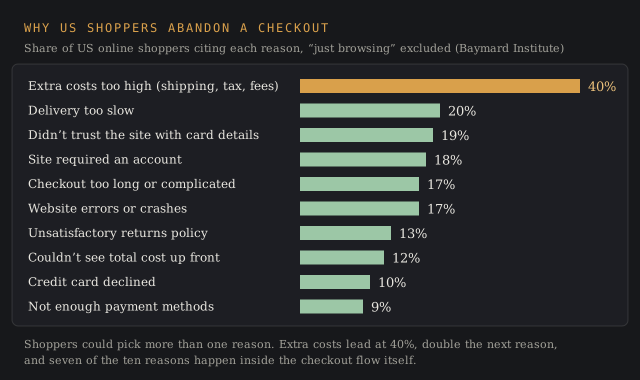
The other reasons are where the lost revenue sits. Among shoppers who abandoned for a reason other than browsing, Baymard's ranking runs:
Want a survey chart like this for your own shoppers? Send the market and the question.
Email a brief- Extra costs too high (shipping costs, tax, fees): 40%
- Delivery too slow: 20%
- Didn't trust the site with credit card information: 19%
- Site wanted an account created: 18%
- Too long or complicated checkout process: 17%
- Website errors or crashes: 17%
- Returns policy wasn't satisfactory: 13%
- Couldn't see or calculate the total cost up front: 12%
- Credit card was declined: 10%
- Not enough payment methods: 9%
Unexpected costs lead because shoppers meet them last, after their shopping carts are full. A product page that shows $40 and a checkout that shows $52 after shipping fees and tax is the last straw, turning purchase intent into a lost sale at the final step.
High shipping costs head the list, slow delivery at 20% and security concerns at 19% follow, a declined card at 10% adds insult to injury after a long form, and the 18% who left over mandatory account creation are the easiest fix on the list.
What abandoned shopping carts cost
Baymard estimates $260 billion in lost orders is recoverable through better checkout flow and design across the US and EU, based on $738 billion in combined ecommerce sales; our ecommerce statistics report covers those sales figures market by market. That's the share it attributes to checkout usability issues; the full value of every abandoned cart is larger, since it includes browsers who never meant to buy.
The cost compounds upstream. Every abandoned cart was a visitor someone paid to attract: customer acquisition costs on paid search and social are spent before anyone knows if the order completes, which is how much revenue each ecommerce business leaves in shopping carts before counting the order itself.
Money doesn't grow on trees. A store that cuts its abandonment rate earns more from the same marketing efforts without buying one more click, and new customers who complete a first order become loyal customers who lift customer lifetime value, with no added operational costs per visit.
The 35.26% figure is Baymard's estimate of how much conversion rates on large ecommerce sites could rise if they fixed the checkout design issues it has documented as solvable. It's a ceiling: across 60 benchmarked sites, the best-performing checkouts still average 39 areas for improvement.
Baymard estimates large ecommerce sites could lift conversion rates 35.26% by fixing the checkout design issues it has documented as solvable.
Conversion lift available to large ecommerce sites from checkout fixes
Source: Baymard Institutee.g. checkout completion rates for your category
Source: linked, checked, datedCheckout design: form fields and guest checkout
The average US checkout shows 23.48 form elements by default, 14.88 of them form fields, according to Baymard's checkout benchmark. Baymard's testing puts the ideal checkout flow at 12 to 14 form elements, or 7 to 8 fields, so most checkouts could show 20% to 60% fewer elements without losing data they need. The devil's in the details: a second address line, a company field and a separate phone field each add an element.
Guest checkout is the single change with a clear number attached. The 18% of shoppers who abandoned because the site wanted an account created are the measure of what mandatory account creation costs. Offering a guest checkout and asking for a password after the order keeps the customer data and removes the reason.
Baymard documents 140 checkout usability causes in total, from address validation to field labels, and a complicated checkout process is where most stores start.
A better checkout flow also covers the checkout experience before the checkout begins. Showing estimated shipping costs and fees on the product page or in the cart removes the 12% who couldn't see the total cost up front, and offering multiple payment options, digital wallets included, addresses the 9% who didn't find their preferred payment method. Our BNPL statistics report covers how buy now, pay later options change checkout completion.
Recovering abandoned carts: email and SMS benchmarks
Abandoned cart messages are the highest-earning automated flow in Klaviyo's data. The 2026 abandoned cart benchmarks report, published October 2, 2026 from more than 110,000 Klaviyo customers, puts the averages at:
- Email: 6.0% click rate and $6.77 revenue per recipient; the top 10% of brands reach 11.3% and $13.70
- SMS: 10.3% click rate and $4.48 revenue per recipient; the top 10% reach 18.5% and $8.69
Klaviyo's earlier benchmark measured the placed order rate of abandoned cart flows at 3.33%, the highest conversion rate of any automated flow. Read that as the share of recipients who buy, which is the honest measure of how email flows recover lost revenue.
The setup of the flow matters as much as having one. Klaviyo's top 10% of brands earn $13.70 per abandoned cart email recipient against $6.77 for the average brand, about twice as much from the same trigger.
Recovery is a drop in the bucket next to prevention. A 3.33% placed order rate on a flow that reaches half of abandoners wins back under 2% of abandoned carts; a checkout fix that removes the 18% account-creation exit works on every visit. See our email marketing statistics and SMS marketing statistics for the wider channel benchmarks.
How to reduce cart abandonment
To reduce cart abandonment, start with the reasons you can measure. Session recordings and funnel reports, from tools like the one in our Hotjar review, show where shoppers stop, and the Baymard ranking shows which causes are worth testing first. The fixes with published evidence behind them:
- Show the total cost early: put shipping fees, tax and duties on the product page or in the cart, and state free shipping thresholds before checkout.
- Offer guest checkout and drop mandatory account creation, the cause behind 18% of abandonment.
- Cut form fields toward Baymard's 7 to 8 field target and fix address and card validation errors.
- Add enough payment methods: cards, digital wallets and the local payment methods your shoppers use, so nobody leaves without a preferred payment method.
- Fix website speed and errors, since 17% of shoppers left over crashes and errors on the ecommerce site; fewer abandoned carts follow fewer errors.
- Show trust signals near the payment step to answer the 19% who didn't trust the site with their card.
- Run abandoned cart email and SMS flows for the shopping carts that still get away, timed for the hours after shoppers abandon their carts.
Offering free shipping above a threshold kills two birds with one stone, working on cost and on order size at once. It addresses the top reason online shoppers abandon their carts and pushes basket value up, which is where cart abandonment meets average order value. Our ecommerce analytics ranking compares the tools that track both, and our retail analytics ranking covers store-level tools.
Average order value and cart abandonment
Average order value is total revenue divided by the number of orders over the same period. A store with $500,000 in sales across 4,000 orders has an AOV of $125. Salesforce Shopping Index data, covering more than 1.5 billion shoppers, put the global average order across Cyber Week 2025 at $115, up 4.7% year over year, with the US at $137 and the UK at $82, as diginomica reported on November 30, 2025.
AOV and abandonment pull against each other. Tactics that push AOV up, such as cross selling at checkout or a free shipping threshold set just above the typical order, add steps or costs, and extra costs are the top reason in Baymard's survey. Track the two together, along with conversion rates: an AOV gain that costs more in abandoned carts than it adds in sales revenue is a loss.
Gross merchandise value is the related marketplace metric: the total value of goods sold through a platform before fees, returns and cancellations. GMV divided by orders gives the average order on a marketplace, and our Black Friday statistics track how both move in peak season.
Delivered for your site and your byline. Hosting here is optional.
Frequently asked questions
What's a good cart abandonment rate?
Anything below the 70.22% Baymard average cart abandonment rate is better than the typical store, and a rate in the 50s or low 60s is good for most retailers. Shopping cart abandonment in grocery, pharmacy and repeat-purchase stores runs lower; travel, luxury and fashion run higher. Compare the rate for your own shopping carts with your own trend and your own category first.
What is the average shopping cart abandonment rate?
The average shopping cart abandonment rate is 70.22%, the mean of 50 studies listed by Baymard Institute, updated October 28, 2026. The most recent study in the list, Uptain's for 2025, reads 71.72%.
What percentage of users abandon their shopping cart: 30%, 55%, 70% or 82%?
About 70% of shopping carts. Baymard's 50-study average shopping cart abandonment rate is 70.22%. SaleCycle's client data reads higher at 79.53%, and the lowest study in Baymard's list is Forrester's 55% from 2010.
How do you calculate cart abandonment rate?
Divide completed purchases by shopping carts created, subtract the result from 1, and multiply by 100. With 1,000 shopping carts and 300 orders, the cart abandonment rate is 70%; online retailers with several stores should calculate it per store.
How do you find the average order value?
Divide total revenue by the number of orders for the same period. Exclude refunds and taxes consistently, or the AOV moves with your accounting.
What is AOV and GMV?
AOV is average order value, revenue per order. GMV is gross merchandise value, the total value of goods sold on a platform before deductions. GMV divided by order count gives a marketplace's average order.
Is high AOV good?
A rising AOV is good when it doesn't come with a rising shopping cart abandonment rate or more returns. Read it next to conversion rates, sales revenue and margin; an AOV gain built on bundles shoppers abandon is a lost sale counted twice.
Bottom line
The average shopping cart abandonment rate is 70.22%, and the published range from 55% to 84.27% is mostly a story about whose shopping carts each study counted. A rate in the high 60s or low 70s is normal; the number to watch is your own cart abandonment rate by device and by step, alongside conversion rates.
The money sits in the checkout. Extra costs, slow delivery, distrust and forced account creation account for most non-browsing exits in Baymard's survey, and Klaviyo's $6.77 per abandoned cart email shows recovery works. Prevention works on every visit to reduce cart abandonment, and a stitch in time saves nine: fix the checkout first and recover what's left.
Payments firms, checkout vendors and agencies use reports like this one in sales decks and client briefs.
A report on your topic for a blog page, gated content or a lead magnet.
Written for your client and published under their brand, with my name left off.
Your report on marketintelligencetools.com, with 2 to 3 CTAs carrying your sponsored links.
Default terms: the report is yours to publish, and I keep the right to republish it on this site behind a gate, outside Google's index.
Sources behind every abandonment figure, and the industry split no one keeps current
Abandonment rates and the reasons survey come from Baymard Institute's cart abandonment page and study list, updated 28 October 2026, which also supplies the checkout benchmark and the $260 billion estimate. Device figures are SaleCycle's 2023 Ecommerce Stats & Trends Report, built on its 2022 client data.
Recovery benchmarks are Klaviyo's 2026 abandoned cart benchmarks report (2 October 2026) and its earlier benchmark page. Conversion by device is Contentsquare's 2026 benchmark guide. Cyber Week order values are Salesforce Shopping Index data as reported by diginomica on 30 November 2025. Dynamic Yield's benchmark pages redirected to a Mastercard product page when checked on 19 November 2026.
All figures were checked on 19 November 2026. No source cited here publishes a current, dated cart abandonment rate by industry with its sample.