Average bounce rate 2026: a 60.15% median and 57% to 75% by channel in GA4
 By Jan Suski. I go deep on every review, checking every number against its source and digging up details other coverage misses, a habit from six years of SEO and link building for tech companies. Bylines at Brand24 and Senuto. How the scoring works.
There's no single average bounce rate in 2026, and the published figures run from 30.5% to 75.4%. Databox puts the median at 60.15% across more than 2,000 companies. CXL's own GA4 data for August to October 2026 shows 57.0% for organic search and 75.4% for organic social.
The spread comes from definitions more than from visitors. Google Analytics 4 counts a session as a bounce when it lasts 10 seconds or less, views one page and fires no key event, while Universal Analytics counted every single-page session. A blog post read for four minutes was a bounce in 2017 and is an engaged session today.
This report collects bounce rate benchmarks and industry benchmarks by channel, by industry, by page type and by device, names the publisher and the sample behind each, and explains why the numbers disagree. It's written for marketers, SEO leads and website owners comparing their own site's bounce rate against published figures, and for anyone asked by a client or a boss what a good bounce rate is.
The numbers Bounce rate benchmarks, checked November 2026
A 45-point spread between the lowest and highest published figure means the source and the definition matter more than the number: Similarweb's 30.5% and CXL's 75.4% measure different things.
Channel decides more than industry: CXL's organic search and organic social sessions sit 18.4 points apart on the same website in the same quarter.
Speed is the one cause with a measured effect size: Google's 2017 study found a 32% rise in bounce probability between a 1-second and a 3-second load.
I'll write a 2,500+ word report on the market you name, with GA4 definitions, published benchmarks and vendor data linked to their sources. Yours to publish, from $200.
What bounce rate measures in GA4
Bounce rate in GA4 is the percentage of sessions that weren't engaged. According to Google Analytics Help, an engaged session is one that lasts longer than 10 seconds, has a key event, or has two or more page or screen views. Google calls bounce rate "the opposite of the engagement rate," so the two always add up to 100%.
A bounce, then, is a single page session where the visitor lands, reads for under 10 seconds and leaves without further action. A visitor who reads one page for three minutes and closes the browser window isn't a bounce in GA4. A visitor who clicks through to a second page always counts as engaged, even if they leave a second later, so any session that reaches more than one page drops out of the bounce count.
How to calculate bounce rate
The formula is short: bounce rate = (unengaged sessions ÷ total sessions) × 100. A site with 10,000 sessions, 4,200 of them unengaged, has a bounce rate of 42%. GA4 does the session counts for you; the arithmetic matters when you export raw data or compare tools, and our web analytics pricing report covers what those tools cost.
Older tools and some privacy-first analytics still count single page visits as bounces. Plausible defines bounce rate as single-page sessions divided by total sessions, times 100, with a bounce being a visit that views only one page and takes no specified action.
Bounce rate in GA4 against Universal Analytics
Universal Analytics stopped processing hits on July 1, 2023, and Google removed access to UA properties and the API in the week of July 1, 2024, according to Google's sunset notice. Every bounce rate benchmark published before mid-2023 used the UA definition: any session with one page view was a bounce, no matter how long it lasted.
Read old figures with that date in mind, because the devil's in the details: a 2017 benchmark and a 2026 benchmark can share a label and measure different sessions.
Bounce rate benchmarks by traffic channel
The traffic source moves bounce rate more than anything else. CXL published GA4 bounce rates for sessions landing on its own /blog/ pages from August 1 to October 31, 2026, with direct and unassigned traffic excluded because of automated sessions. The CXL benchmark page also republishes a UA-era channel table from about 2017.
| Channel | UA era, about 2017 | GA4, CXL blog, Aug to Oct 2026 | GA4 average session duration |
|---|---|---|---|
| Organic search | 43.6% | 57.0% | 2 min 38 s |
| Referral | 37.5% | 63.0% | 2 min 28 s |
| AI assistants | Not tracked | 63.1% | 3 min 21 s |
| Paid search | 44.1% | 69.2% | 1 min 22 s |
| 35.2% | 69.3% | 1 min 5 s | |
| Social / organic social | 54.0% | 75.4% | 47 s |
| Display | 56.5% | Not reported | Not reported |
| Direct | 49.9% | Excluded | Excluded |
Copy these lines into an email, fill them in and send. I reply with scope and a price within 2 to 3 business days.
Open the emailEmail is the line to watch for anyone comparing marketing channels. In the UA-era table it had the lowest bounce rate of any channel, at 35.2%. In CXL's GA4 data it's the second highest, at 69.3%. That's one blog's newsletter traffic, so it isn't a law, but it means the old claim that email traffic always bounces least doesn't survive the switch to GA4.
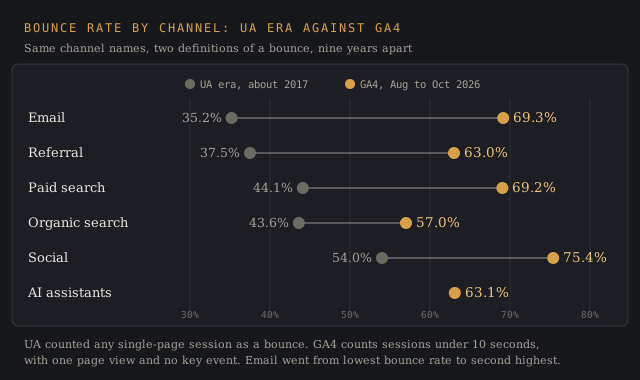
AI assistants deserve a line of their own. CXL's AI-referred sessions bounced at 63.1% but ran the longest, at 3 minutes 21 seconds. Contentsquare's 2026 benchmark, built on 99 billion sessions across 6,500+ websites, found year-over-year bounce rate drops of 5% for AI-referred visitors, 4% for organic search and 3% for paid search. Our AI traffic report tracks how fast that referral source is growing.
Bounce rate by industry
Average bounce rate by industry is the most requested cut and the worst documented, and varying bounce rates across sectors come with varying definitions. The most-copied industry table online is a UA-era dataset from about 2017 that CXL republishes without naming the provider. Its spread is wide: food and drink at 65.52%, real estate at 44.50%, a gap of more than 20 points.
| Industry | Average bounce rate (UA era, about 2017) |
|---|---|
| Food & drink | 65.52% |
| Science | 62.24% |
| Reference | 59.57% |
| News | 56.52% |
| Finance | 51.71% |
| Travel | 50.65% |
| Business & industrials | 50.59% |
| Shopping | 45.68% |
| Real estate | 44.50% |
Newer industry benchmarks are thinner. Semrush's January 2026 guide quotes a Databox median of 44.04% from September 2024, with industries running from 35.76% for apparel and footwear to 48.38% for information technology and services. Similarweb's measured figures sit at the extremes, at 20.5% for TV, movies and streaming and 46.1% for quick-hit reference sites.
Real estate websites and ecommerce sites tend to show lower bounce rates because visitors browse listings and products across multiple pages and additional pages per visit. Food and drink sites are recipe pages: one search, one recipe, one tab closed. Read between the lines of any bounce rate by industry table and you'll find page type doing most of the work, so don't go back to the drawing board over a 60% figure on a recipe site.
Bounce rate by website and page type
Ranges by website type circulate on almost every guide, and they trace back to agency studies with no published sample. Plausible lists them and says they're based on reported averages from HubSpot, Siege Media and other agencies and tools, with no sample sizes or dates. Databox cites an older Custommedialabs set with tighter ecommerce and B2B bands.
- Content websites and pages: 65% to 90% (Plausible's list)
- Landing pages: 60% to 90% (Plausible and Custommedialabs)
- Service industry websites such as legal and automotive: 50% to 70% (Plausible)
- Travel and hospitality: 40% to 60% (Plausible)
- B2B websites: 25% to 65% in Plausible's list, 25% to 55% in Custommedialabs
- Real estate: 30% to 55% (Plausible)
- Retail and ecommerce: 20% to 55% in Plausible's list, 20% to 45% in Custommedialabs
- Lead generation: 30% to 55% (Custommedialabs)
A landing page built for one action sits at the top of the range because the visitor lands, converts or leaves, and a form fill on the same page counts as a key event in GA4 only if you've set it up. Measured page-type data is rarer. Contentsquare's 2026 data shows one in three visits now starts on a product detail page, and nearly two-thirds of those landings bounce.
For a glossary entry, a blog post or a support article with good content quality, a high bounce rate is par for the course, since most users land, get the answer and leave. Semrush's guide makes the same point: a glossary page can bounce often while answering every visitor's question.
Bounce rate on mobile devices and desktop
Mobile visitors bounce more, and every publisher that splits by device agrees on the direction. Similarweb reports a variance of more than 16% between mobile and desktop bounce rates in its own panel data; our Similarweb review covers how that panel data is collected.
Contentsquare's 2026 benchmark explains part of the gap with time. Desktop sessions average 4 minutes 46 seconds against 2 minutes 20 seconds on mobile, according to its engagement guide, and mobile now carries 69.9% of all traffic. Mobile carries the lion's share of visits; desktop makes up 30% of visits and 47% of time spent.
That traffic mix matters when you compare your website's bounce rate with a benchmark. A site with 80% mobile users will read higher than a desktop-heavy B2B site with equal content quality, so segment by device before you compare. Mobile visitors on a slow connection hit the page speed problem first.
Why the published average bounce rate figures disagree
| Publisher | Figure | Period | What sits underneath |
|---|---|---|---|
| Similarweb | 30.5% | October 2021 | Worldwide panel and clickstream estimates, all industries |
| Databox (via Semrush) | 44.04% | September 2024 | Median of connected GA accounts, by industry |
| Contentsquare | 45.4% and 49.2% | Q4 2025 | Tagged sessions on 6,500+ sites, split by tool usage |
| Databox | 60.15% | Page updated July 2025 | Median of 2,000+ benchmarked companies |
| CXL | 57.0% to 75.4% | Aug to Oct 2026 | One site's blog sessions in GA4, by channel |
| Fullstory | 40% to 55% "average" | Updated Sept 2026 | Editorial rule-of-thumb table, no sample |
- The industries, channels or metrics to compare
- Regions, years and segments
- Where it runs: blog, white-label, gated or lead magnet
- Whose byline goes on it
- Deadline
- 2,500+ words, human-written
- Every figure linked to its source
- Yours to publish, under your name or none
- Hosting here for +$200, with your sponsored links
Three things split them. The definition comes first: Similarweb's 2021 panel and pre-2023 GA accounts used single-page logic, while GA4 data after July 2023 uses the 10-second rule. The sample comes second: Databox benchmarks anonymized data from companies that use its platform, Contentsquare covers 6,500+ sites across nine industries, and CXL measures one marketing blog.
The third is the statistic. Databox publishes a median, Similarweb an average, Contentsquare a split by team behavior. A median of 60.15% and an average of 30.5% can both be honest about different populations. The Databox pair is the sharpest case: the 44.04% median Semrush quotes from September 2024 and the 60.15% median on Databox's own page sit 16.11 points apart.
Fullstory's 40% to 55% "average" band is the range most guides repeat, and Fullstory publishes it as an editorial table without a sample. Quote the definition, the sample and the period whenever you cite a number.
What counts as a good bounce rate
A good bounce rate is a website's bounce rate that's falling on the pages you care about, measured against the same page type and traffic source last quarter. The published thresholds are rules of thumb. Fullstory's table is the most cited version:
- Under 20%: suspicious
- 20% to 40%: good
- 40% to 55%: average
- 55% to 70%: high
- Over 70%: needs attention
Semrush sets the bar slightly differently: many sites aim for 40% or lower, and 60% or higher can mean a page isn't meeting expectations. Neither figure has a sample behind it. Against CXL's 57.0% organic search figure in GA4, a blog sitting at 55% is normal, and the same 55% on a checkout page would be a red flag: a high bounce rate there means missed sales.
A bounce rate under 20% usually points at a broken analytics setup, and a 100% bounce rate means every session in the period bounced, which on a whole site points the same way. Duplicate tracking tags fire two page views per load, and an event that fires on page load counts the session as engaged. If your bounce rate fell from 50% to 8% overnight, check the tag before you jump for joy.
Bounce rate, exit rate and engagement rate
Three metrics get mixed up, and the difference decides which one you should report:
- Bounce rate: the share of sessions that weren't engaged, measured across the entire website or for sessions that start on a specific page.
- Engagement rate: the share of sessions that were engaged; 100% minus bounce rate in GA4.
- Exit rate: the share of sessions that end on a given page, after visiting any number of other pages first.
A page can have a high exit rate and a low bounce rate at once, and internal links between pages decide where those exits happen.
A thank-you page after a purchase has an exit rate near 100% because the session ends there, and a bounce rate near zero because nobody lands on it first. On a pricing page, a high exit rate with a low bounce rate means visitors arrive from other pages, read and leave without taking the next step: interest, then an obstacle before the conversion event.
Page load speed and core web vitals
Load speed is the cause with the best evidence. Google/SOASTA Research from 2017 found the probability of a bounce rises 32% as mobile page load time goes from one second to three, and 123% from one second to ten.
Google/SOASTA Research found the probability of a bounce rises 32% as mobile page load time goes from one second to three, and 123% from one second to ten.
Rise in bounce probability as mobile load time goes from 1 to 3 seconds
Source: Google/SOASTA Research, 2017e.g. bounce or conversion rates for your traffic channels
Source: linked, checked, datedThe earlier version of that article, excerpted on the AMP Project blog, reported that 53% of mobile site visitors leave a page that takes longer than three seconds to load. Accelerated mobile pages were Google's answer at the time; core web vitals are the measure it uses now.
Google's 2018 update to the same article put the average full load of a mobile ad landing page at about 15 seconds, across 11 million landing pages in 213 countries. Slow loading pages, heavy pop ups and broken links all push visitors out before the 10-second mark, which is what GA4 counts, and a high bounce rate on a slow template often clears up once load speed improves.
Does bounce rate affect SEO
Google says no. John Mueller called it "a bit of misconception" in a June 2020 webmaster hangout that Google looks at analytics bounce rate when ranking sites, as Search Engine Roundtable reported. Gary Illyes wrote that Google doesn't use "*anything* from Google analytics" in its algorithm, and Mueller confirmed in December 2021 that the same holds for GA4.
Chasing bounce rate for rankings is barking up the wrong tree. A high bounce rate and a drop in organic traffic can share a cause: content that misses search intent, a title tag and meta description that promise one thing while the page delivers another, or a slow template.
Fixing the cause can move both numbers, which is why the correlation shows up in studies and the metric still isn't a ranking input. Our Semrush review covers the tools most SEO teams use to diagnose those causes.
How to lower a high bounce rate
Start with segmentation, because a site-wide bounce rate averages pages that have nothing in common, and a high bounce rate on one page can hide behind a fine number for the entire website. Split by landing page, traffic source and device in Google Analytics before changing anything. Keep an eye on the trend, then zero in on the pages with the most sessions and the largest gap against their own history.
The fixes with the most support across the CXL, Semrush and Fullstory guides, from search intent to internal links:
- Match search intent: compare the queries a page ranks for with what the page answers, and rewrite the first screen to answer the main query.
- Improve page load speed: compress images, defer scripts and check core web vitals in Search Console, since the 1-to-3-second window carries a 32% rise in bounce probability.
- Add internal links where the visitor's next question sits, so a visitor who lands on one page has a reason to open a second page; internal links placed above the fold encourage visitors to keep reading.
- Cut intrusive pop ups that fire before the visitor has read anything, especially on mobile devices, where full-screen pop ups cover the entire page.
- Fix broken links and error pages that end sessions on arrival.
- Give each landing page one clear next step: a sign up form, a demo request or contact details placed where the reader finishes.
Behavioral data from session recordings shows why visitors bounce in a way the bounce rate metric can't. Rage clicks, dead clicks and visitors who scroll past the fold and stop all point at user frustration on a specific page, and that user interaction data gives valuable insights the bounce rate metric hides. Lower bounce rates follow when those fixes land. Our Hotjar review and the Google Analytics vs Hotjar comparison cover the two tools most teams pair for this.
Contentsquare's 2026 benchmark puts a number on that approach: frequent users of its monitoring tools saw a 45.4% bounce rate against 49.2% for other teams. Those are its own customers, so the jury's still out on how much of the 3.8-point gap the tools caused. Our product analytics tools ranking compares the wider field.
Conversion rate optimization teams use the same behavioral data, so lower bounce rates and higher conversion rates usually come from the same optimization efforts. Track conversion rates next to bounce rate on your own site, because a page can bounce less and still sell less.
For ecommerce sites, the next metric down the funnel matters more than bounce rate, since conversion rates measure revenue and bounce rate measures attention. Our ecommerce statistics report covers conversion data, our cart abandonment rate report covers the checkout, and the ecommerce analytics ranking compares the tools that track it.
Delivered for your site and your byline. Hosting here is optional.
Frequently asked questions
Is a 42% bounce rate good?
Yes, for most sites, and it isn't a high bounce rate by any published threshold. It sits inside Fullstory's 40% to 55% "average" band, below Databox's 60.15% median and CXL's 57.0% organic search figure. On a checkout or cart page it would still be worth investigating.
Is a 7% bounce rate good?
A 7% bounce rate is almost always a tracking problem. Duplicate GA4 tags or a key event that fires on page load will mark nearly every session as engaged.
Is a 50% bounce rate high?
No. A 50% bounce rate isn't a high bounce rate for most websites; it sits below Databox's 60.15% median and inside the 40% to 55% range most guides call average. For a blog post or a news page it's on the low side; for a landing page built around one sign up action, where conversion rates matter more, it's well within the 60% to 90% range agencies report.
Is 20% bounce rate good?
A 20% bounce rate is at the edge of Fullstory's "suspicious" band. Ecommerce sites with strong returning traffic can reach it, and Similarweb measured 20.5% for TV, movies and streaming sites.
Bottom line
In a nutshell, the average bounce rate depends on who's counting. Databox's 60.15% median, CXL's 57.0% to 75.4% channel range and Similarweb's 30.5% all describe real data, measured with different definitions, samples and statistics.
For GA4 sites in 2026, the channel figures are the most useful benchmark, because they share the 10-second definition and separate traffic that behaves differently.
Compare each landing page against its own history and its own traffic source, use behavioral data and user interaction recordings to find out why visitors leave, read bounce rate next to website performance and marketing performance data, and treat any industry table built before July 2023 as a record of Universal Analytics.
Analytics vendors, CRO agencies and SaaS marketers publish reports like this one as lead magnets and client briefs.
A report on your topic for a blog page, gated content or a lead magnet.
Written for your client and published under their brand, with my name left off.
Your report on marketintelligencetools.com, with 2 to 3 CTAs carrying your sponsored links.
Default terms: the report is yours to publish, and I keep the right to republish it on this site behind a gate, outside Google's index.
Where each bounce rate figure comes from, and the cut nobody publishes
Definitions come from Google Analytics Help and Google's Universal Analytics sunset notice. Channel data is CXL's GA4 benchmark page (modified 11 November 2026, sessions from 1 August to 31 October 2026). Medians are Databox's benchmark page (updated 11 July 2025) and the September 2024 Databox figure quoted in Semrush's guide of 20 January 2026.
Contentsquare figures come from its 2026 Digital Experience Benchmarks pages (Q4 2025 against Q4 2024, 99 billion sessions on 6,500+ websites). Similarweb's figures are from its bounce rate guide (October 2021 data). Load-time figures are Google/SOASTA Research, 2017, and Google's 2018 update, published on Think with Google.
Website-type ranges are Plausible's and Databox's, both of which cite agency studies. Ranking statements are Google's, as reported by Search Engine Roundtable.
All figures were checked on 19 November 2026. None of the publishers cited here releases a GA4 bounce rate by industry with a stated sample size.