Customer experience statistics 2026: ACSI scores, switching, AI service and personalization
 By Jan Suski. I go deep on every review, checking every number against its source and digging up details other coverage misses, a habit from six years of SEO and link building for tech companies. Bylines at Surfer, Brand24, and Senuto. How the scoring works.
The numbers US customer experience, checked 7 October 2026
Satisfaction scores barely move from year to year, while the share of customers who leave after a bad experience runs from 32% to 86% depending on who asks the question.
Gartner's 2026 survey found 91% of service leaders under executive pressure to deploy AI, two years after its 2024 survey found 64% of customers would prefer companies didn't use AI for service.
E-commerce took 17.1% of U.S. retail sales in Q2 2026, so 82.9% of retail sales happened outside e-commerce.
The American Customer Satisfaction Index telecom study of May 2026 scored internet service providers at 73. Its June 2026 restaurant study scored full-service restaurants at 82. The 11 industries in this report span 73 to 83 on ACSI's 100-point scale, with regional and community banks on top.
Customer behavior after a bad experience moves faster than any index. PwC's 2025 Customer Experience Survey found 52% of U.S. consumers stopped buying from a brand after a bad experience, Emplifi put the share who'd leave after two or three poor service experiences at 86%, and Forrester recorded statistically significant losses at 25% of U.S. brands in its 2025 CX Index.
This report names the publisher behind every figure, from ACSI and Forrester to Qualtrics, Gartner, Twilio and the U.S. Census Bureau. It's built for CX teams and analysts who need customer experience statistics a board member can check, linked on first use with the date. The figures matter at budget time, since Antavo found marketers put 51.5% of their marketing budget into loyalty and CRM in 2026.
Statistics on customer experience by industry: ACSI 2026 scores
ACSI publishes customer satisfaction scores for U.S. industries from tens of thousands of surveys a year, and its 2026 studies are the cleanest industry benchmarks for customer experience in the U.S. market. Its statistics reveal a 10-point range from internet service providers at 73 to regional and community banks at 83, with most sectors packed between 76 and 80.
| Industry | ACSI 2026 score | Change | Top-scoring brand | Study and release |
|---|---|---|---|---|
| Regional and community banks | 83 | Stable | Not broken out | Finance Study, 24 Feb 2026 |
| Full-service restaurants | 82 | Unchanged | LongHorn Steakhouse and Texas Roadhouse, 82 | Restaurant Study, 16 Jun 2026 |
| Banks, all | 80 | Unchanged | USAA Bank, 82 (super regional) | Finance Study, 24 Feb 2026 |
| Specialty retailers | 80 | Not listed | Home Depot, Lowe's and Menards, 81 | Retail Study, 27 Jan 2026 |
| Online retailers | 79 | Stable | Amazon, Nordstrom and Chewy, 82 | Retail Study, 27 Jan 2026 |
| Quick-service restaurants | 79 | Unchanged, third year | Jersey Mike's, 84 | Restaurant Study, 16 Jun 2026 |
| Supermarkets | 78 | Down 1% | Trader Joe's, 86 | Retail Study, 27 Jan 2026 |
| Lodging | 77 | Up 1% | Airbnb and Hilton, 79 | Travel Study, 21 Apr 2026 |
| Wireless service | 77 | Up 3%, record high | T-Mobile, 78 | Telecom Study, 19 May 2026 |
| Airlines | 76 | Up 3% | Delta, 79 | Travel Study, 21 Apr 2026 |
| Internet service providers | 73 | Up 1% | AT&T Fiber and Verizon 5G Home Internet, 79 | Telecom Study, 19 May 2026 |
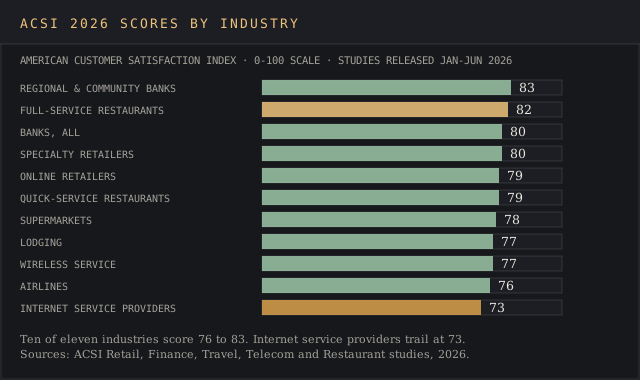
Travel scores rose. Airlines climbed 3% to 76, with Delta on top at 79 and American and JetBlue tied at 78, and lodging rose 1% from 2025 to 77 in 2026.
Full-service restaurants stayed at 82 and quick-service restaurants at 79 for a third straight year, across 16,464 surveys. For the first time in more than a decade a new name leads fast food: newcomer Jersey Mike's debuted at 84, one point above Chick-fil-A at 83.
Finance and telecom split the field. Banks held at 80 while super regional banks fell 3% to 77 and credit unions slipped 1% to 78. Wireless service set a record at 77, and fiber ISPs (76) beat non-fiber ISPs (71) across 26,963 telecom surveys.
ACSI's own commentary credits technology for part of the service quality gain. The finance study said AI-driven modernization is "increasingly reinforcing these digital experience gains across financial services." A score of 80 is par for the course in banking, which leaves super regional banks three points behind the industry at 77.
Customer satisfaction and customer loyalty after a bad experience
A single bad experience costs a large share of customer loyalty, and a second one finishes the job. PwC's 2025 survey of 5,511 U.S. consumers and 406 executives, fielded May and June 2025, found 52% stopped using or buying from a brand because of a bad experience, and 29% stopped after poor customer experience online or in person.
Other publishers measure the same exit with different triggers:
- Zendesk's benchmark data says more than half of consumers switch to a competitor after one bad experience, and 73% switch after multiple bad experiences.
- Emplifi's February 2022 survey of 2,000-plus U.S. and UK consumers put the figure at 86% after two to three bad service experiences, and 49% said they'd walked away from a company they'd shown brand loyalty to within the past 12 months.
- Vonage's Global Customer Engagement Report 2024, from 7,000-plus people in 17 markets, found 74% likely to take their business elsewhere after poor experiences and 46% needing only one or two negative encounters.
Once bitten, twice shy describes customer loyalty after a failure. Zendesk's 2026 CX Trends report, published 18 November 2025 from 11,000-plus consumers and business leaders in 22 countries, found 85% of CX leaders say one unresolved issue is enough to lose a customer.
Experience also drives the purchase before any problem happens. PwC's Experience is everything study of 15,000 people in 12 countries found 73% point to customer experience as an important factor in their purchasing decisions. Ipsos' CX Global Insights 2025 reports that 70% of customers choose brands based on the expectation of a good experience.
Spending follows the same line. Qualtrics XM Institute's 2026 Consumer Experience Trends analysis, released 12 November 2025, found 34% of consumers reduce spending with a company after a negative experience and 13% cut it entirely. It puts sales at risk from poor experiences at $3 trillion worldwide, $973 billion of it in the U.S.
Most unhappy customers leave under the radar. The same Qualtrics study, a Q3 2025 survey of more than 20,000 consumers in 14 countries, found only 29% contacted the company directly after a bad experience, down 7.5 points from 2021, and 30% said nothing at all. Complaints that never arrive fall on deaf ears by default, so teams pull customer insights and customer sentiment from social media, reviews and support logs.
Customer trust and satisfaction are improving overall in that data. Qualtrics reported gains in every industry it measured, strongest in fast food and online retail, where customers can switch easily. Its ROI of Customer Experience, 2024 study of 28,400 consumers ties each star of satisfaction to repeat purchases.
Qualtrics also found 46% of consumers choose companies for value, while those who pick a brand for its customer service report higher satisfaction and trust, the base of lasting customer relationships.
Service quality also commands a price. PwC's 2018 study found customers will pay up to a 16% price premium for a great experience, and Emplifi found 65% of U.S. consumers and 56% of UK consumers willing to pay more for exceptional service. The customer retention statistics report covers what that loyalty is worth over time, including the Bain finding cited by Harvard Business Review in 2014 that a 5% rise in customer retention lifts profits by 25% to 95%.
Why published estimates of customer switching disagree
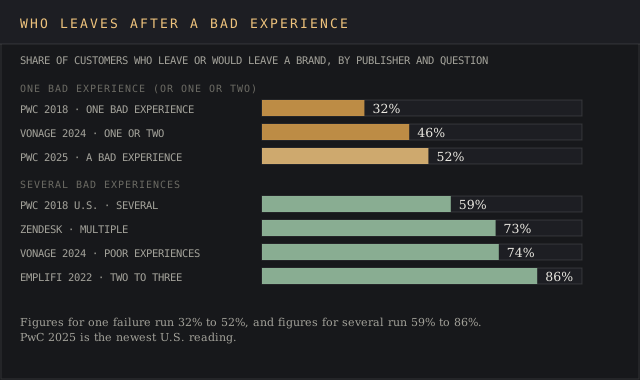
Switching figures run from 32% to 86% because each publisher asks about a different number of bad experiences, in a different year and country. The devil's in the details, since PwC's 2018 figure counts customers leaving a brand they love after one bad experience and Emplifi counts exits after two or three.
| Publisher and year | Question asked | Figure | Sample |
|---|---|---|---|
| PwC, 2018 | Would stop doing business with a brand they loved after one bad experience | 32% | 15,000 people, 12 countries |
| Vonage, 2024 | Need only one or two negative encounters to leave | 46% | 7,000-plus people, 17 markets |
| PwC, 2025 | Stopped using or buying from a brand after a bad experience | 52% | 5,511 U.S. consumers |
| PwC, 2018 (U.S. only) | Would walk away after several bad experiences | 59% | 4,000 U.S. respondents |
| Zendesk benchmark | Switch to a competitor after multiple bad experiences | 73% | Not published |
| Vonage, 2024 | Likely to take their business elsewhere after poor experiences | 74% | 7,000-plus people, 17 markets |
| Emplifi, 2022 | Would leave a brand after two to three bad service experiences | 86% | 2,000-plus U.S. and UK consumers |
Three variables account for most of the gap:
- The count of failures. Figures for one bad experience run 32% to 52%, and figures for several run 59% to 86%.
- Stated intent against reported behavior. PwC's 2025 figure records what consumers say they did, and Emplifi's records what they say they'd do.
- Who's in the sample. PwC 2018 put a significant portion (4,000 of 15,000 respondents) in the U.S., Emplifi polled two countries, and Zendesk doesn't publish its sample.
The fairest single reading for a U.S. business is PwC's 2025 figure, the newest U.S.-only number and one about what customers already did. Quoting Emplifi's 86% without its two-to-three qualifier is a red flag in any business case.
Customer experience management statistics
Forrester's CX Index has tracked falling U.S. CX quality since 2022. Its 2024 US Customer Experience Index, released 17 June 2024 from more than 98,000 U.S. customers rating 223 brands in 13 industries, found 39% of brands declined in CX quality, the third straight year of decline. Average effectiveness fell to 64% and average ease to 66%.
The 2025 round, which Forrester called another all-time low, covered more than 275,000 customers' perceptions of 469 brands across 12 industries and 13 countries, and found 25% of U.S. brands with statistically significant losses and 7% with gains. Europe was the only region where gains beat losses, 7% against 2%.
Few companies run CX as a discipline. Forrester classed only 3% of companies as customer-obsessed in 2024, and those firms reported faster business growth on three measures:
- 41% faster revenue growth
- 49% faster profit growth
- 51% better customer retention
Forrester's 2024 elite tier, the top 5% of brands for exceptional customer experiences, included Chewy.com, Tesla, Zappos.com, USAA and Navy Federal Credit Union.
Qualtrics XM Institute's State of CX Management, 2024 survey of 234 CX practitioners found 71% rate their CX maturity at stage 1 (41%) or stage 2 (30%) of five, and 2% reach stage 5. CX leaders were more likely to describe financial results as better than competitors' (63%, against 40% for laggards), so a mature program shows up in reported business outcomes as a competitive edge.
PwC's 2025 survey found 70% of executives say evolving customer expectations are moving faster than their company can adapt.
Forrester has also priced a single point of CX Index improvement. Its 2024 analysis across 12 industries put the revenue growth from that point at more than $1 billion for a mass-market auto manufacturer and close to $370 million for an auto and home insurer.
Marketing budgets follow loyalty. Antavo's Global Customer Loyalty Report 2026, published 3 February 2026 from 3,000 marketers and 10,000 consumers, found marketers allocate 51.5% of total marketing budget to loyalty and CRM. That puts CX and retention at the center of marketing strategies, and the strategic importance is visible in the spend.
The tools that run this work are priced in our Qualtrics pricing and Medallia pricing reports, and the customer experience intelligence platforms ranking compares ten of them.
Contact center and AI-driven customer service statistics
Gartner's February 2026 survey of 321 customer service and support leaders, run in October 2025, found 91% under pressure from executive leadership to implement AI. The same survey shows how contact center roles are changing:
- 84% intend to add new skills to the agent role and adjust hiring profiles.
- About 80% plan to transition at least some agents into new roles as routine tasks get automated.
- 58% aim to upskill agents into knowledge management specialists.
Gartner's December 2025 release on the same 321 leaders adds that over 80% of organizations expect to reduce contact center agent headcount in the next 18 months.
Kim Hedlin, Director of Research at Gartner, said in the February release that "AI and human expertise must work in tandem," with people supplying "context, empathy, and judgment" on the cases AI escalates. A year earlier, its December 2024 survey of 187 leaders found 85% would explore or pilot customer-facing conversational GenAI in 2025.
The forecast is bigger still. Gartner predicted in March 2025 that agentic AI will autonomously resolve 80% of common customer service issues without human intervention by 2029, cutting operational costs by 30%. The jury's still out on that date, since 5% of the leaders Gartner surveyed in mid-2024 had a customer-facing GenAI voicebot live.
Productivity gains inside a contact center have been measured in the field. The NBER study by Erik Brynjolfsson, Danielle Li and Lindsey Raymond tracked 5,179 customer support agents and found a generative AI assistant raised issues resolved per hour by 14% on average and 34% for novice and low-skilled agents, with minimal impact on the most skilled.
Salesforce's seventh State of Service report, from 6,500 service professionals in 39 countries surveyed April to June 2025, says AI handles 30% of customer service cases today and is expected to handle half by 2027. Its operational efficiency figures show reps using AI spend 20% less time on routine cases, and service teams expect agentic AI to lift upsell revenue by 15%, a revenue generation case for the contact center.
Customers aren't on the same page. Gartner's July 2024 survey of 5,728 customers found 64% would prefer companies didn't use AI for customer service, and 53% would consider switching if a company planned to. Qualtrics found nearly one in five consumers who used AI for customer service saw no benefit, a failure rate almost four times that of AI use in general.
Self-service resolution is still a long shot. Gartner's August 2024 release on the same customer sample found 73% use self-service at some point, and only 14% of issues get fully resolved there. Customers couldn't find relevant content in 43% of failed attempts, so most still end up in a contact center queue.
Contact center complaints repeat across publishers:
- 63% are frustrated by long wait times to speak to an agent, and 48% cite the lack of 24/7 support (Vonage, 2024).
- 74% get frustrated when they have to repeat information, 81% want representatives to pick up where they left off, and 67% expect support tailored to prior customer interactions (Zendesk, 2026 CX Trends).
- 52% expect a reply to a digital service inquiry within one hour, and 22% prefer social media as the service channel (Emplifi, 2022).
- Bad experiences trace to service delivery (46%), communication (45%) and employee interactions (39%), with post-purchase support named in 21% (Qualtrics 2025 Consumer Experience Trends, October 2024).
Social media service is shaping customer perceptions too, since Emplifi found 49% of U.S. and 37% of UK consumers attach high importance to CX on social media. Those numbers describe a contact center whose customer interactions are judged on speed and memory.
A contact center that keeps context across multiple channels removes the repeat-yourself complaint. Contact center software that routes with machine learning or flags churn risk with predictive analytics needs clean customer data from the CRM first.
The call center software pricing report compares 11 contact center rate cards from $15 to $360 per agent, and the chatbot statistics report tracks consumer use of AI chat. Gartner's 80% forecast is easier said than done for contact center leaders, since 61% of them told Gartner in 2024 that their knowledge base articles carry an editing backlog.
Personalized customer experience in consumer surveys
McKinsey's November 2021 personalization research found 71% of consumers expect companies to deliver personalized interactions and 76% get frustrated when it doesn't happen. Faster-growing companies drive 40% more of their revenue from personalization than slower-growing peers, and personalization most often lifts revenue 10% to 15%.
Purchase intent figures sit higher, and talk is cheap in a survey. Epsilon's January 2018 survey of 1,000 consumers aged 18 to 64 found 80% more likely to buy when brands offer personalized experiences and 90% find personalization appealing.
Twilio's 2025 State of Customer Engagement report, from 7,640 consumers and 637 business leaders in 18 countries, gives the newest reading on customer engagement:
- 88% are more likely to buy when customer engagement is personalized in real time, and 44% of brands say they deliver at that level.
- 71% will walk away from purchases if the experience doesn't feel relevant.
- 45% of consumers feel understood by the brands they deal with.
- 75% of businesses see increased customer spend from personalization, and 56% use AI to tailor experiences.
Consumers want experiences built around customer needs, and Qualtrics' 2026 trends data puts the share who want to buy from companies that cater to their individual preferences at 64%, up 2.5 points.
In B2B, Salesforce's seventh State of Sales report, from 4,050 sales professionals in 22 countries, found 67% say personalization matters more to customers than a year earlier. It also found 94% of sales leaders with AI agents call them critical for meeting business demands, so personalization now shapes sales strategies as much as marketing strategies.
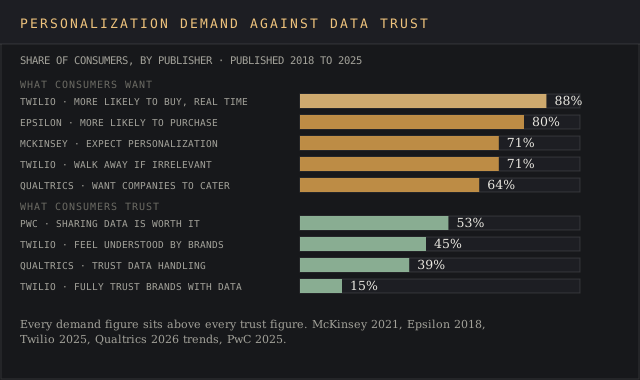
Every demand figure on that chart sits above every trust figure. Tailored interactions need customer data, and customers hand it over on terms. The email marketing statistics report covers how personalization performs in one of the oldest marketing channels.
Data privacy and first party data
Consumers will share personal data for a better experience, on conditions. PwC's 2025 survey found 53% think it's worth sharing personal information for a smoother experience, and 93% say a brand that mishandles it loses their trust, a direct hit to brand reputation. Qualtrics found 46% would share more data with greater transparency about what's collected, and 45% with better control over its use or deletion.
Customer trust in data handling is thin across publishers:
- 39% of consumers trust companies to use personal data responsibly, and 53% name data misuse as their top AI concern, up 8 points (Qualtrics, 2026 trends).
- 61% don't believe brands use their data in their best interest, and 15% fully trust brands with it (Twilio, 2025).
- 71% feel increasingly protective of their personal information, and 64% believe companies are reckless with customer data (Salesforce State of the AI Connected Customer, 16,585 consumers and business buyers).
- 84% want control over their personalization settings (Twilio, 2025).
First party data covers the records a company collects from its own customer interactions, with the customer's knowledge. Data collection that a customer can see and control matches what these surveys ask for, and 72% of customers in the Salesforce study say it's important to know when they're talking to an AI agent.
The customer data platform pricing report covers what it costs to unify first party data across systems, and the customer data intelligence platforms ranking compares ten tools.
Omnichannel customer experience and omnichannel retail statistics
Most U.S. consumer spending at retailers still happens offline. The U.S. Census Bureau's quarterly e-commerce report, released 18 August 2026, put Q2 2026 e-commerce at $340.2 billion, 17.1% of total retail sales, up 12.2% year over year. That leaves 82.9% of retail sales outside e-commerce, most of it in physical stores.
Shoppers who use both channels spend more. ICSC's Halo Effect II study of debit and credit card records, published 23 July 2019, found:
- Omnichannel consumers were 17% of customers and accounted for 34% of total spending.
- A shopper who spent $100 in a store spent an average of $250 within five days and $263 by day 30, counting online purchases.
- After an online-only retailer opened stores, about 60% of later purchases happened in those stores.
That last point hits the nail on the head for digital-first brands. ICSC also found a $100 online purchase followed by a store visit came to $231 within 15 days, so the brand's own website feeds the store too.
Vonage found consumer preferences for service channels split between mobile phone calls (36%), messaging apps (31%) and phone calls through apps (29%), and Zendesk's 2026 CX Trends report found 76% of consumers would choose a company that allows text, voice or visuals in one conversation, a customer engagement format that keeps context in one thread.
Retail customer experience at online retailers and physical stores
ACSI's 2026 retail study, from 31,293 surveys collected through 2025, scored online retailers at 79, general merchandise at 79, specialty retailers at 80 and supermarkets at 78. Trader Joe's led supermarkets at 86, Publix scored 84, and Sam's Club led general merchandise at 83.
For online retailers, ACSI rated mobile app quality (88) and reliability (87) highest. Amazon, Nordstrom and Chewy tied for the online lead at 82. Specialty retailers scored best on pickup ease (87) and fulfillment accuracy (86), which puts online shopping and in-store pickup into the same retail customer experience score.
ACSI described a cost-conscious consumer rewarding retailers that deliver "clear value and a smooth experience online and in store." Qualtrics found 62% of fast food customers reduce or stop spending after a problem.
Loyalty membership is a dime a dozen in retail. Salesforce's sixth Connected Shoppers Report, from 8,350 shoppers and 1,700 retail decision-makers, found 35% of shoppers belong to a loyalty programme they've never used, a figure Salesforce publishes on its UK marketing statistics page.
The retail industry statistics report carries U.S. sales, jobs and price data, the Shopify statistics report sizes one platform behind many online retailers, and the ecommerce analytics tools ranking covers the software that tracks consumer behaviour across channels.
Loyalty programmes in the numbers
Consumers hold more loyalty programmes than they use, and membership counts overstate brand loyalty. The Bond Loyalty Report 2025, published with Visa on 1 August 2025, found consumers take part in 17.4 programmes each on average. Only 48% of Americans and 32% of Canadians give their loyalty programmes the top satisfaction rating, and Bond judges about one-third of programmes to deliver real value.
Bond's 2025 dataset covers 250,000-plus consumers, 395 loyalty programmes and 37 million-plus data points, and it found 69% of customers now encounter a brand's AI in some way.
Loyalty programmes that work earn customer loyalty. Bond's 2024 report found the average person held 19 programmes, 85% were more likely to keep buying from brands with solid loyalty programmes, and 79% were more likely to recommend those brands. Those two figures tie customer satisfaction with a programme to repeat revenue and advocacy, the customer loyalty outcomes CX teams report on.
Brands report strong returns on their own loyalty programmes:
- Average ROI on loyalty programmes of 5.3x, up for a third straight year (Antavo, 2026).
- 92.7% of programme owners report positive returns, and 83.0% are satisfied with performance (Antavo, 2026).
- 59.8% of marketers would shift more money from short-term promotions into loyalty programmes (Antavo, 2026).
- 57% of executives say their loyalty systems aren't delivering the outcomes they need, and 46% expect their current programme to be irrelevant within three years (PwC, 2025).
The two sides don't see eye to eye. Antavo's consumers named savings (70.8%) and promotions (68.6%) as their main motivations, while 31.3% said a quality programme makes them more likely to keep doing business with a brand. Bond's 2025 report says customers now put more weight on experience value, and for the first time in years less on financial value.
The social media statistics report covers platform reach for marketing efforts and content creation aimed at members, and the sales statistics report covers how sales leaders use the same customer relationships data.
CX metrics and key performance indicators
Three survey metrics dominate CX reporting, namely customer satisfaction score (CSAT), net promoter score (NPS) and customer effort score (CES). Each answers a different question about customer interactions, and each has a published formula.
| Metric | Survey question | How it's calculated | Scale |
|---|---|---|---|
| CSAT | How satisfied were you with this interaction? | Positive responses (4 or 5) divided by total responses, times 100 | 1 to 5, reported as 0 to 100% |
| NPS | How likely are you to recommend us to a friend or colleague? | Percentage of promoters (9 to 10) minus percentage of detractors (0 to 6) | 0 to 10, reported as -100 to +100 |
| CES | How easy was it to get your issue resolved? | Average score across responses, or share of easy responses | Set by each survey, common in contact center work |
| Customer lifetime value | None, drawn from billing data | Average revenue per customer times expected customer lifetime | Currency |
The NPS definitions come from Bain's Net Promoter System site, which credits promoters with over 80% of referrals and detractors with over 80% of negative word of mouth. A company with 60% promoters and 15% detractors scores +45.
A customer effort score suits contact center work, where 74% of customers resent repeating themselves (Zendesk). CSAT checks if one transaction met customer needs, and ACSI suits industry benchmarks across years. ACSI scores are index values on a 0-to-100 scale and read differently from a percentage of customers who say they're satisfied.
Data analytics teams usually pair one survey metric with operational key performance indicators such as first-contact resolution, average handle time and churn. Understanding customer behavior across the customer journey takes both kinds of data, so data driven decisions check customer perceptions against cash.
The customer intelligence guide explains how data analytics teams join survey and behavioral data, and the customer journey map template lays out where each metric belongs along the customer journey.
Emerging trends in 2026 CX data
Two market trends stand out across this year's publishers:
- AI in service is spreading faster than customers accept it. Leaders face 91% executive pressure (Gartner), while 50% of consumers worry AI will block them from a human (Qualtrics).
- Disclosure is joining the customer expectations brands must meet. 95% of consumers expect clear explanations for AI-made decisions, and 80% of CX leaders say transparency will soon be required for customer-facing AI (Zendesk).
Contact center staffing is changing with it. Gartner's over-80% headcount expectation and Salesforce's 81% of reps who say their role has become more specialized point in the same direction, with automation technologies taking routine cases for operational efficiency and people taking the rest. Companies jumping on the bandwagon without fixing self-service content start from Gartner's 14% resolution rate.
Frequently asked questions
What are some key statistics about customer experience?
ACSI's 2026 scores run from 73 for internet service providers to 82 for full-service restaurants, PwC found 52% of U.S. consumers stopped buying after a bad experience, and Forrester recorded CX losses at 25% of U.S. brands in 2025.
What percent of unhappy customers don't complain?
Qualtrics XM Institute's Q3 2025 survey found 30% of consumers say nothing at all after a bad experience, up 9 points since 2021, and only 29% contact the company directly. Qualtrics says that silence makes indirect feedback from social media and reviews more valuable.
What percent of customers prefer brands that personalize their experience?
Customer preferences differ by survey wording. Epsilon found 80% of consumers more likely to buy from brands offering personalized experiences, Qualtrics found 64% want companies that cater to them, and McKinsey found 71% expect personalized interactions.
How does personalization improve customer experience?
McKinsey found personalization most often lifts revenue by 10% to 15%, and 78% of consumers said personalized content made them more likely to repurchase. Twilio found 75% of businesses see higher customer spend from personalization.
What are the 5 key CX metrics?
The five most common are customer satisfaction score (CSAT), net promoter score (NPS), customer effort score (CES), churn or customer retention rate, and customer lifetime value.
How many customer service cases does AI resolve in the contact center?
Salesforce's 2025 State of Service report says AI handles 30% of customer service cases today and should handle half by 2027. Gartner found only 14% of issues get fully resolved in self-service, so most contact center volume still needs an agent or a second channel.
Is 90% customer satisfaction good?
A 90% CSAT means nine in ten respondents picked a positive rating. Industry scores in this report top out at 83 on ACSI's 100-point scale, for regional and community banks, so 90% on a CSAT question is a strong result in most industries.
How do you calculate customer experience?
In a nutshell, teams combine CSAT (positive responses divided by total responses), NPS (promoters minus detractors) and CES with behavior data such as repeat purchases and churn. Tracking all of them over time shows which change moved revenue.
Bottom line
Industry satisfaction moves a point or two a year. ACSI's 2026 scores sit between 73 and 83, Forrester's index set another all-time low in 2025, and airlines and wireless service posted the biggest gains at 3% each.
Customer behavior moves much faster. Between 32% and 86% of customers leave after bad experiences depending on each survey's wording, and PwC's 52% is the cleanest U.S. reading. AI is entering the contact center under 91% executive pressure while 64% of customers say they'd prefer it didn't.
The numbers tie business growth to companies that measure one thing well and fix what customers report, from a contact center that remembers context to customer relationships built on loyalty programmes members use.
The indexes, surveys and studies behind each CX figure, and the releases still to come
Satisfaction indexes: theacsi.com (Retail Study, 27 January 2026; Finance Study, 24 February 2026; Travel Study, 21 April 2026; Telecommunications Study, 19 May 2026; Restaurant Study, 16 June 2026) and forrester.com (US Customer Experience Index, 17 June 2024; CX Index 2025 results; 2024 revenue analysis).
Consumer and executive surveys: pwc.com (2025 Customer Experience Survey; Experience is everything, 2018), qualtrics.com and xminstitute.com (Consumer Experience Trends releases of October 2024 and 12 November 2025; ROI of Customer Experience 2024; State of CX Management 2024), zendesk.com (CX Trends 2026, 18 November 2025), twilio.com (State of Customer Engagement, 3 June 2025).
Other surveys and studies: emplifi.io (2 February 2022), vonage.com (Global Customer Engagement Report 2024), ipsos.com (CX Global Insights 2025), mckinsey.com (November 2021), epsilon.com (January 2018) and hbr.org (October 2014).
Contact centers, sales and service: gartner.com (releases of 9 July, 19 August and 9 December 2024, 5 March and 17 December 2025, and 18 February 2026), salesforce.com (State of Service 2025, State of Sales 2026, State of the AI Connected Customer and the UK marketing statistics page) and nber.org (working paper 31161, 2023).
Retail and loyalty: census.gov (Quarterly Retail E-Commerce Sales, 18 August 2026), icsc.com (Halo Effect II, 23 July 2019), bondbl.com and info.bondbrandloyalty.com (Bond Loyalty Report 2025, 1 August 2025, and the 2024 report), antavo.com (Global Customer Loyalty Report 2026, 3 February 2026) and netpromotersystem.com.
Every figure was checked against its source on 7 October 2026. Each publisher words its "bad experience" question differently, so the switching figures on this page compare seven differently built surveys, and ACSI's next industry studies arrive through 2027.