Customer service statistics 2026: 2.67M reps, AI agents at 66%, ACSI at 76.7
 By Jan Suski. I go deep on every review, checking every number against its source and digging up details other coverage misses, a habit from six years of SEO and link building for tech companies. Bylines at Surfer, Brand24, and Senuto. How the scoring works.
The numbers US and global customer service, checked 15 October 2026
AI budgets are growing 19 times faster than the service budgets that contain them, so each new bot dollar comes out of another line, usually headcount plans.
Self-service fully resolves one issue in seven, which is why 2.67 million human reps still answer the phone.
An index stuck near 77 while complaints set records says the new tooling hasn't reached the customer experience yet.
I'll write a 2,500+ word report on the service data you name, from BLS jobs to AI agent adoption, every figure linked to its source. Yours to publish, from $200.
The United States employed 2,666,000 customer service representatives in 2025 at a median wage of $21.53 an hour, and the Bureau of Labor Statistics projects that headcount falls 5% by 2035. Over the same stretch, 66% of service organizations told Salesforce they run agentic AI, up from 39% a year earlier.
Customer satisfaction hasn't moved with the tooling. The national ACSI score sat at 76.7 out of 100 in early 2026, while complaints hit a record.
This report collects the latest customer service statistics from the bodies that measured them: BLS for the workforce, ACSI & Forrester for satisfaction, Gartner, Salesforce, HubSpot and Zendesk for AI and operations, Qualtrics XM Institute and PwC for the cost of poor customer service. Every figure carries its publisher and fieldwork date, because two houses asking the same question routinely return numbers 50 points apart.
It's written for support leaders budgeting headcount, customer service teams setting targets and analysts sizing the customer service industry. For broader customer experience statistics on loyalty programs, retail CX and ACSI by industry, see our companion report; this page stays on the service function: the people, the queues, the bots and what they cost.
Customer service industry statistics: jobs, pay and the 2035 outlook
BLS counts 2,666,000 customer service representative jobs in 2025, paying a median $44,770 a year. The bottom tenth earned under $15.27 an hour and the top tenth over $30.57.
The occupation still generates about 289,500 openings a year. With total employment projected to shrink by 141,800 jobs over the decade, those openings replace people who stop providing customer service, through quits or retirement.
Retail trade employs the lion's share of reps at 15%, followed by insurance carriers at 12% and business support services, the outsourced call center sector, at 8%. Pay tracks the industry more closely than the title.
| Industry | Share of representative jobs | Median hourly wage, May 2025 |
|---|---|---|
| Retail trade | 15% | $17.96 |
| Insurance carriers and related activities | 12% | $22.47 |
| Business support services | 8% | $17.68 |
| Professional, scientific and technical services | 7% | $21.77 |
| Wholesale trade | 6% | $23.41 |
| All customer service representatives | 100% | $21.53 |
Copy these lines into an email, fill them in and send. I reply with scope and a price within 2 to 3 business days.
Open the email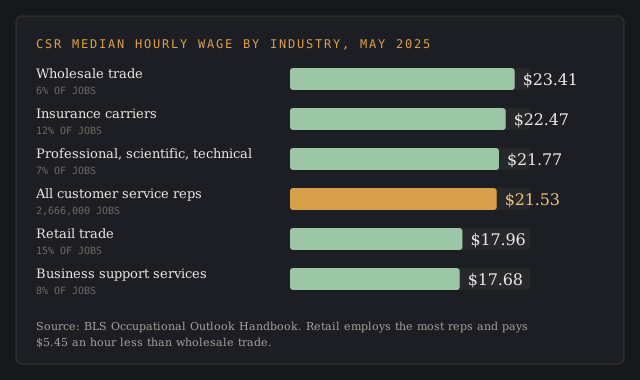
At full-time hours, that gap comes to about $11,300 a year.
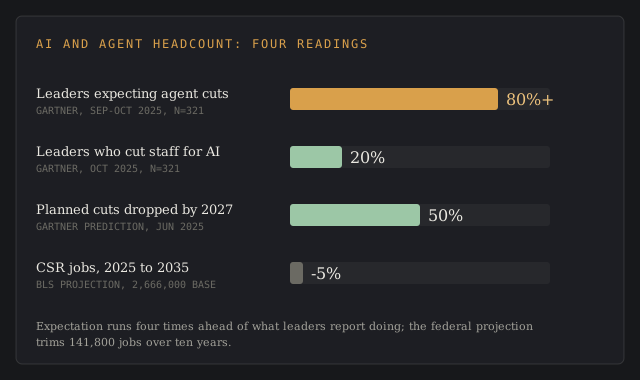
The federal projection is a drop in the bucket next to what managers say they plan. A 5% decline over ten years sits against the 80%-plus of leaders who told Gartner they expect agent headcount cuts within 18 months.
Customer satisfaction statistics: ACSI, Forrester and complaint counts
The national ACSI fell 0.3% to 76.7 in Q1 2026, and complaints rose 16% in that quarter to a record level. ACSI's Q2 2026 release of 11 August reported a further sharp decline, one ACSI said was exceeded only once this century, during the COVID-19 pandemic. The index draws on about 200,000 interviews a year across 400-plus companies in 40-plus industries.
Forrester's 2026 Customer Experience Index reads the other way. Across more than 224,000 customers and 462 brands, Forrester found 26% of North American brands improved by a statistically significant margin and 7% declined.
That rebound follows a low point. Forrester's 2024 US Customer Experience Index put US quality at an all-time low after a third straight annual decline, with 39% of brands slipping.
The two series are CX customer service statistics built on different questions. ACSI measures satisfaction with purchases across the economy every quarter; Forrester scores brand-level experience quality once a year, so the two can move in opposite directions in the same year. Reading between the lines, complaint volume is the number they don't share, and ACSI's record count says service is falling short of customer expectations.
Customer expectations run ahead of delivery, and anger is par for the course. The National Customer Rage Survey, run by Customer Care Measurement & Consulting with Arizona State University's W. P. Carey School of Business, found 74% of customers had a product or service problem in the past year and 63% felt rage over it.
Angry customers have moved their complaints online, where little stays under the radar. In the same survey, 32% of complainants posted about their most serious problem on social media, more than double the 2020 share.
Poor customer service statistics: spending at risk and switching
Poor customer service and every other bad experience put $2.94 trillion of 2026 global sales at risk, per Qualtrics XM Institute, from a Q3 2025 survey of 20,000-plus consumers in 14 countries published 12 November 2025. Consumers rated 11% of their experiences bad, and 47% cut spending after one, down 8 points on the prior year.
The split matters for anyone modelling churn from customer experience data. $2.1 trillion of the total is spending consumers cut back and $865 billion is spending they stop entirely. The US carries the biggest exposure at $973 billion; Mexico has the highest rate at 8% of sales, Japan the lowest at 2%.
Switching data comes from other houses. PwC's 2025 Customer Experience Survey of 5,511 US consumers, fielded 21 May to 30 June 2025, found 52% had stopped buying from a brand after a bad product or service experience, and 29% had left after a negative customer experience online or in person.
One negative customer service experience is enough for a third of buyers. PwC's 2018 Future of Customer Experience survey of 15,000 consumers in 12 countries found even loyal customers leave: 32% would walk away from a brand they love after a single bad experience.
Customers are once bitten, twice shy, and repeat failures finish the job. Zendesk's benchmark data, cited on its customer service statistics page, puts the share who switch to a competitor after multiple bad experiences at 73%. The jump from 32% after one poor customer service experience to 73% after several is the window a recovery team works in.
Why published customer service statistics disagree
Most contradictory customer service statistics trace to five disagreements, and the gaps are wide enough to flip a budget decision. Two analysts quoting different houses won't be on the same page until the definitions match.
| Question | Lower reading | Higher reading | What separates them |
|---|---|---|---|
| Sales at risk from bad experiences | $2.94T (Qualtrics, Nov 2025) | $3.7T (Qualtrics, Feb 2024) | 14 countries against 26 |
| Service work resolved without a human | 14% (Gartner customers) | 83% (Freshdesk deflection) | Fully resolved against deflected |
| AI-driven agent cuts | 20% made (Gartner) | 80%+ expected (Gartner) | Action against intent |
| Switching after bad experiences | 32% (PwC 2018) | 73% (Zendesk) | One incident against several |
| Customers on AI in service | 64% prefer none (Gartner) | 73% fine with chatbots (Qualtrics) | All service against simple tasks |
Cost of poor customer experiences: $3.7 trillion or $2.94 trillion
Both figures come from Qualtrics XM Institute. The $3.7 trillion estimate, published February 2024, came from 28,400 consumers in 26 countries surveyed in Q3 2023, and Qualtrics said it was up about $600 billion, or 19%, on the year before.
The 2026 edition covers 14 countries representing 57% of global household consumption. Its lower total reflects that smaller country set alongside the 8-point fall in consumers cutting spending. Roundups quoting "$3.8 trillion" as the cost of a single interaction mangle both editions.
How much service work AI resolves: 14%, 30% or 83%
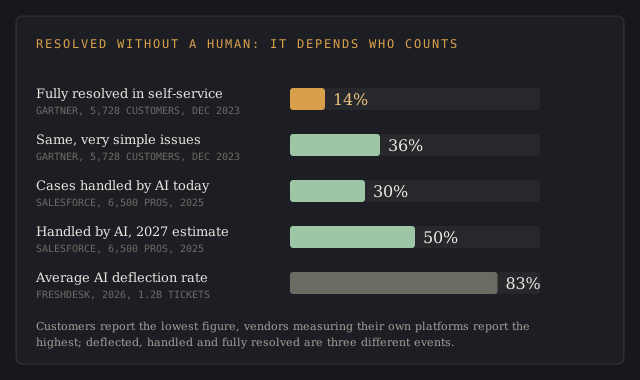
Gartner's December 2023 survey of 5,728 customers found 14% of service issues fully resolved in self-service, and 36% for the issues customers rated simplest. Salesforce's 2025 State of Service survey of 6,500 service staff and decision makers estimated AI handles 30% of cases today and will handle 50% by 2027.
Freshdesk's 2026 benchmark, drawn from 33,000-plus customer accounts and 1.2 billion tickets on its own platform, reports an 83% average AI agent deflection rate. A deflected ticket never reached a human, so a customer who gives up and phones later counts as a deflection in platform data and as a failure in Gartner's survey.
Want a resolution-gap chart like this for the claims in your category? Send the metric.
Email a briefAI and headcount: cuts expected, cuts made
Gartner surveyed 321 heads of service and support in late 2025 and published two readings from that fieldwork. Over 80% expect to reduce agent headcount in the next 18 months, and only 20% have reduced staffing because of AI so far; 55% reported stable staffing while handling higher volumes.
Gartner's own forecast sides with the 20%. By 2027, half of organizations that planned major AI-driven workforce cuts will abandon them, per its June 2025 prediction; 95% of the 163 leaders behind it planned to keep human agents.
Switching after a bad experience: 32% to 73%
The spread comes from how many bad experiences the question allows. PwC's 32% counts one, Zendesk's 73% counts several, and PwC's 2025 figure of 52% counts any brand ever dropped. Gartner's 53% is a different trigger: customers who'd consider switching if a company planned to use AI for customer service.
Attitudes to AI split the same way. Gartner found 64% of customers would prefer companies didn't use AI in service, while Qualtrics's 2024 study found 73% comfortable with chatbots for simple tasks and 81% wanting a human for medical advice. The task decides the answer.
AI agents in customer service: adoption, spending and results
What service teams report
AI adoption is where customer service statistics move fastest. Salesforce's State of Service: AI Agents Edition surveyed 3,075 customer service professionals between 9 March and 4 April 2026. Its adoption numbers:
- 66% of service organizations use agentic AI, up from 39% in 2025
- 85% use at least one form of AI
- 70% of teams using them report measurable value within 60 days of deployment
- 77% deploy AI agents in both customer-facing and internal work
- 89% of staff using them want their use expanded
Customer satisfaction was the KPI respondents most often said had improved after deploying AI agents, ahead of rep productivity, average handle time, customer retention and first-response time. Salesforce's release gives that ranking without a percentage.
Money is following. Gartner's survey of 199 service and support leaders in April and May 2026 found AI spending up 38% while total service budgets grew 2%. In February 2026, 91% of 321 leaders reported executive pressure to implement AI. Freshdesk's benchmark found 44% of teams use AI across operations, up from 32% a year earlier, and 70% say its biggest impact is automating repetitive queries.
Gartner's March 2025 prediction goes further: agentic AI will autonomously resolve 80% of common customer service issues by 2029, cutting operational costs by 30%. The jury's still out, and the 14% self-service resolution rate is the baseline it has to climb from.
In Salesforce's 2025 sample, reps using AI spent 20% less time on routine cases, about four hours a week freed from low value tasks, and AI climbed from tenth to second on leaders' priority lists in a year. 51% of service leaders said security concerns had delayed or limited their AI projects.
Forecasts have overshot before. HubSpot's 2024 State of Service, 1,537 customer experience leaders surveyed in March 2024, had 77% expecting AI to handle most ticket resolutions by 2025. Salesforce's 30% estimate for 2025 shows that forecast missed the mark.
What customers report about AI in service
Qualtrics's October 2025 study found nearly 1 in 5 consumers who used AI for customer service got no benefit, a failure rate almost four times that of AI use in general. 50% worry AI will keep them from reaching a human.
Human contact still shapes the customer service experience in the US. PwC's 2025 survey found 86% of consumers rate human interaction as important to their brand experience; 49% would use AI to track an order and 29% to make a payment.
Transparency is the condition customers attach. Salesforce's 2026 State of the AI Connected Customer, 16,585 respondents, found 72% want to know when they're talking to an AI agent. Zendesk's Customer Experience Trends 2026 put the share expecting clear explanations of AI decisions at 95%. Consumer chatbot usage is tracked separately in our chatbot statistics.
Self service channels, cost per contact and phone support
The customer service statistics on cost per contact date from 2019. Gartner's poll of service leaders that year priced a live contact by phone, chat or email at $8.01 on average, against $0.10 for a contact handled on a company website or app. That 80-to-1 gap is the business case for help centers, customer portals and bots.
Customers expect self service and use it. 73% try self service at some point in the customer journey, per Gartner's 2023 survey, and HubSpot's 2024 report found 78% prefer self service options when they're offered.
Finishing there is the problem. In 43% of failed attempts, customers couldn't find content relevant to their issue, and 45% who started in self-service said the company didn't understand what they were trying to do, which sends them back to square one on the phone. Building a help center that answers the question is easier said than done.
In a modern customer service operation, phone support absorbs what self service channels drop. Verint's survey of 1,000 contact center agents found agents spend an average of three minutes searching for answers in 45% of calls, and 49% already work across several channels. Per-agent costs for that phone and omnichannel stack sit in our call center software pricing report, which lists 11 published rate cards.
Working automation shortens each customer interaction. Freshdesk's 2026 benchmark data shows average resolution time falling from 9 minutes 21 seconds at support teams with 0 to 25% AI agent adoption to 4 minutes 36 seconds at 50 to 100%. Average response time drops from 11 minutes 16 seconds to 7 minutes 28 seconds as AI copilot adoption rises across the same bands.
Customer expectations: speed, customer context and personalization
Speed is the first test of good customer service. HubSpot's 2024 report found 82% of customers expect immediate problem resolution, and 68% of CRM leaders said their customers expect a fix within three hours. How customers define immediate service varies by survey and by channel.
Customers expect context too. Zendesk's CX Trends 2026, covering 11,000-plus consumers and business leaders in 22 countries, found 81% of consumers want reps to pick up where they left off, 74% get frustrated repeating information, and 67% expect support tailored to prior interactions.
Reciting an account number to a third agent is the customer frustration those numbers describe, and 76% of consumers in the same report would choose a company that lets them mix text, voice and visuals in one conversation.
Customers expect personalization at rates between 71% and 78%, depending on the house. McKinsey's November 2021 research found 71% expect personalized interactions and 76% get frustrated when they don't get them; HubSpot's 2024 survey put the share wanting more personalization than before at 78%.
Salesforce's fifth State of the Connected Customer report, published May 2022 from 13,020 consumers and 3,916 business buyers, found 73% expect companies to understand their unique needs and 88% rate the customer experience a company provides as important as its products. Consumers expect companies to treat a service call as part of the product.
Tailoring still wins on the consumer side. Qualtrics's 2025 study found 64% want companies that tailor experiences to them, up 2.5 points in a year, even as 32% are uncomfortable with every form of personalization.
Customer data and privacy in service interactions
Customer service statistics on privacy come from consumer surveys, and they point one way. Personalized service runs on customer data from every step of the customer journey, and customers are guarding it. Salesforce's 2026 report found 71% increasingly protective of personal information and 64% who believe companies are reckless with customer data.
Automation adds to the worry. Qualtrics found 53% fear misuse of personal data when companies automate interactions, up 8 points in a year, and 39% trust companies to use it responsibly.
On the operator side, 35% of customer experience leaders in HubSpot's 2024 survey said their data was fully integrated with their tools, and teams with unified data were 225% more likely to say customers get a personalized experience. Zendesk found 82% of leaders say promptable analytics turn ticket data into valuable insights in seconds that once took weeks.
Customer service agents: attrition, workload and new roles
Agents plan to leave faster than AI is replacing them. Verint's State of Agent Experience 2026, which surveyed 1,000 agents at contact centers with 300-plus seats between 18 November and 9 December 2025, found 31% likely to leave within six months. Nine in ten said schedule flexibility matters when choosing a job.
Volume keeps climbing. 75% of CX leaders in HubSpot's 2024 survey said ticket numbers had risen, and 55% of organizations in Gartner's survey handled higher volumes on flat staffing. Customer service teams carry that gap today, and support teams in retail do it on a $17.96 median hourly wage. Customer service strategies that bank on AI cutting headcount also have to bite the bullet on that 31% quit intent.
The job description is being rewritten:
- 94% of agents expect AI to change their roles within three years, and 61% expect more complex, technical work (Verint)
- 84% of customer service leaders plan to add new skills to the agent role; 58% aim to upskill agents into knowledge management specialists (Gartner, February 2026)
- Nearly 80% of organizations plan to move at least some agents into new roles (Gartner)
- 42% are hiring specialized roles such as AI strategists and conversational AI designers (Gartner, December 2025)
- 86% of service reps report developing new skills and 81% say their role has become more specialized (Salesforce, 2025)
Customer service agents who stay through that shift end up with fewer routine tickets and harder ones: Salesforce found reps with agentic AI spend a quarter of their week on highly complex issues.
The revenue case for great customer service
Forrester's 2024 CX Index release reported that customer obsessed organizations grew revenue 41% faster and profit 49% faster than non-customer-obsessed organizations, with 51% better customer retention, its measure of improved customer loyalty.
Great customer service shows up in revenue at company level too. Bain & Company's 2015 analysis by Frédéric Debruyne and Andreas Dullweber found companies that excel at customer experience grow revenues 4% to 8% above their market.
Buyers say they'll pay for great customer service. PwC's 2018 survey found consumers willing to pay up to 16% more for a better experience, and 73% named a positive customer experience a main factor in their customer loyalty.
Responsiveness is what a positive customer service experience means in practice, and it feeds repeat purchases. Zendesk's 2026 report found 86% of consumers say responsiveness and accuracy strongly influence purchasing decisions, and Freshdesk's 2026 customer experience benchmark found 53% of companies call service decisive in winning customers from competitors, with 42% saying it shapes renewals. Retention math by industry sits in our customer retention statistics.
Spending on the tooling follows the argument. Grand View Research sized the customer experience management market at $12.04 billion in 2023, forecasting $32.87 billion by 2030 at 15.4% a year. Platforms in that market, such as Medallia, sell the measurement layer.
A good customer service experience is cheapest where it protects existing customers. Acquiring a new customer costs five to 25 times more than retaining one, per a 2014 Harvard Business Review article by Amy Gallo, so service quality shows up first in renewal rates.
Every loyalty figure above is self-reported by the company or the customer, and talk is cheap. Customer service teams that offer excellent customer service and report improved customer loyalty should show it in repeat purchases and renewals, the two numbers a survey can't inflate.
Customer service metrics teams track
Excellent customer service is defined differently in each dashboard, and so is service quality. CSAT and retention tie as the most tracked measures, each named by 31% of CRM leaders in HubSpot's 2024 report, followed by response time at 29% and resolution time and customer lifetime value at 26% each.
| Metric | What it counts | Published benchmark |
|---|---|---|
| Customer satisfaction score (CSAT) | Share of surveyed customers rating an interaction satisfied | Tracked by 31% of CRM leaders (HubSpot, 2024) |
| ACSI score | National satisfaction index, 0 to 100 | 76.7 in Q1 2026 (ACSI) |
| First contact resolution | Issues solved on the first contact | 85% of CX leaders say customers drop brands that miss it (Zendesk, 2026) |
| Average resolution time | Time from ticket open to close | 4 min 36 s to 9 min 21 s by AI agent adoption (Freshdesk, 2026) |
| Average response time | Time to reply | 7 min 28 s to 11 min 16 s by copilot adoption (Freshdesk, 2026) |
| Self-service resolution rate | Issues fully solved without an agent | 14% (Gartner, 2024) |
| Agent attrition intent | Agents likely to quit within six months | 31% (Verint, 2026) |
- The channel, industry or service metric to cover
- Regions, years and segments
- Where it runs: blog, white-label, gated or lead magnet
- Whose byline goes on it
- Deadline
- 2,500+ words, human-written
- Every figure linked to its source
- Yours to publish, under your name or none
- Hosting here for +$200, with your sponsored links
First contact resolution is missing from HubSpot's top five, yet Zendesk's leaders rank it as a reason customers leave. That mismatch is a red flag for any dashboard built from one survey. Support teams collecting customer satisfaction scores and customer feedback at volume can compare tools in our ranking of customer satisfaction survey software.
Widely repeated customer service statistics traced to their origin
Several numbers on most top-100 lists don't survive a trace to a dated study. The measured figure behind each:
- "96% of unhappy customers don't complain": Qualtrics found 30% of consumers say nothing after a negative customer experience, up 9 points since 2021, and 29% tell the company directly.
- "A single poor interaction risks $3.8 trillion": Qualtrics sizes annual sales at risk across all bad experiences, $3.7 trillion in its 2024 edition and $2.94 trillion for 2026.
- "Personalization lifts retention 51%": the 51% is Forrester's retention gap between customer-obsessed organizations and the rest, a measure of strategy, with personalization nowhere in it.
- "AI will power most customer interactions by 2026": HubSpot's 2024 respondents expected most ticket resolutions by 2025; Salesforce's 2025 estimate is 30% of cases, rising to 50% by 2027.
- "It takes 12 positive experiences to make up for one negative" and "68% will pay more for good customer service": neither carries a study name, sample size or fieldwork year. PwC's measured premium is up to 16%.
The devil's in the details: most important customer service statistics in roundups are real numbers with the denominator stripped off.
Delivered for your site and your byline. Hosting here is optional.
Frequently asked questions
Is AI taking over customer service jobs?
Slower than leaders predicted. Gartner found 20% of service leaders have cut agent staffing because of AI, against 80%-plus who expect cuts within 18 months, and BLS projects a 5% decline in representative jobs from 2025 to 2035.
Are customer service jobs in demand?
Yes, through replacement hiring. BLS projects about 289,500 openings a year for customer service representatives even as total employment falls by 141,800 by 2035.
What is the average customer satisfaction rate?
The national ACSI score was 76.7 out of 100 in Q1 2026. ACSI's Q2 release reported a further sharp decline.
What percent of unhappy customers do not complain?
Qualtrics measured 30% of consumers saying nothing after a bad experience in its 2025 study, with 29% telling the company directly.
What percentage of consumers begin doing business with a competitor after poor customer experience?
32% after one bad experience in PwC's 2018 survey, 73% after multiple bad experiences in Zendesk's benchmark data, and 52% who have ever dropped a brand over one in PwC's 2025 survey.
What are the 5 key performance indicators for customer service?
HubSpot's 2024 survey ranks CSAT (31%), retention (31%), response time (29%), resolution time (26%) and customer lifetime value (26%) as the most tracked customer service metrics.
Is 90% customer satisfaction good?
On ACSI's 100-point scale, where the national average was 76.7 in Q1 2026, a score of 90 would sit 13.3 points above the economy. A 90% CSAT is a different measure, the share of respondents choosing a satisfied rating, and should be compared against your own trend line.
What are the most important customer service statistics for 2026?
Four figures frame the year: 2,666,000 US rep jobs (BLS), a national ACSI score of 76.7 (ACSI), 66% of service organizations on agentic AI (Salesforce) and 14% of issues fully resolved in self-service (Gartner).
What are the current customer service trends?
Agentic AI adoption rose from 39% to 66% of service organizations between 2025 and 2026 (Salesforce), AI spending grew 38% against 2% budget growth (Gartner), and complaints hit a record in Q1 2026 (ACSI).
Bottom line
The customer service function in 2026 is spending on AI at 19 times the rate of its budget, while its customers rate satisfaction at 76.7 and file record complaints. Self-service still fully resolves one issue in seven, so the 2.67 million reps BLS counts still carry the work bots and help centers drop.
Treat every headline figure as a pairing of publisher and definition. A deflection rate, a handled-case share and a resolution rate are three numbers describing one customer experience, and a sales-at-risk total changes with the country list. The houses agree on direction: more automation, higher customer expectations, thinner staffing. Customer service strategies built on one house's number inherit that house's definition.
Plan exceptional customer service against the measured service statistics: wages and openings from BLS, complaint counts from ACSI, customer-reported resolution from Gartner. Vendor platform data belongs in the same file under its own label, because customer relationships are scored by customers.
Help desk vendors, BPO firms and CX consultancies use reports like this one in sales decks and client briefs.
A report on your topic for a blog page, gated content or a lead magnet.
Written for your client and published under their brand, with my name left off.
Your report on marketintelligencetools.com, with 2 to 3 CTAs carrying your sponsored links.
Default terms: the report is yours to publish, and I keep the right to republish it on this site behind a gate, outside Google's index.
Where each customer service figure comes from, and the gaps in the published record
Workforce and pay: bls.gov (Occupational Outlook Handbook and May 2025 wage data for customer service representatives).
Satisfaction and complaints: theacsi.com (Q1 2026 release of 12 May 2026; Q2 2026 release of 11 August 2026), forrester.com (2024 US Customer Experience Index; 2026 CX Index results) and wpcarey.asu.edu (National Customer Rage Survey, March 2023).
Gartner: gartner.com releases of 25 September 2019, 9 July and 19 August 2024, 5 March, 10 June, 2 December and 17 December 2025, and 18 February and 26 August 2026.
AI, operations and agents: salesforce.com (State of the Connected Customer, May 2022; State of Service 2025; State of Service: AI Agents Edition, May 2026; State of the AI Connected Customer), hubspot.com (State of Service 2024), zendesk.com (CX Trends 2026), freshworks.com (2026 CX benchmark) and verint.com (State of Agent Experience 2026).
Cost of bad experiences and loyalty: qualtrics.com (releases of February 2024, October 2025 and 12 November 2025), pwc.com (2018 Future of Customer Experience survey; 2025 Customer Experience Survey), mckinsey.com (November 2021), bain.com (2015), hbr.org (October 2014) and prnewswire.co.uk (Grand View Research market sizing, 2023).
Figures were checked against each source on 15 October 2026. Gartner's 2019 poll is the newest cost-per-contact source among these publishers, so the $8.01 and $0.10 figures carry a 2019 date.