Market research statistics for 2026: industry size, spend, methods, AI use and jobs
 By Jan Suski. I go deep on every review, checking every number against its source and digging up details other coverage misses, a habit from six years of SEO and link building for tech companies. Bylines at Surfer, Brand24, and Senuto. How the scoring works.
The numbers Global insights industry, checked 15 October 2026
Software now earns more than classic market research: $62 billion against $56 billion in ESOMAR's 2024 count.
The U.S. market grew 7.8% in 2025, well ahead of the 4.8% ESOMAR measured for the global market research sector a year earlier.
AI has reached the working researcher: 53% use it regularly and nearly nine in ten have tried it, per Qualtrics.
The global insights industry turned over $153 billion in 2024, according to ESOMAR's Global Market Research 2025 report (4 November 2025). Only $56 billion of that came from market research in the classic sense. Research software brought in $62 billion and grew 11.5%, more than twice as fast as the 4.8% posted by agencies and fieldwork houses.
That split explains why published figures on market research disagree so often. The Insights Association puts the U.S. alone at $89.3 billion for 2025, while The Business Research Company sizes the whole world's market research services at $93.37 billion. This page names the boundary next to every number.
The report covers market size, growth rate, the market share of the largest market research firms, research methods, AI adoption among market researchers, consumer research habits and the analyst workforce tracked by the Bureau of Labor Statistics. It's for teams who conduct market research, track market trends and need a source line that holds up in a deck. Project pricing lives in our separate market research cost report.
Market research industry size in 2024 and 2025
ESOMAR's annual Global Market Research report is the closest thing the industry has to a census of market research companies. Its 2025 edition says the insights industry passed $150 billion in 2024 and expects it to pass $160 billion by the end of 2025. ESOMAR splits that total into three sectors, each with its own market dynamics:
- Market research: $56 billion, growth rate 4.8%
- Research software: $62 billion, growth rate 11.5%
- Reporting: $35 billion, growth rate 8%
Inside the $56 billion market research sector, about 62% comes from full-service research and fieldwork, about 31% from subscriptions and research software sold by market research companies, and about 7% from consultancy.
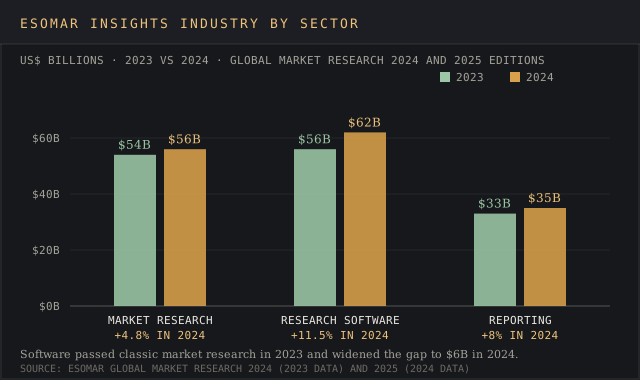
A year earlier the picture was closer. ESOMAR's Global Market Research 2024 (20 November 2024) put 2023 at $54 billion for market research, $56 billion for software and $33 billion for reporting. Software grew 12.4% that year, market research 4.6%. ESOMAR tied the slowdown to high interest rates after post-pandemic inflation; research budgets move with market conditions.
The Insights Association's 2026 State of U.S. Insights & Analytics Report measured $89.3 billion of U.S. revenue in 2025 and 7.8% growth. Growth has landed between 7.5% and 8.0% for three straight years, DRNO reported. Digital data analytics is the largest segment at 37% of revenue, and technology-enabled research (ResTech) is nearly half.
Why market research size estimates disagree
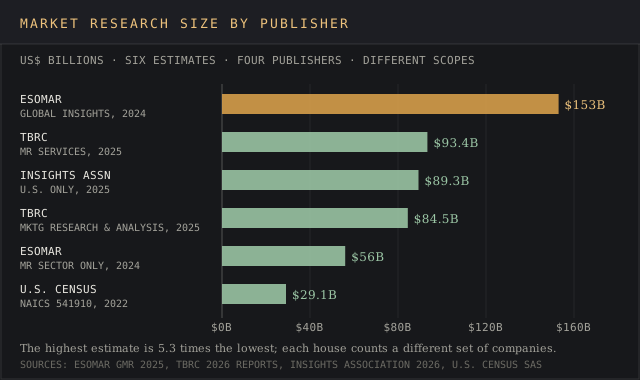
Ask four publishers how big market research is and you'll get six answers between $29 billion and $153 billion. The devil's in the details of scope: one house counts research software and dashboards, another counts only agency revenue, a third counts one country.
| Publisher and report | Scope | Year | Size |
|---|---|---|---|
| ESOMAR, Global Market Research 2025 | Global insights industry: research, software, reporting | 2024 | $153 billion |
| The Business Research Company, Market Research Services Market Report 2026 | Global market research services | 2025 | $93.37 billion |
| Insights Association, 2026 State of U.S. Insights & Analytics | U.S. insights and analytics only | 2025 | $89.3 billion |
| The Business Research Company, Marketing Research and Analysis Services Market Report 2026 | Global marketing research and analysis services | 2025 | $84.46 billion |
| ESOMAR, Global Market Research 2025 | Market research sector only | 2024 | $56 billion |
| U.S. Census Bureau, Service Annual Survey (via FRED) | U.S. employer firms in NAICS 541910, marketing research and public opinion polling | 2022 | $29.1 billion |
Three mechanisms produce the spread:
- Software. ESOMAR adds $62 billion of research software and $35 billion of reporting. The Census figure covers only NAICS 541910, the code for marketing research and public opinion polling firms, so revenue booked by software publishers falls outside it.
- Geography. The Insights Association's $89.3 billion is U.S.-only and still beats ESOMAR's $56 billion global research sector, because it folds in digital data analytics.
- Estimation. ESOMAR says the countries it surveys cover about 80% of the world industry; it estimates the remaining 20% itself.
TBRC's two reports show how much a label moves the number: "market research services" reads $93.37 billion for 2025 and "marketing research and analysis services" $84.46 billion, same publisher, same month. Both name North America the largest region and Western Europe the fastest-growing.
Read between the lines of any market size and log the publisher with the figure; our guide to data source attribution techniques covers the habit.
Growth rate and market forecasts
Every house projects mid-single-digit global growth; the U.S. runs faster:
- ESOMAR: the insights industry passes $160 billion by the end of 2025
- TBRC, market research services: $96.77 billion in 2026 and $116.02 billion by 2030, a 4.6% CAGR
- TBRC, marketing research and analysis services: $87.6 billion in 2026 and $105.31 billion by 2030, a 4.7% CAGR
- Insights Association: 7.5% to 8.0% annual U.S. growth for three consecutive years
The Census series gives the longest run of hard numbers across changing market conditions. Revenue at U.S. marketing research and polling firms rose from $20.2 billion in 2016 to $29.1 billion in 2022, a 44% climb and about 6.3% a year compounded. The 2021 to 2022 jump alone was 19%, from $24.5 billion. Those projections assume 2026 market conditions hold, and 2023 showed how fast a rate shock trims them. You can check any of these rates with our CAGR calculator.
Both TBRC pages list 3.6% and 3.7% as the 2026 to 2030 CAGR in their forecast tables. Those are the 2025-to-2026 growth rates; the end values compute to 4.6% and 4.7%. That's par for the course with syndicated market data, so run the arithmetic on the end values before quoting a percentage.
Largest market research companies by revenue
The biggest market research firms publish audited numbers, which provide insights no survey can: they're the firmest data points in the industry. Their 2025 results:
| Company | Fiscal year | Revenue | Growth |
|---|---|---|---|
| Gartner | 2025 | $6.5 billion | +4% reported, +3% FX-neutral |
| NielsenIQ (NIQ) | 2025 | $4,198.4 million | +5.7% reported and organic |
| Ipsos | 2025 | €2,525 million | +3.4% total, +0.6% organic |
| YouGov | Year to 31 Jul 2025 | £388.9 million | +16% reported, +1% underlying |
Acquisitions carried most of the headline growth, the main market dynamics among listed firms. Ipsos grew 3.4% in total but only 0.6% organically, with the BVA Family and infas deals filling the gap, a fair read of the market conditions agencies face. YouGov's 16% reported jump shrinks to 1% underlying. NIQ, which owns GfK, grew 5.7% on both measures; our NielsenIQ review covers what that retail measurement data looks like from the buyer's side.
Gartner's $6.5 billion would be about 4% of ESOMAR's $153 billion if you treat it as market share, though the total includes Gartner's conferences and consulting revenue. Against TBRC's $93.37 billion it's 7%, so any firm's market share swings with the denominator. Gartner sells annual research seats for strategic planning; its contract value sat at $5.2 billion in Q4 2025, and our Gartner pricing report breaks down what a seat costs.
Research methods: where market research spend goes
Quantitative data collection still takes most of the budget. ESOMAR's method analysis (6 March 2025) splits 2023 global spend this way:
| Method group | 2018 share | 2023 share |
|---|---|---|
| Quantitative research | 78% | 70% |
| Qualitative research | 14% | 14% |
| Advisory and secondary research | 8% (incl. other) | 15% |
| Online and mobile quantitative | not reported | 34% |
Quantitative research takes the lion's share, and online and mobile surveys alone take 34% of every research dollar, the single largest line. ESOMAR classes those surveys as passive methods, a group that made up 60% of spend. Core active methods, the interviewer-led side of data collection, held 19%.
Europe spends 76% on quantitative research and 10.5% on qualitative research. Africa's qualitative share tops 29%, the highest anywhere, while North America sends up to 22% to advisory and secondary research. Qualitative spending hit a record $17 billion in 2022, ESOMAR's earlier analysis found, after 30% growth in a single year.
The method follows the research objectives. Quantitative research sizes a target market across consumer demographics, and its quantitative data feeds market share models. Focus groups and in depth interviews provide insights into the consumer behavior behind the numbers.
Primary research collects new data; secondary research reuses existing data such as Census tables of consumer demographics. Our guide to market research methods walks through each, and the focus group cost report prices the qualitative side.
AI adoption among market researchers
Research software is the fastest-growing sector in ESOMAR's data, and AI, the biggest of the 2026 industry trends, is what that software now sells. Qualtrics polled more than 3,000 market researchers in 14 countries in Q3 2025 for its 2026 Market Research Trends report:
- 53% use AI regularly; nearly nine in ten have experimented with it
- 66% use AI embedded in research software, up from 62%
- 67% use general-purpose chatbots, down from 75%
- 78% expect research agents to handle more than half of projects end-to-end within three years
Among synthetic data adopters, 45% call synthetic responses their most reliable data source, ahead of traditional online panels. Senior leadership and the people doing the work aren't on the same page: 79% of leaders are confident in synthetic data quality against 61% of individual contributors.
Teams on the AI side report more demand. Of teams using synthetic responses, agentic AI or purpose-built tools, 72% said their organizations lean on market research insights more than they did a year earlier. Among traditional teams, 37% reported flat or falling demand, against 20% of AI adopters. Qualtrics sells these tools, and a one-wave survey can't separate cause from selection, so the jury's still out on what drives that gap.
Greenbook's GRIT 2026 Insights Practice Report, which tracks emerging trends across 735 market researchers, reads the same way. Brand-side research teams showed an 18% net rise in synthetic data use, and 73% of brand analytics teams using agentic AI apply it to preparing and integrating data. Those technological advancements run on machine learning; our AI adoption statistics cover the wider business picture.
How consumers and B2B buyers research purchases
The consumer behavior market researchers study is changing too, and the trust numbers are a red flag for marketing strategies built on what a target audience says in surveys. A Gartner survey of 1,539 U.S. consumers (October 2025, published 16 March 2026) found:
- 61% frequently question the reliability of information they use for everyday decisions
- 68% frequently wonder if content they see is real
- 50% would prefer to do business with brands that don't use GenAI in consumer-facing content
GenAI is now part of how people shop. Gartner's January 2026 release says 51% of 365 U.S. consumers report GenAI has changed their research habits. NielsenIQ's Agentic Commerce Tracker (24 September 2026) found 51% of U.S. consumers used at least one AI-powered tool to support shopping in the past month, the first reading above half.
B2B buyers lean on AI and still check it. In a Gartner survey of 645 B2B buyers (May 2026), 45% used GenAI to gather vendor and product information, and 69% prefer to validate AI-generated insights with a sales rep. Buyers used seven information sources per purchase on average, seven touchpoints to map when marketing efforts develop strategies by channel.
These market conditions change how consumer insights teams read their data. When 68% of consumers doubt content is real, stated consumer preferences need checking against customer feedback and sales before they become market research insights. NIQ's tracker shows the alternative: a monthly sample of about 500 consumers, a steady feed of real-time consumer insights.
How companies use market research data
Companies conduct market research to make informed decisions on three questions: how big a new market is, who the target customers are, and where rivals are weak. The statistics on this page feed four jobs:
- Strategic planning: market size and growth rate figures set targets for business strategies and identify opportunities in potential markets
- Competitive tracking: company filings and market share data identify gaps in a rival's coverage
- Marketing strategies: consumer demographics, consumer behavior and market trends help teams pick a target audience and develop strategies for target consumers
- Performance tracking: customer satisfaction and sales data evaluate performance of marketing efforts after launch
The work splits into collecting data, interpreting data and reporting. Analysts analyze data, create charts for senior leadership and turn findings into actionable insights tied to business objectives and business decisions. Decision making processes reward meaningful insights and data-driven insights a reader can trace to a source.
Software is enabling businesses to field surveys without an agency, which is how research software reached $62 billion; our survey software pricing report lists what those platforms charge.
Market research ROI and spending statistics
Buyers keep raising research spend, with U.S. industry revenue up 7.8% in 2025. Return on that spend is the statistic everyone wants, and the figures that circulate trace back to vendor surveys. Hanover Research's State of Market Research (5 October 2022), a survey of nearly 400 business leaders, reports that "Nearly all organizations report a positive return from market research, and most report returns exceeding 4x."
KX and the Centre for Economics and Business Research surveyed 1,262 data and IT decision-makers in six countries, and Cebr reported (9 May 2022) that 80% saw revenue increase after implementing real-time analytics. That's 80% of companies seeing some increase; summaries that turn it into an 80% revenue uplift miss the mark.
Treat both as the vendors' own numbers. Hanover sells research and KX sells analytics, so discount any claim of invaluable insights accordingly.
Market research helps businesses when market research findings reach a decision, so connect research spend to tangible outcomes and ROI. Tie market research efforts to two or three market research KPIs, key performance indicators set before fieldwork: decisions changed, time to insight, cost per complete, customer satisfaction and revenue from products and services. Our market research cost report covers the spend side, from $0.95 a response to $75,650 contracts.
Market research analyst jobs and pay
The U.S. Bureau of Labor Statistics counted 952,700 market research analyst jobs in 2025 in its Occupational Outlook Handbook, with a median wage of $78,760 ($37.87 an hour). BLS describes the job as studying consumer preferences and business conditions to gauge potential sales, and entry typically requires a bachelor's degree. Employment is projected to grow 7% from 2025 to 2035, against 3% for all occupations, adding 66,300 jobs and about 82,000 openings a year.
| Occupation (BLS) | Jobs, 2025 | Median pay, 2025 | Outlook 2025-35 | Entry-level education |
|---|---|---|---|---|
| Market research analysts | 952,700 | $78,760 | +7% | Bachelor's degree |
| Survey researchers | 9,800 | $69,460 | -5% | Master's degree |
Median wages by industry, May 2025:
- Information: $102,670
- Management of companies and enterprises: $99,850
- Finance and insurance: $94,330
- Wholesale trade: $78,780
- Management, scientific and technical consulting: $77,820
Consulting firms employ the most analysts, 11% of the total, yet pay the lowest median of the five. The bottom 10% earned under $43,390 and the top 10% over $155,480, and most work full time during regular business hours.
Survey researchers, who design the questionnaires, are projected to shrink 5% while analysts, who analyze data from many sources, keep growing. Our profile of the market intelligence analyst role covers the adjacent job.
What the market research figures leave out
The forecasts share blind spots, and three are worth keeping an eye on.
- Currency. Gartner's 2025 growth reads 4% reported against 3% FX-neutral; a point of it was exchange rates.
- Lag. The Census series stops at 2022 and ESOMAR's 2025 edition describes 2024; the freshest, the Insights Association's 2025 total, came hot off the press in August 2026, so 2026 market conditions sit outside every figure here.
- In-house research. Every estimate here counts revenue earned by research sellers. BLS counts 952,700 analysts, and the salaries of those on brand payrolls sit outside all six market sizes.
Market conditions and market dynamics moved under several of these estimates: ESOMAR blamed interest rates for slower 2023 investment. Continuous competitor monitoring tools often land in the software column, a line our explainer on market intelligence vs market research draws.
Frequently asked questions
How are statistics used in marketing?
Statistics turn survey answers and sales records into estimates: market size, market share, growth rate and the confidence interval around each. Marketing efforts use them to track market conditions, pick a target market, develop strategies by segment, and shape marketing strategies and business strategies around consumer behavior. Market segmentation by consumer demographics is the most common use; see our segmentation guide.
What is data analysis in market research?
Data analysis is the step where market researchers clean, weight and test collected data, then analyze data against the research objectives to produce research findings and actionable insights. It covers cross-tabs and regression on quantitative data and text coding of in depth interviews and open-ended answers, now often done with AI: 66% of researchers use AI built into their research software, per Qualtrics.
Is market research analyst a stressful job?
BLS says most market research analysts work full time during regular business hours. The pressure point is AI: 15% of individual contributors in Qualtrics' 2025 survey fear AI-driven layoffs, three times the 5% of leaders who do.
Can ChatGPT do market research?
It can turn desk research into valuable insights faster, and 67% of researchers use general-purpose chatbots. It can't conduct market research with real respondents, the core of primary research: Gartner found 69% of B2B buyers still validate AI-generated insights with a person.
Where can I get market research data?
Free primary sources for strategic planning include the U.S. Census Bureau, the Bureau of Labor Statistics and ESOMAR's published excerpts, which track industry trends by sector. Paid data comes from syndicated firms such as NielsenIQ and Circana, survey platforms, and the tools in our market research tools ranking.
What is the use of Statista?
Statista collects charts on industry trends and market trends from other publishers and from its own surveys into one portal, and those charts provide insights fast. Each chart carries a source line, so go straight to the horse's mouth and cite that original publisher and its report date.
What are 5 components of market research?
Most projects follow the same market research process in five parts: research objectives, research methods, sampling, collecting data through panels, phone interviews or focus groups, and analysis with reporting. Our market research report template follows the same order.
Bottom line
Market research is a $56 billion industry or a $153 billion one, depending on how you treat research software, and software is where the growth sits: 11.5% against 4.8% in ESOMAR's 2024 data. The U.S. accounts for $89.3 billion on the Insights Association's measure and grows near 8% a year.
Quote every figure with its publisher, scope and year. Online surveys take 34% of spend, 53% of researchers use AI regularly, and 952,700 Americans work as market research analysts at a $78,760 median. Valuable insights start from figures like these, each with a named source behind it.
The associations, filings and surveys behind each market research figure, and what none of them count
Industry size: researchworld.com (ESOMAR Global Market Research 2025, 4 November 2025; Global Market Research 2024, 20 November 2024; method analyses of 6 March 2025 and 2023).
Other size estimates: insightsassociation.org (2026 State of U.S. Insights & Analytics, 10 August 2026), mrweb.com (DRNO coverage), thebusinessresearchcompany.com (Market Research Services and Marketing Research and Analysis Services market reports 2026) and fred.stlouisfed.org (Census Service Annual Survey, NAICS 541910).
Company results: investor.gartner.com (fourth-quarter 2025 results), nielseniq.com (full-year 2025 results), ipsos.com (2025 results) and shareprices.com (YouGov RNS, year to 31 July 2025).
AI and buyer surveys: qualtrics.com (2026 Market Research Trends, 17 November 2025), greenbook.org (GRIT 2026 Insights Practice Report), gartner.com (consumer and B2B buyer survey releases of January, 16 March and 20 May 2026) and nielseniq.com (Agentic Commerce Tracker, 24 September 2026).
ROI and jobs: hanoverresearch.com (State of Market Research, 5 October 2022), cebr.com (KX and Cebr real-time data survey, 9 May 2022) and bls.gov (Occupational Outlook Handbook pages for market research analysts and survey researchers).
Every figure was checked against its source on 15 October 2026. The Census series ends at 2022, and no publisher sizes the in-house research spend of brands, so every market size on this page counts research sellers only.