Sales enablement statistics for 2026: a $6.0 billion market and 49% win rates
 By Jan Suski. I go deep on every review, checking every number against its source and digging up details other coverage misses, a habit from six years of SEO and link building for tech companies. Bylines at Surfer, Brand24, and Senuto. How the scoring works.
The numbers Enablement adoption, win rates, coaching and market size, checked 7 October 2026
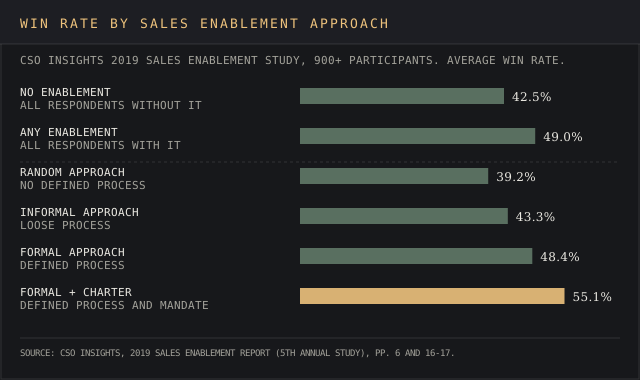
Enablement pays in win rates: CSO Insights measured 55.1% for a formal program with a charter, against 39.2% for a random approach.
Most sales enablement content still goes unused, at 60% to 70% of B2B output in SiriusDecisions' estimate.
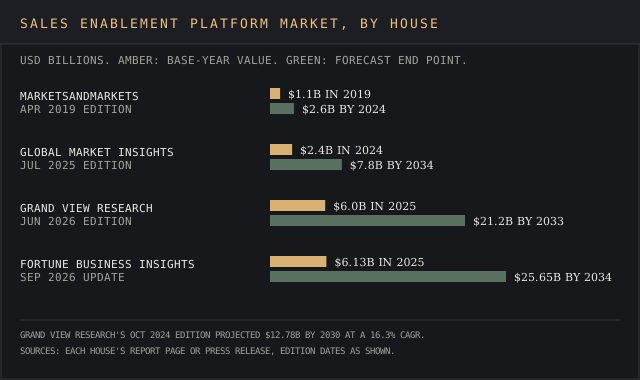
The size figure depends on the house, from $2.4 billion for 2024 at Global Market Insights to $6.13 billion for 2025 at Fortune Business Insights.
Organizations with a sales enablement function won 49.0% of their deals in CSO Insights' fifth annual sales enablement study, against 42.5% for those without one. The software behind that work was worth $6.0 billion in 2025, per Grand View Research's June 2026 report.
This report collects sales enablement statistics on adoption, team size and budget, win rates, content usage, onboarding and ramp time, training and coaching, AI, market size and the buyers on the other side of the table. Every figure links to the body that published it, and one section names where the houses disagree and why.
It's written for enablement managers, sales leaders & revenue operations teams who have to defend an enablement investment with numbers. The figures matter because budgets are under review: 23.6% of enablement practitioners saw headcount cut in the Sales Enablement Collective's 2025 survey, and 52% of sales reps told Salesforce that traditional enablement doesn't give them the skills they need.
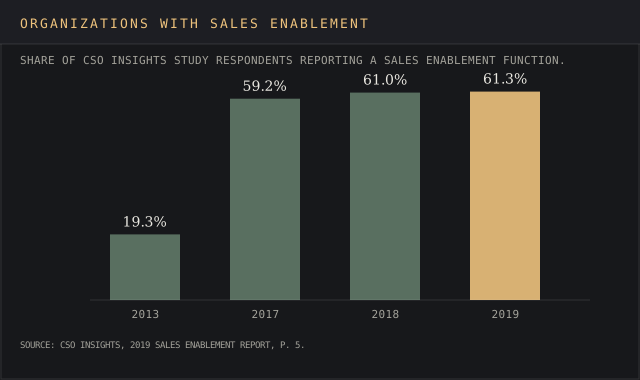
Sales enablement adoption: 61.3% of organizations in 2019, up from 19.3% in 2013
CSO Insights tracked enablement adoption across its annual studies. The share of organizations with a sales enablement function jumped from 19.3% in 2013 to 59.2% in 2017, then barely moved: 61.0% in 2018 and 61.3% in 2019, from more than 900 participants worldwide.
Sales enablement strategy got more formal after that plateau. In Sales Enablement PRO's surveys, the share of organizations with a formal enablement charter rose from 28% in the 2021 report (379 responses) to 32% in the 2022 report (more than 400). Enablement programs at least two years old went from 68% to 80% of respondents, so many organizations now run programs past their second year.
Where the function sits shapes its sales enablement strategy. The 2021 report counted these reporting lines:
- Senior sales leader: 26%
- Executive leader: 21%
- Sales operations: 17%
- Revenue leader: 16%
- Marketing leader: 7%
Marketing alignment moved since then. Seismic and LXA's 2023/24 survey of 204 respondents, reported by Enterprise Times, found the CMO responsible for enablement at 19% of organizations in 2023, up from 10% in 2022, which puts sales and marketing on the same page about who owns sales enablement content.
Executive alignment is thin. In the Sales Enablement Collective's 2025 salary and landscape report, published October 22, 2025, only 43.8% of practitioners said they're aligned with senior leadership over metrics. 59.4% worked in sales, sales management or sales leadership before moving into enablement. That leaves 56.2% running a sales enablement strategy with performance metrics their senior leaders don't share.
Enablement team size and budget: 49% of teams had six or more people in 2022
Enablement teams grew fast between the two Sales Enablement PRO surveys. The share of teams with six or more people went from 31% to 49% in a year, and one-person teams shrank from 31% to 18%. By 2022, 82% of respondents ran a dedicated sales enablement program with a team of two or more people.
| Enablement team size | 2021 report (379 responses) | 2022 report (400+ responses) |
|---|---|---|
| Fewer than 2 people | 31% | 18% |
| 2 to 5 people | 39% | 33% |
| 6 or more people | 31% | 49% |
Source: Sales Enablement PRO, State of Sales Enablement 2021 (p. 7) and 2022.
Headcount correlates with results in the 2021 data: each additional enablement team member lined up with a 3-point improvement in win rates for sales teams, and every extra $50,000 of budget with a 1-point improvement. 53% of respondents expected a significant budget increase that year.
Headcount reversed for some teams by 2025. 23.6% of the Sales Enablement Collective's respondents said their teams lost headcount over the previous 12 months, while 52% of the Seismic and LXA respondents wanted a bigger enablement team, so the jury's still out on 2026 budgets.
Spend per seller tracks win rates too. CSO Insights found 60.9% of organizations invest $500 to $2,500 per salesperson a year in sales training. Those spending under $500 won 42.8% of deals, and those spending over $2,501 won 50.2%. The sales statistics report covers pay and headcount for the sales teams being trained.
Win rates and ROI: a formal program with a charter reaches a 55.1% win rate
CSO Insights split its 2019 sample by how formally each organization runs its sales enablement strategy. Win rates climb with every step of structure, from 39.2% for a random approach to 55.1% for a formal program backed by a charter.
Revenue follows the same line. Organizations meeting most of their enablement expectations hit 107.8% of revenue plan, against 97.6% for those meeting few and a study average of 102.5%. The study-wide average for quota attainment was 60.0% of reps, and structured enablement lifted it: a content strategy put quota attainment 18.1% above that average and dynamic coaching 21.3% above it.
Vendor research points the same way. Highspot's 2025 survey of 350 go-to-market professionals across 21 countries found companies on a unified platform 42% more likely to improve win rates, and well-integrated tech stacks 42% more likely to raise sales productivity. 29% still spread the work across multiple disconnected tools.
Measuring it has become routine. In Sales Enablement PRO's analytics report for 2022 to 2023, the share of organizations tracking win rates rose from 67% to 78%, and effective measurement showed up in quota attainment: teams tracking competency improvement gained 3 points. Sales teams in HubSpot's 2025 data measure success first by annual recurring revenue (42%), then by profit margin (30%).
Picking the right metrics is easier said than done, because enablement sits two steps away from revenue. A measurement plan that ties activity to business outcomes usually covers these data points:
- Sales performance and revenue impact, the key metrics for executives: win rates, average deal size, closed-won deals and forecast accuracy
- Speed: sales cycle length, average sales cycle length by stage of the sales process and ramp time for new reps
- Learning: completion rates and scored assessments from enablement programs
- Usage: enablement content views, shares and activity data from the CRM
- Quantitative data paired with qualitative feedback from the average salesperson and frontline managers
The top metrics only become measurable outcomes once they're baselined before a program starts. Teams that track completion rates against reps hitting quota by cohort, before and after a program, can read the revenue impact directly. Free tools such as the win rate calculator and a win-loss analysis template help gather qualitative feedback alongside the numbers.
Sales enablement content: 60% to 70% of B2B marketing content goes unused
The content usage problem sits between sales and marketing, and it has a long paper trail. SiriusDecisions, now part of Forrester, stated at its 2013 Summit that 60% to 70% of content produced by B2B marketers goes unused, and some of its clients reported more than 80%.
Platform data shows the same skew in sales enablement content. Mindtickle's State of Sales Readiness 2022 benchmark, built from 350+ companies on its platform, found 50% of all engagement came from 10% of the content. That usage data is one of the more valuable insights a platform produces, since it shows which 10% to keep. The top 10% of organizations refreshed their key enablement content every 3.25 months.
Low usage starts upstream, in creating content without a plan. Only 31.8% of CSO Insights' respondents had a content strategy for their enablement content, and those that did posted win rates 27.1% higher than the study average. Finding a deck in an unmanaged library is a needle in a haystack, so a searchable content repository pays: Sales Enablement PRO found teams that monitor time spent searching for content gained 3 points of win rate.
Sales enablement content spans product sheets, case studies, pricing pages and battlecards, and buyers judge it on proof points. HubSpot's October 29, 2025 analysis of its State of Sales data puts the buyer side in numbers:
- 37% of buyers see product fit as the deciding factor
- 35% need to justify value for money
- 40% of sales teams now offer free trials, pricing pages and customer stories
- 28% of salespeople named more effective use of sales enablement content as a focus
Sales enablement content has to follow the buyer's journey, and few programs map it. CSO Insights found 52.1% of organizations align their sales process to the customer's path, but only 30.6% align enablement services to it. Relevant content built from customer needs, buyer personas, objection handling notes and email templates for each stage closes that 21.5-point gap.
The marketing team's side of creating content is tracked in the content marketing statistics and B2B marketing statistics reports, which size the marketing efforts behind each asset. Of all sales enablement content, a competitor battlecard template is one of the relevant materials reps reach for when deals stall against a named rival.
Onboarding and ramp time: account executives take 6.2 months to ramp
New account executives need 6.2 months to reach full productivity, The Bridge Group found in its 2026 study of 158 B2B companies, the longest ramp time in the report's history. 48% of those AEs finished at quota, down from 51% in 2024.
Shortening ramp is where enablement programs report progress. In Sales Enablement PRO's analytics report, 45% of organizations said ramp time decreased in 2022, up from 19% in 2021, and teams tracking new-hire satisfaction were 20% more likely to report a shorter ramp.
Onboarding costs an arm and a leg. Allego's State of Sales Onboarding survey of 300 leaders of B2B sales teams, released May 5, 2022, put the average cost to onboard a sales hire at $9,589 and the average program at 38 days. Only 60% of hires stayed at least six months, and just 26% of onboarding was customized to the new hire.
That leaves most new reps on generic training. Mindtickle's platform data puts onboarding completion at 19 to 20 days and claims structured onboarding on its software cuts ramp to 4 to 5 months, a 40% to 50% reduction on an industry average it gives as 6 to 9 months. Treat the first figure as a usage measurement and the second as a vendor claim.
A 20-day program covers a fraction of a 6.2-month ramp, and the rest is continuous onboarding. Mindtickle found 85% of sellers engage with learning and content for under 10 minutes at a time, a pattern that fits short reinforcement sessions spread across all 6.2 months.
Retention ties back to tooling. Sales Enablement PRO's 2019 report of 513 respondents found organizations using enablement tools for more than two years had 25% less rep turnover. At $9,589 a hire, every new rep who leaves early sends the team back to square one.
Sales training and coaching: 46% of reps rarely get feedback on their sales conversations
Reps say the training isn't landing. Salesforce's State of Sales, 7th edition, surveyed 4,050 sales professionals in 22 countries from August to September 2025, and its sales rep respondents reported these gaps:
- 52%: traditional enablement doesn't provide the skills they need
- 46%: they rarely get feedback on their sales conversations
- 41%: they don't get enough opportunities to roleplay before customer calls
- 40%: their manager's lack of time is an obstacle for enablement
Coaching time is the bottleneck for most teams, and the numbers vary by who's counting. Highspot puts manager coaching at 13 hours a week. Salesforce's 5th edition, from 7,775 respondents in 2022, found only 26% of sales professionals got weekly one-on-one coaching, and 53% of sales leaders used coaching software.
Mindtickle's data shows where the time goes. The average rep gets one manager-led coaching session a month and top performers get three, so regular coaching sessions separate the top tier. 85% of reps are coached on open deals, and 24% on long-term skills, so coaching mostly moves deals forward this quarter.
Consistent coaching pays. CSO Insights measured a 55.2% win rate for organizations with a dynamic coaching process, against a 46.4% study average, a 19% higher win rate. 62.9% of its respondents still coached at random or informally. Sales Enablement PRO found teams collecting manager feedback on coaching gained 10 points of quota attainment.
Leaders know the gap exists. A Seismic-commissioned Harvard Business Review Analytic Services study of 315 respondents, published September 16, 2025, found 87% put sales training and upskilling in the top two importance ratings and 25% call their organization highly successful at it, a 62-point gap.
More training has a cost of its own, and sellers asked to learn everything at once bite off more than they can chew. Gartner's 2024 survey of 1,026 B2B sellers found 72% overwhelmed by the number of skills their job requires and 50% by the amount of technology. Overwhelmed sellers were 45% less likely to attain quota.
AI in sales enablement: sellers who partner with AI are 3.7 times more likely to meet quota
Gartner's 2024 seller survey put the effect of AI on quota at 3.7 times. Its May 20, 2026 release, from 227 chief sales officers surveyed in August and September 2025, adds two more multiples:
- Sales organizations giving sellers AI-enabled next best actions are 2.6 times more likely to achieve commercial growth
- Organizations prioritizing seller AI upskilling are 2.4 times more likely to achieve strong revenue growth
- By 2027, Gartner expects 95% of sellers' research workflows to begin with AI, up from under 20% in 2024
Adoption across sales teams is nearly universal in vendor surveys. Highspot found 90% of organizations using AI in go-to-market work or planning to, and 164% more companies using AI in sales training than a year earlier. Teams with AI-powered coaching were 36% more likely to report higher win rates, and teams with AI-powered training 35% more likely to report a larger average deal size.
The Seismic and HBR Analytic Services study puts usage lower, at nearly 60% of organizations using AI for at least one enablement task. Generating sales enablement content leads at 37%, then personalized buyer emails at 27% and sales call analysis at 23%. 70% of respondents said AI improved team productivity and 64% said it cut time on admin.
Coaching is the next job for agents. 34% of sales teams with agents use them for coaching, per Salesforce, and The Bridge Group's highest AI-engagement tercile had 57% of reps at quota against 39% in the lowest. Teams picking the right tools for call recording can compare the conversation intelligence software ranking and Gong pricing; broader adoption data sits in the AI statistics report.
Sales enablement market size: $2.4 billion to $6.13 billion, depending on the house
Four research houses size enablement software, and their latest base-year values run from $2.4 billion to $6.13 billion. Every figure below comes from the house's own report page or press release.
| Research house | Edition | Base-year value | Forecast | CAGR |
|---|---|---|---|---|
| Fortune Business Insights | Updated Sep 21, 2026 | $6.13B (2025) | $25.65B by 2034 | 17.20% |
| Grand View Research | June 2026 | $6.0B (2025) | $21.2B by 2033 | 17.3% (2026-2033) |
| Grand View Research | October 2024 | Forecast only | $12.78B by 2030 | 16.3% (2025-2030) |
| Global Market Insights | July 2025 | $2.4B (2024) | $7.8B by 2034 | 12.3% (2025-2034) |
| Technavio | Aug 3, 2023 | Growth only | +$4.24B, 2022-2027 | 15.35% |
| MarketsandMarkets | Apr 30, 2019 | $1.1B (2019) | $2.6B by 2024 | 19.8% |
North America takes the lion's share in every report: 37.00% and $2.27 billion in 2025 at Fortune Business Insights, more than 35% in Grand View's 2024 edition, and 30% of forecast growth at Technavio. Global Market Insights puts the U.S. at about 85% of the North American market.
The vendor field is consolidating. Seismic announced its merger with Highspot on February 12, 2026, and completed it on August 18, 2026, creating a company with 2,500 customers, 3.5 million users in sales and marketing plus enablement roles, and more than $100 million a year in R&D under the Seismic name. Global Market Insights had the top five vendors (Seismic, Mindtickle, Outreach, Showpad and Allego) at about 33% share in 2024.
Adjacent categories are priced in the sales engagement pricing and revenue intelligence pricing reports, and the sales intelligence market report sizes the data tools sales teams use beside them.
Why the published sales enablement statistics disagree
The size estimates differ by a factor of 2.5 for adjacent years, and the outcome figures mix absolute rates with relative odds. The devil's in the details, and five of them move the numbers:
- Definition. Grand View counts a platform segment holding over 74% share plus services, and Global Market Insights puts software at about 76%. Each house draws its own line around sales enablement content management, training and coaching tools.
- Edition. MarketsandMarkets forecast $2.6 billion for 2024 in 2019, and Global Market Insights measured $2.4 billion for 2024 in 2025. Grand View's own forecast moved from $12.78 billion by 2030 to $21.2 billion by 2033 between editions.
- Publisher interest. Highspot, Seismic, Mindtickle and Allego sell enablement software, and each survey reports the problem its product addresses. Read the sample line before the headline.
- Relative odds. "36% more likely to report higher win rates" is a change in the odds of a survey answer. CSO Insights' 49.0% is a measured win rate, a different unit.
- Age and sample. CSO Insights' adoption series ends in 2019, and sample sizes run from 100-plus practitioners in Sales Enablement Collective data to 7,775 sales professionals at Salesforce.
Benchmark against the house whose sample looks like your sales teams, and keep an eye on the edition date before quoting a forecast.
Seller time and the buyer's journey: reps sell 40% of the week to a 22-person buying committee
Selling time on sales teams is rising from a low base. Salesforce's 5th edition found reps spent 28% of the week selling in 2022, and its 7th edition puts the figure at 40%. McKinsey's July 6, 2023 analysis found non-selling work consumed two-thirds of the average sales team's time and automation freed about 20% of capacity.
The buyer side moves the target. Forrester counts 13 internal participants and nine external influencers in a typical buying decision, with procurement a decision maker in 53% of cycles and more than 60% of buyers using a trial. 6sense's 2025 survey of nearly 4,000 buyers put the average sales cycle at 10.1 months, down from 11.3.
Buyers contact sellers 61% of the way through the sales process, per 6sense, and the early bird catches the worm: they buy from a vendor on their Day One shortlist 95% of the time. Gartner found 67% of B2B buyers prefer a rep-free experience in a March 9, 2026 release, and its analyst Alyssa Cruz told enablement leaders to move past static content distribution to AI-driven support inside sellers' daily workflow.
Reps still win where buyers need a person. In Gartner's May 2026 buyer survey of 645 buyers, human reps beat generative AI by 39 points for understanding customer needs and by 32 points for confidence in decisions. That's the case for sales efforts at the top of the sales funnel: early proof of fit wins more deals before deals stall.
Quota, pay and sales cycle data for the same sellers sits in the 2026 sales statistics report, and outreach benchmarks from phone calls to booked meetings are in the cold calling statistics report.
The research houses, vendors and surveys behind each sales enablement figure
Enablement studies: community.highspot.com (CSO Insights 5th Annual Sales Enablement Study, 2019; Sales Enablement PRO State of Sales Enablement reports for 2019, 2021 and 2022; Sales Enablement PRO analytics report for 2022 to 2023), highspot.com (State of Sales Enablement 2025), salesenablementcollective.com (2025 salary and landscape report, 22 October 2025) and go.mindtickle.com (State of Sales Readiness 2022 benchmark).
Sales and buyer research: salesforce.com (State of Sales, 5th and 7th editions), gartner.com (releases of 16 September 2024, 9 March 2026 and 20 May 2026), forrester.com (State of Business Buying 2026, 21 January 2026), go.forrester.com (SiriusDecisions on unused content), bridgegroupinc.com (AE Models, Motions & Metrics, 22 June 2026), 6sense.com (2025 Buyer Experience Report), mckinsey.com (6 July 2023) and blog.hubspot.com (29 October 2025).
Vendor releases and press coverage: seismic.com and highspot.com (merger announcement of 12 February 2026 and completion of 18 August 2026), businesswire.com (Seismic and HBR Analytic Services study, 16 September 2025), enterprisetimes.co.uk (Seismic and LXA survey, 20 February 2024) and salestechstar.com (Allego onboarding release, 5 May 2022).
Market size: grandviewresearch.com (June 2026 report and October 2024 release), fortunebusinessinsights.com (updated 21 September 2026), gminsights.com (July 2025), prnewswire.com (Technavio, 3 August 2023) and marketsandmarkets.com (30 April 2019).
Every figure was checked against its source on 7 October 2026. CSO Insights' adoption series ends with its 2019 study, and several surveys come from companies that sell enablement software, so each figure here carries its publisher and sample.
Frequently asked questions
What are the five pillars of sales enablement?
Vendors list different five-part models. The five areas with the most published data are content, onboarding, training, coaching and technology, the parts of a sales enablement strategy CSO Insights tied to win rates: a content strategy added 27.1%, dynamic coaching reached 55.2% against a 46.4% average, and a charter lifted a formal program to 55.1%.
What is the 3-3-3 rule in sales?
Sales trainers use the 3-3-3 rule as a call-preparation habit early in the sales process, commonly three minutes of research to find three facts about a prospect before a conversation. Salesforce found 41% of reps don't get enough roleplay before customer calls, the practice gap the rule covers for reps trying to close deals.
What are the key trends in sales enablement for 2026?
Consolidation and AI. Seismic completed its Highspot merger on August 18, 2026, Gartner expects 95% of seller research workflows to begin with AI by 2027, and The Bridge Group measured a record 6.2-month AE ramp.
What is the 10-3-1 rule in sales?
The 10-3-1 rule is a sales funnel ratio for the sales process: 10 prospects produce three qualified opportunities, and reps close deals on one of them, a 33% close rate on opportunities. CSO Insights' 2019 study measured average win rates between 42.5% and 49.0%, so the ratio is a conservative planning number for sales numbers.
Bottom line
Effective sales enablement is run as a program. CSO Insights put the win-rate spread between a random approach and a chartered one at 15.9 points, and the software behind it is a $6.0 billion category on Grand View Research's count.
The weak spots are execution: 60% to 70% of content unused, a 6.2-month AE ramp, a 10.1-month sales cycle and 46% of reps rarely hearing feedback on their sales conversations. AI coaching and consolidation are the 2026 response, and vendor surveys report AI's effect in relative odds.
Pick figures by method. A market size needs its house and edition date, a win rate needs its sample, and a "more likely" figure needs to be read as odds. Sales and marketing teams that read every figure that way share a unified approach to measuring sales success, tied to the sample each number came from.