EHR statistics for 2026: adoption, vendors, interoperability and market size
 By Jan Suski. I go deep on every review, checking every number against its source and digging up details other coverage misses, a habit from six years of SEO and link building for tech companies. Bylines at Surfer, Brand24, and Senuto. How the scoring works.
The numbers US electronic health records, checked 14 October 2026
Federal money paid for the climb in EHR adoption rates: CMS had paid $35.57 billion in incentives by November 2016, by which point 99% of hospitals held a certified EHR.
The gap that's left after EHR adoption is exchange, with 30% of hospitals still not fully interoperable in ONC's 2023 count.
Epic holds the lion's share of hospitals in every count, from 43.7% at KLAS to 50.8% in the AHA survey ONC compiles.
I'll write a 2,500+ word report on the slice of health IT you name, from ONC data briefs to KLAS shares, every figure linked to its source. Yours to publish, from $200.
Electronic health records (EHRs) sit in 99.4% of US non-federal acute care hospitals, and 95.0% of office-based physicians use one. The hospital figure comes from the ASTP/ONC data brief on hospital EHR adoption, 2008 to 2024 (June 2026); the physician figure from the National Center for Health Statistics, reading its 2024 survey.
The open questions sit downstream of adoption. Only 43% of hospitals routinely send, receive, find and integrate outside records, and two research houses that size the EHR market sit $7.04 billion apart for the same year.
This page collects the numbers analysts, health IT buyers, investors, healthcare professionals and healthcare providers quote most about electronic health records (EHRs), electronic medical records and the EHR systems behind them: EHR adoption rates in hospitals and physician offices, vendor share, interoperability, patient access, clinician workload, AI inside the chart, and the market estimates.
Every figure comes straight from the horse's mouth: it links to the survey owner or the house that published it, with the survey year attached.
Adoption of electronic health records in US hospitals
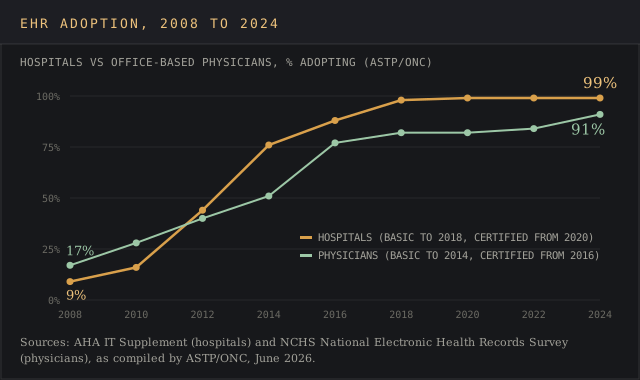
Hospital EHR adoption went from 9% in 2008 to 99% in 2024, per the series that ASTP/ONC (the Office of the National Coordinator for Health Information Technology) builds on the American Hospital Association's IT Supplement. Through 2018 the series tracks basic EHR systems; from 2020 it tracks certified EHR systems, after the two measures converged in 2018. The basic EHR rate moved fastest between 2010 and 2014, from 16% to 76%.
Over the past decade the curve has flattened at the top: certified EHR systems reached 99% of US hospitals in 2014 and have held there through 2024.
Copy these lines into an email, fill them in and send. I reply with scope and a price within 2 to 3 business days.
Open the emailA peer-reviewed reading of the same AHA data by Jiang, Qi, Bai and Schulman in Health Aff Sch (2023) puts basic EHR adoption at 6.6% of US hospitals in 2009 and 81.2% in 2019. Among hospitals running Epic in early 2020, 98% met the basic EHR definition.
ONC's basic EHR definition requires ten functions at the hospital's main site:
- patient demographics
- physician notes & nursing assessments
- patient problem lists and medication lists
- discharge summaries and advance directives
- computerized orders for medications
- viewing lab results & radiology results
The rural gap in EHR adoption has closed. In 2010 the data showed significant disparities: 27.4% of rural hospitals and 24.3% of critical access hospitals had a fully electronic system, against 33.1% overall. By 2024, certified EHR possession sat at 99.5% for rural hospitals, 99.5% for critical access hospitals and 99.0% for independent hospitals, according to Data Brief 83.
One caveat sits in the definition. ONC counts a hospital as having a certified EHR, one that passed the ONC Health IT Certification Program, when it holds a legal agreement with the developer, and the brief states that possession "is not equivalent to adoption."
EHR adoption among office-based physicians
The National Electronic Health Records Survey run by the National Center for Health Statistics is the national survey for EHR adoption in physician offices. Its 2024 cycle reached 1,725 physicians, weighted to represent 415,475 office-based physicians. The survey covers ambulatory providers in outpatient care and counts any non-billing electronic system used to document patient care.
- Any EHR: 88.2% in 2021 (2021 NEHRS estimates), 95.0% in 2024
- Certified EHR, meaning certified to meet Department of Health and Human Services requirements, as respondents reported it: 77.8% in 2021, 83.6% in 2024
- Telemedicine for patient visits: 81.2% in 2024
- Satisfaction with their EHR systems: 25.5% at the top rating, 41.5% somewhat satisfied, 19.7% dissatisfied to some degree
Specialty barely moves EHR adoption rates. Through 2014 the physician series tracked basic EHR use; since 2016 it tracks certified EHR use. ONC's Data Brief 84 (June 2026) puts any EHR use at 95.9% for primary care physicians, 93.7% for medical specialists and 95.3% for surgical specialists, a spread the brief doesn't treat as significant. Among primary care providers, certified EHR use reached 92.0%.
Practice size shows the widest gap. Solo physicians report 86.1% any EHR and 79.9% certified EHR, and only 32% of them run EHR systems from one of the five market-leading developers, against 90% of physicians in practices with more than 50 doctors.
Where the published EHR numbers disagree
Three EHR figures circulate in more than one version, EHR adoption rates among them, and each gap has a traceable cause. Read between the lines of the methodology notes before quoting any of them.
Market size
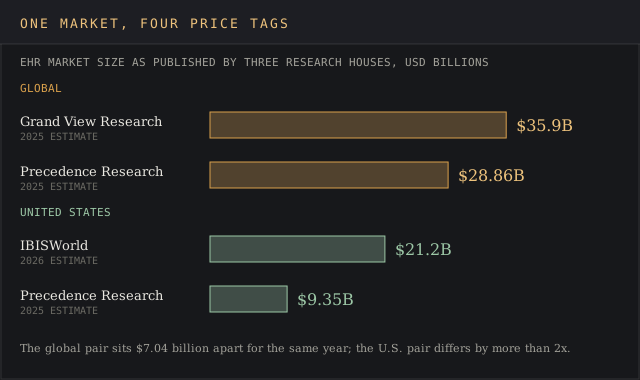
Research houses size the EHR market with different scopes, base years and definitions of what counts as EHR revenue. The four published estimates below don't agree on the world or on the US.
| House and report | Scope | Base figure | Forecast |
|---|---|---|---|
| Grand View Research, Electronic Health Records Market (2026 - 2033), Jun 2026 | Global | $35.9 billion (2025) | $53.1 billion by 2033, 5.1% CAGR |
| Precedence Research, Electronic Health Records Market 2026-2035, updated Sep 2026 | Global | $28.86 billion (2025) | $46.40 billion by 2035, 4.86% CAGR |
| Precedence Research, same report | US | $9.35 billion (2025) | $15.32 billion by 2035 |
| IBISWorld, Electronic Health Records Systems in the US, May 2026 | US industry revenue | $21.2 billion (2026) | 1.0% CAGR, 2021 to 2026 |
Want a market-estimate chart like this for your health IT category? Send the segment.
Email a briefThe scopes explain most of it. IBISWorld counts the revenue of 301 US businesses in the industry, services included; Precedence attributes 46% of a smaller global total to North America. Grand View puts web and cloud-based EHR systems at 83.7% of 2025 revenue and hospitals at 52.8% of end use.
Physicians with a certified EHR
NCHS publishes 83.6% for 2024; ONC publishes nine in ten from the same survey. The difference in reported EHR adoption is a recode. About 10% of physicians who use an EHR don't know if it's certified, so ONC recoded "don't know" and "no" answers to "yes" when the physician named one of ten certified developers. NCHS's public file reports the raw answer.
Hospital share by EHR vendor
The AHA survey that ONC compiles puts Epic at 50.8% of hospitals in 2024. KLAS puts Epic at 43.7% of acute care hospitals in 2025, as Fierce Healthcare reported from the KLAS report. The AHA figure is hospital-reported for 2024; the KLAS figure covers 2025 and comes from KLAS's own market tracking.

EHR vendors and market share
Consolidation is par for the course in electronic health records (EHRs). Epic Systems Corporation went from 8.7% of US hospitals in 2010 to 50.8% in 2024 in the AHA data, while Meditech, the 2010 leader at 23.3%, fell to 15.6%. The top three developers held 35% of hospitals in 2010 and more than 80% in 2024, as EHR adoption neared 100%; the Herfindahl-Hirschman Index rose from 1,102 to 3,297 over the same period.
| EHR vendor | Share of acute care hospitals, 2025 (KLAS) | Share of office-based physicians, 2024 (NCHS) |
|---|---|---|
| Epic | 43.7% | 27.7% |
| Oracle Health (Cerner) | 21.9% | 5.5% |
| Meditech | 14.7% | 11.1% |
| TruBridge | 7.6% | n/a |
| Altera Digital Health (Allscripts) | 2.9% | 2.7% |
| eClinicalWorks | n/a | 7.5% |
| athenahealth | n/a | 7.3% |
- The vendor, setting or region to cover
- Regions, years and segments
- Where it runs: blog, white-label, gated or lead magnet
- Whose byline goes on it
- Deadline
- 2,500+ words, human-written
- Every figure linked to its source
- Yours to publish, under your name or none
- Hosting here for +$200, with your sponsored links
KLAS's 2025 numbers, per Fierce Healthcare's report, show Epic adding 77 hospitals and 18,679 beds, reaching 56.9% of US acute care beds, more than half. Oracle Health posted a net loss of 56 hospitals and 14,676 beds. The KLAS report page adds that hospitals buying EHR technology slowed down: hospitals affected by EHR purchase decisions fell 40% against 2024 and nearly 50% against 2023.
In modern healthcare, Epic & Oracle Health EHR systems together run 65.6% of US acute care hospitals by KLAS's count. Oracle bought Cerner for $95.00 a share, about $28.3 billion in equity value, under the deal it announced on 20 December 2021; it closed on 8 June 2022. Keep an eye on Oracle Health: KLAS reports that 2025 was its third consecutive year of falling market share.
Physician offices run a longer tail. In the 2024 NCHS file, 18.3% of office-based physicians use an EHR vendor outside the eleven named developers. Buyers tracking the EHR market and its vendors against other clinical software can find vendor profiles on the healthcare market intelligence page.
Interoperability and health information exchange
Getting the data out is where EHR systems still fall short. Exchange means patient data moving between healthcare providers: medical histories, lab results and medication lists that arrive in a different EHR. ONC Data Brief 71 scores hospitals' EHR systems on four domains: send, receive, find and integrate patient health information from outside organizations.
- All four domains, routinely or sometimes: 46% of hospitals in 2018, 70% in 2023
- All four domains, routinely: 28% in 2018, 43% in 2023
- Outside clinical information routinely available at the point of patient care: 71% of hospitals
- Clinicians often using that outside information: 42% of hospitals
Size and ownership split the result. Routine interoperability reached 53% of system-affiliated hospitals and 22% of standalone hospitals, 47% of urban hospitals and 36% of rural hospitals. That 2023 survey drew 2,547 responses, a 58% response rate.
National exchange is on the back burner for some. In ONC's Data Brief 72, over 60% of hospitals were aware of TEFCA and planned to take part in 2023, and around one in four hadn't heard of it. HHS said on 11 February 2026 that nearly 500 million health records had been exchanged through TEFCA.
The exchange that does happen often skips standards. ONC's Data Brief 81 (February 2026) found 91% of hospitals pull third-party data into their EHR systems for clinical purposes, with 52% doing it over a standards-based API. Reporting to public health agencies runs higher: 97% of hospitals report immunizations electronically and 84% send electronic case reports, up from 53% in 2021 (Data Brief 78).
Office-based physicians trail hospitals on exchange. In the 2024 NEHRS file, 31.6% often send patient health information to outside healthcare providers through an EHR or web portal, 34.7% often receive it from other healthcare providers, and 59.7% strongly agree that exchange improves their quality of care.
Patient access and patient engagement
Patient portals in electronic health records (EHRs) were near-universal in hospitals by 2021, when 98% let patients view their records. ONC Data Brief 79 (September 2025) measured patient engagement capabilities in 2024:
- View records: 99% of hospitals; download: 96%; transmit: 84%; secure messaging: 92%
- Clinical notes available to patients: 95%, up from 86% in 2021
- Patient access through third-party apps: 81%, up from 70%
- Patients able to submit their own health data: 62%, up from 54%
App access splits by vendor and resources. Hospitals on the market-leading EHR offered app access at 92%, against 70% for hospitals on other vendors, and hospitals outside a health system sat at 71%.
Patient use lags behind those patient engagement capabilities. In Data Brief 77, 77% of individuals were offered online access to their records by a health care provider or insurer in 2024 and 65% were offered access and used it at least once, up from 38% in 2020. Among users, 57% went through an app, and 51% accessed a record on behalf of someone they care for.
Encouragement from healthcare providers changes behavior: 82% of portal users who were encouraged viewed their clinical notes, against 57% of those who weren't.
EHR workload, usability and AI documentation
The workload problem has a stopwatch on it. Arndt and colleagues logged 142 family medicine physicians and found they spent 5.9 hours of an 11.4-hour workday in the EHR, 1.4 of those hours after clinic, once patient care for the day had ended, with clerical and administrative tasks taking 44.2% of EHR time (Ann Fam Med, 2017).
A successful implementation doesn't end the spending. In the Jiang et al. analysis of early-2020 AHA data, hospitals past EHR implementation reported these barriers:
- 53% cited the ongoing cost of maintaining and updating EHR systems
- 50% struggled to keep pace with regulatory requirements
- 40% found it hard to meet all meaningful use criteria on time
- 36% had trouble getting physician cooperation
- 26% lacked enough IT staff
Ambient AI clinical documentation targets that workload, and the first large numbers are in. The Permanente Medical Group's AI scribe hit the ground running: it ran across 2,576,627 patient encounters by 7,260 physicians between October 2023 and December 2024, saving nearly 16,000 hours of documentation time, per Kaiser Permanente's Division of Research summarizing its NEJM Catalyst paper.
The Permanente Medical Group's AI scribe ran across 2,576,627 patient encounters by 7,260 physicians and saved nearly 16,000 hours of documentation time, per Kaiser Permanente's Division of Research.
Documentation hours saved by one medical group's AI scribe
Source: Kaiser Permanente Division of Researche.g. AI scribe results in your specialty
Source: linked, checked, datedPredictive AI already runs inside most hospital EHR systems, shipped as EHR technology from the vendor. ONC's Data Brief 80 found 71% of hospitals used EHR-integrated predictive AI in 2024, up from 66% in 2023. Billing automation jumped from 36% to 61% of hospitals and scheduling from 51% to 67%.
The gap tracks the vendor. Ninety percent of hospitals on the market-leading EHR used predictive AI, against 50% on other vendors; rural hospitals sat at 56% and independent hospitals at 37%. The jury's still out on governance: 82% of hospitals evaluated predictive AI for accuracy and 74% for bias, and fewer did so for all or most of their models. For AI use outside healthcare, see our AI adoption statistics.
Patient safety, patient outcomes and cost evidence
The best-measured link between EHRs and patient outcomes runs through medication orders. A meta-analysis by Radley and colleagues in J Am Med Inform Assoc (2013) found computerized provider order entry cut the likelihood of a prescribing error by 48%, which AHRQ's summary translates into more than 17 million medication errors prevented a year.
The savings case is older and thinner. In its 2005 estimate of the key benefits, RAND projected that efficiency gains from widespread EHR adoption could reach $77 billion or more a year, and that order entry in hospitals could eliminate around 200,000 adverse drug events annually (RAND research brief).
Behavioral health and other care settings
EHR adoption reached most behavioral health facilities by 2024. In ONC Data Brief 82 (April 2026), 68% of substance use and mental health treatment facilities ran on EHR systems alone and 25% used an EHR alongside paper charts; 4% had no plans to adopt.
Ownership drives EHR adoption rates in these healthcare facilities: federal facilities reported 97% EHR adoption and state government facilities 38%. Only 19% of these healthcare facilities took part in a health information exchange organization.
Electronic health record data outside the United States
Australia runs one national set of digital records. The Australian Digital Health Agency reported over 24.8 million My Health Records in February 2026, holding 2 billion uploaded documents of medical information, 770 million pathology reports and 70 million diagnostic imaging reports. Registration among healthcare providers reached 99% of GPs, 99% of pharmacies and 97% of public hospitals, against 71% of specialists.
US researchers also draw on vendor-pooled data, and the health intelligence platforms that resell it. Epic's Cosmos pools patient records from Epic EHR systems for 310 million patients from 2,358 hospitals and 52,500 clinics, patient data used for clinical research and healthcare research. Teams sizing life sciences demand from this kind of data can compare it with the life science market report and the pharma market intelligence guide.
How EHR adoption is measured
Almost every US health care number on this page comes from two surveys. The AHA IT Supplement, funded by ONC, covers hospitals; the NEHRS covers office-based physicians. Two government initiatives built the market they track:
- The HITECH Act (2009) set up the Medicare and Medicaid EHR incentive programs for electronic health records, the meaningful use program
- CMS paid $35.57 billion through November 2016 to 512,360 unique health care providers, including 4,949 hospitals
- Payments required a product from the ONC Health IT Certification Program, run by the Office of the National Coordinator for Health Information Technology inside the Department of Health and Human Services, which tied EHR implementation money to certified software
The devil's in the details. The 2023 hospital survey drew a 58% response rate, and physicians self-report certification, which is why ONC recodes it. For healthcare information management teams, the working rule is to quote the survey year with every figure. Firms that buy this data commercially are profiled in our pharmaceutical competitive intelligence tools ranking and the IQVIA review.
Delivered for your site and your byline. Hosting here is optional.
Frequently asked questions
What percentage of hospitals use EHR?
99.4% of US non-federal acute care hospitals had certified electronic health records in 2024, per ASTP/ONC Data Brief 83, using AHA survey data. In ONC's series, certified EHR adoption among US hospitals has sat at 99% since 2014.
What are the top 5 EHR systems?
By share of US acute care hospitals in 2025, KLAS ranks Epic (43.7%), Oracle Health (21.9%), Meditech (14.7%), TruBridge (7.6%) and Altera Digital Health (2.9%). Among office-based physicians, the 2024 NCHS file lists Epic, Meditech, eClinicalWorks, athenahealth and Cerner as the five most used.
What are the key differences between EHRs and EMRs?
HealthIT.gov describes an electronic medical record as a digital version of the paper chart in one clinician's office, and an electronic health record as a record built to pull in patient information from every clinician involved in a patient's care, shared across multiple care settings including labs and specialists (HealthIT.gov FAQ).
What are the six basic components of an electronic medical record?
ONC's basic EHR definition lists ten key components: patient demographics, physician notes, nursing assessments, problem lists, medication lists, discharge summaries, advance directives, medication orders, lab results and radiology results.
What is the greatest concern of electronic health records?
Time and exchange. Family physicians spend 5.9 hours a day in the EHR, time that competes with patient care, 19.7% of office-based physicians are dissatisfied with their system, and only 43% of hospitals routinely exchange records in all four domains.
How to get EHR data?
Patients reach their own patient information through portals, offered to 77% of US individuals in 2024. Researchers get EHR data from NCHS public-use files, the AHA survey or vendor networks built on EHR systems, such as Epic Cosmos.
Bottom line
The adoption of electronic health records in US health care is finished as a growth story: 99.4% of hospitals and 95.0% of office-based physicians run EHR systems, paid for in large part by $35.57 billion in federal incentives.
The open numbers for healthcare providers and healthcare professionals are exchange, workload and concentration. Only 43% of hospitals routinely move data in and out, 65% of individuals used their online records in 2024, physicians log 5.9 hours a day in the chart, and Epic's share keeps climbing in both hospital counts. Quote the market size with its house and year attached, because the published estimates run from $28.86 billion to $35.9 billion for the same world.
EHR vendors, health IT consultancies and digital health startups use reports like this one in sales decks and investor material.
A report on your topic for a blog page, gated content or a lead magnet.
Written for your client and published under their brand, with my name left off.
Your report on marketintelligencetools.com, with 2 to 3 CTAs carrying your sponsored links.
Default terms: the report is yours to publish, and I keep the right to republish it on this site behind a gate, outside Google's index.
The federal surveys, research houses and filings behind each EHR figure, and what the largest developer keeps private
Federal data: healthit.gov (ASTP/ONC Data Briefs 71, 72, 77, 78, 79, 80, 81, 82, 83 and 84, May 2024 to June 2026; HealthIT.gov FAQ on EMRs and EHRs), cdc.gov (NCHS National Electronic Health Records Survey, 2021 and 2024 files), cms.gov (EHR Incentive Programs summary report, November 2016) and hhs.gov (TEFCA release, 11 February 2026).
Market and vendors: grandviewresearch.com (Electronic Health Records Market, 2026 to 2033), precedenceresearch.com (Electronic Health Records Market 2026-2035, updated September 2026), ibisworld.com (Electronic Health Records Systems in the US, May 2026), klasresearch.com (US Acute Care EHR Market Share 2026, 14 May 2026), fiercehealthcare.com (coverage of the KLAS shares), oracle.com (Cerner announcement, 20 December 2021, and close, 8 June 2022) and cosmos.epic.com.
Research: pmc.ncbi.nlm.nih.gov (Jiang et al., Health Aff Sch, 2023), annfammed.org (Arndt et al., 2017), doi.org (Radley et al., J Am Med Inform Assoc, 2013), rand.org (research brief, 2005), divisionofresearch.kaiserpermanente.org (ambient AI scribe results) and digitalhealth.gov.au (My Health Record statistics, February 2026).
Every figure was checked against its source on 14 October 2026. KLAS keeps per-vendor shares behind a client login, so those shares come through Fierce Healthcare's report, and Epic is privately held and files no financial statements.