Account-based marketing statistics 2026: 81% report higher ROI, 52% measure it
 By Jan Suski. I go deep on every review, checking every number against its source and digging up details other coverage misses, a habit from six years of SEO and link building for tech companies. Bylines at Surfer, Brand24, and Senuto. How the scoring works.
The numbers Account-based marketing adoption, ROI and market size, checked 7 October 2026
ABM's budget share held between 28% and 30% across two ITSMA surveys, so the open question for most B2B marketers is proof of return.
The 29 points between the 81% who rate ABM's return higher and the 52% who measure it mean a large share of ABM ROI claims rest on practitioner opinion.
Four research houses put the full ABM market between $1.03 billion and $1.69 billion, a $660 million spread, so every market figure needs its publisher attached.
81% of ABM practitioners rate the return on account-based marketing (ABM) above traditional marketing efforts, yet only 52% of their companies measure ABM ROI at all. Both figures come from the Momentum ITSMA & ABM Leadership Alliance 2023 benchmark, a survey of 320 ABM heads and practitioners fielded in August 2023.
The same gap shows up in later account based marketing stats, including a 2025 vendor survey of 107 teams. This page collects the ABM figures that trace to a named publisher, from adoption and ROI to ABM performance, buying committees, intent data, AI and market size, each linked to its source with the sample size where published.
It's written for marketing leaders building an ABM business case and for revenue teams checking a vendor slide against its source. Platform and ad costs sit in our account-based marketing pricing report, and the B2B marketing statistics page covers budgets & buyers outside ABM.
How many companies run account-based marketing
ABM is mainstream on every published count, with adoption figures from 64% to nearly 80%. The lower figure comes from the larger, disclosed sample.
6sense's 2024 ABM benchmark, published 13 March 2025 from 1,332 participants across two studies, found 64% of marketers say their B2B marketing teams have an account-based or target account approach. Privately financed companies sat at 53%, against 60% or more at venture-backed, private-equity-owned and publicly traded ones.
Demand Gen Report's 2026 survey put the share at nearly 80% actively executing an ABM strategy, with the rest planning to add one.
Embedding a program is easier said than done. Momentum ITSMA's March 2023 benchmark release, drawn from 279 ABM heads, found only 17% of programs fully embedded as a foundational pillar of go-to-market strategy. Its August 2023 survey split out an ABM Leaders group, the top 17% by results, and 68% of them described their account-based marketing (ABM) programs as expanding or embedded, against 43% of everyone else.
ABM topped the B2B marketing priority list for the third year running in ITSMA's 2023 survey. N.Rich's 2025 State of ABM report, a vendor survey of 107 B2B teams, found 67% treat ABM as a core GTM alignment motion. Only 22% run it on a dedicated platform, and 73% run their ABM efforts on CRM, marketing automation & analytics platforms. The ABM platforms ranking compares the 11 dedicated options.
Staffing separates the groups. 82% of ABM Leaders staff full-time ABM-ers against 51% of other marketing teams, and 71% have a dedicated content team or agency against 29%. In N.Rich's data, 64% of programs are led by a CMO or VP of marketing and 44% sit with demand generation teams.
ABM budget and spending statistics
Companies running account-based marketing (ABM) dedicated 30% of their 2023 marketing budget to it, up from 28% of the 2022 budget in the 279-person survey. 71% planned to raise ABM spend in 2023, and 66% planned the same for 2024.
6sense's benchmark agrees. Inbound marketing, outbound and ABM each receive roughly 30% of marketing budgets in its data, so the ABM approach sits level with inbound and outbound in the marketing strategy.
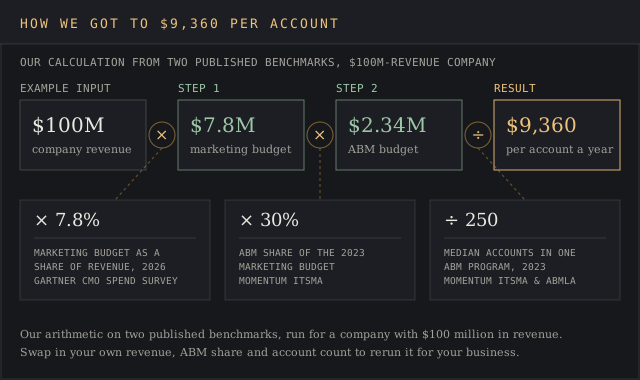
Total marketing budgets sit at 7.8% of company revenue in 2026, up from 7.7% in 2025, per Gartner's 2026 CMO Spend Survey of 401 CMOs fielded January to March 2026. Put the two benchmarks together for a SaaS company with $100 million in revenue. Marketing gets $7.8 million, and a 30% ABM share puts $2.34 million into programs aimed at high-value accounts. Spread across ITSMA's median 250-account program, that's $9,360 per account a year.
For B2B marketing teams at that size, platform licenses are a drop in the bucket. Vendr's tracked median for 6sense is $62,440 a year across 204 purchases, from $11,376 to $176,809. Demandbase's Vendr median is $68,591 across 106 purchases. The trade-offs show at the entry end, where ZenABM lists its Starter plan at $59 a month.
The 6sense pricing report and the Demandbase review break down each quote, and the ABM pricing report adds ad spend, intent data and headcount for anyone implementing account based marketing from scratch.
ABM ROI statistics and the measurement gap
ITSMA has asked practitioners to compare the return on account-based marketing (ABM) with other marketing for at least three surveys, and the share answering "higher" has held between 72% and 81%.
- 2020 study, published January 2021: 76% of respondents saw higher ROI with ABM than with other marketing, from more than 400 B2B technology marketers, per Demand Gen Report's coverage.
- 2022 survey, published March 2023: 72% said ABM delivers higher ROI than other types of marketing, from 279 ABM heads.
- August 2023 survey: 81% of 115 respondents rated it higher, 45% "significantly higher" and 36% "somewhat higher." 1% said somewhat lower and 5% didn't know.
The same 2023 survey asked who measures ABM ROI. 52% of companies do, 35% don't, and 13% don't know. Forrester's blog on reporting ABM value cites SiriusDecisions Command Center data showing 21% "don't or can't measure ABM ROI at all."
Teams that do measure lean on two metrics. Pipeline growth is tracked by 67% of 116 respondents and revenue growth tied to ABM by 63%, ahead of account engagement at 33% and win rate at 28%, so pipeline impact carries most ABM reporting.
Each ROI figure above names its publisher and sample, and the same check belongs on any ABM performance claim before it enters a business case.
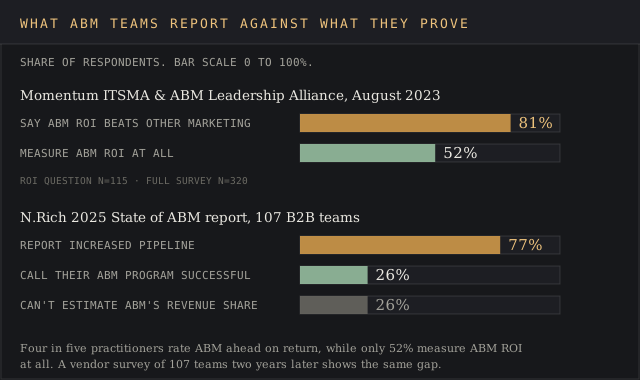
Vendor surveys of ABM efforts show the same split two years later. N.Rich's 107 teams reported 77% increased pipeline, yet 26% described their ABM program as successful, 43% reported mixed results and 31% called it unsuccessful. 55% said ABM influences 0% to 20% of revenue, 6.5% attribute more than half their revenue to it, and 26% can't estimate its revenue contribution at all.
Revenue leaders grade it lower. The CMO Council's Fire Up Your Revenue Generation Engine study, from more than 170 B2B leaders surveyed in Q4 2023, graded overall ABM effectiveness in finding, winning and growing big customers a C-. Strategic ABM practices got a B.
Talk is cheap until finance asks for the campaign ROI behind a renewal. Measuring success takes a control group of matched target accounts held outside the program, then a comparison of pipeline, qualified leads, win rates and sales cycle length across both groups. That one step turns ABM success into a measured business impact that a revenue team can defend.
ABM performance statistics: pipeline, win rates and deal size
In ITSMA's August 2023 survey, 111 respondents rated ABM performance across nine outcomes. Active account engagement led ABM performance gains, and win-rate gains ranked seventh.
- Active engagement with selected accounts: 85% saw improvement, 40% by more than 10%.
- Pipeline growth: 78% improved, 27% by more than 10%.
- Deals closed or win rate: 14% improved by more than 10%.
In the March 2023 release, from the earlier 279-person survey, 84% reported pipeline growth and 77% revenue growth. N.Rich's 2025 vendor survey found 77% increased pipeline, 69% improved engagement at target accounts, 55% higher win rates and 49% larger average deal sizes.
Demandbase publishes ABM performance data from its own platform. Its State of ABM 2026 benchmark report analyzed 1,452 customer tenants, 429,634 ad campaigns and 9.7 million sales interactions. Companies that engage accounts through four of its advertising products posted a 58.7% win rate, a 71% lift over companies running none. Mature frameworks hit a 22.33% median MQA conversion rate against 14.19% for less mature ABM programs.
6sense's benchmark found ABM teams report 6% higher financial performance than non-ABM teams, the most modest ABM performance gap in this report. 6sense's CEO cited "4X higher conversion rates, 27% faster sales cycles, and 46% larger deal sizes" for its own customers in a November 2025 release. Read between the lines, since the vendor picks the sample. Our 6sense review covers what users report.
ABM program types: one-to-one, one-to-few and one-to-many
ITSMA's 2023 survey measured how many high-value accounts each type covers and its split between new prospects & current customers.
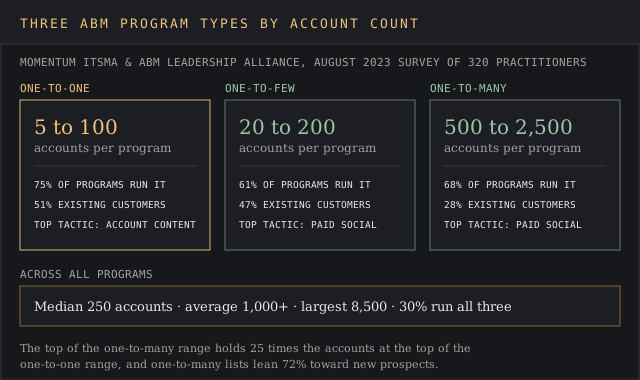
- One-to-one: 5 to 100 key accounts per program, used by 75% of programs, split 51% existing customers and 49% new prospects. Deep personalization for high-value accounts rules here, with account-specific content and thought leadership the top tactic.
- One-to-few: 20 to 200 accounts with shared traits, used by 61% of programs, 47% current customers. Paid social, microsites and SDR outreach are the primary channels used to engage accounts.
- One-to-many: 500 to 2,500 accounts, 25 times the one-to-one ceiling, used by 68% of programs, 72% aimed at new customers. Paid social & PPC engage accounts at volume, followed by email campaigns & content syndication.
Account selection sets the scale of everything after it. The median program covers 250 accounts, the average tops 1,000, and the largest in the study held 8,500. 30% of programs run all three types, 25% run two and 30% run one.
Small in-person events & executive seminars made the one-to-one top five, and virtual events flew under the radar, making none of the three lists. Paid social tops the one-to-few and one-to-many lists, and N.Rich found 78% of its 107 teams use LinkedIn for ABM.
Company size changes the ABM approach. Firms under $100 million rated winning new accounts 4.6 out of 5, against 3.3 at $1 billion-plus companies, which rated growing existing accounts 4.5 and run one-to-one more often, 66% against 45%. Smaller firms frame their ABM campaigns as lead generation, rating that 4.0 against 3.1.
Buying committee, intent data and engagement data statistics
Forrester's State of Business Buying 2026 found "the typical buying decision now includes 13 internal stakeholders and nine external influencers," and procurement sits among the decision makers in 53% of buying cycles. ABM was built to reach entire buying committees at high-value accounts, so multiple stakeholders in finance, IT & procurement hear one message, and key stakeholders outside the company sit among the nine influencers.
Large accounts add steps for decision makers. 78% of buyers spending $10 million or more run a trial first, per Forrester.
Demandbase's platform data puts a typical buying group at 13 to 17 people and calls two to three buying groups per product "the sweet spot." Companies tracking three to four groups saw a 48.5% higher win rate, and groups receiving 180 to 190 touches reached a 94% conversion rate, so engagement signals add up across individual leads.
6sense's 2025 B2B Buyer Experience Report, from nearly 4,000 responses, found typical purchases involve 10 or more people, who made first contact at 61% of the buying process. The winning vendor sat on the day-one shortlist 95% of the time, and the average purchase took 10.1 months, down from 11.3.
Long sales cycles of that length mean a program judged after six months has seen about 60% of one buying cycle. Long sales cycles also push ABM teams to track intent signals and spot high intent accounts in market before first contact, since finding the right 250 target accounts without them is a needle in a haystack.
6sense's benchmark found 72% of organizations prioritize accounts with multiple leads, up from 61% in 2022, a step away from traditional lead generation, which scores individual leads one at a time. Individual leads still count toward an account's score. ABM teams collect 7 to 8 of 23 available buying signals, and the devil's in the details of which intent signals a team trusts.
The intent data pricing report lists what 15 providers charge, including first-party tools that turn anonymous web traffic into account activity from €0. The intent data providers ranking compares coverage.
ITSMA asked 200 respondents to rate each tool's effectiveness in their ABM programs on a five-point scale.
| Rank | Tool | Effectiveness rating, 1 to 5 |
|---|---|---|
| 1 | CRM | 3.7 |
| 2 | Marketing automation | 3.3 |
| 3 | ABM platform | 3.2 |
| 4 | Account intelligence and B2B data | 3.1 |
| 5 | Third-party intent data | 3.0 |
| 6 | Content personalization | 2.9 |
| 7 | Predictive scoring | 2.6 |
| 8 | Customer data platform | 2.3 |
| 9 | Generative AI | 1.9 |
CRM, among the existing tools nearly every team runs, outscored the new tools bought for ABM, and generative AI, the new technology on the list, scored lowest. Predictive analytics, rated 2.6 as predictive scoring, trailed third-party intent data, and customer data platforms, sold as the fix for fragmented data, rated 2.3.
ABM Leaders rated their ABM platform 4.1 against 3.3 for everyone else, and account engagement data 4.4 against 3.6, the widest gap in engagement data between the groups.
AI in ABM programs
AI scores 7.3 out of 10 for improving ABM campaign outcomes, the average effectiveness rating in Demand Gen Report's 2026 findings, published 27 May 2026. 29% named content personalization at scale as AI's top use case. 47% identified personalized content as the tactic in ABM campaigns delivering the highest ROI, so personalized campaigns top both lists.
52% said their ABM efforts meet expectations, 23% exceed them and 10% greatly exceed them, so 85% of respondents report ABM success at or above plan.
Nearly three years earlier, ITSMA asked a different question and got a lower answer. Its August 2023 survey rated generative AI use at 1.9 on a five-point scale, where 1 meant scratching the surface. Companies under $100 million scored 2.2 and $1 billion-plus companies 1.6, so smaller teams jumped on the bandwagon sooner.
Gartner's November 2025 Magic Quadrant for Account-Based Marketing Platforms evaluated eight vendors, including 6sense, Demandbase, Madison Logic, N.Rich and ZoomInfo. 6sense and Demandbase were each named Leaders for a fifth year. The 6sense vs ZoomInfo and Demandbase vs ZoomInfo comparisons test them head to head for a revenue team choosing between them.
ABM challenges and sales alignment statistics
Measuring business impact tops the organizational challenge list. ITSMA's 2023 survey asked 209 respondents to rank their biggest problems by category, and the top three in each look like this.
- People: educating sales on ABM's process and value, aligning the wider marketing organization, managing ABM-ers' time.
- Organization: measuring program impact, proving ROI, tailoring marketing to key contacts.
- Technology: tracking attribution, integrating and managing fragmented data, measuring program effectiveness, with selecting the right martech tools fourth.
Fragmented data across a martech stack of CRM, marketing automation and an ABM platform turns multi-touch attribution into guesswork and hides engagement history from sales teams. Custom dashboards at account level were live for over a year at 21% of programs. For operational efficiency, 21% had run standardized campaign templates that long.
ABM moves alignment, and sales still trails on understanding it. 66% of the 279 ABM heads in the March 2023 release said ABM is improving sales and marketing alignment. In 2023, respondents rated willingness to work on shared KPIs 4.0 out of 5, against 3.3 for sales understanding ABM. Shared KPIs make for smoother transitions when an account moves from marketing touches to sales calls.
N.Rich found 59% of teams report stronger sales alignment from ABM, and 31% still lack effective collaboration between marketing and sales teams. Relevant messaging depends on customer access, and respondents rated sales providing direct customer access 3.3 out of 5. Aligning sales on goals sits fourth on ITSMA's organizational challenge list. It takes two to tango, and only 9% of 2023 respondents strongly agreed that sales understands ABM.
Goals have shifted toward acquisition. Demand Gen Report's June 2026 analysis found 56% name new account acquisition as ABM's primary goal and 28% account expansion, so 84% use ABM to drive revenue directly. 47% integrate demand generation and ABM processes. Our sales statistics report tracks the rep-side numbers behind those targets.
ABM market size: why the published estimates diverge
Five research houses publish five ABM market sizes, and the full-market figures span $1.03 billion to $1.69 billion. Base years differ by one year, CAGRs run from 11.1% to 17.9%, and North America's share ranges from 32% to 40.6%.
| Research house | Starting value | Forecast | CAGR | North America share |
|---|---|---|---|---|
| Mordor Intelligence | $1.03 billion (2025) | $2.02 billion by 2031 | 11.94% | 40.6% |
| SNS Insider | $1.22 billion (2024) | $3.74 billion by 2032 | 15.0% | 40% |
| Grand View Research | $1.4 billion (2024) | $3.8 billion by 2030 | 17.9% | 32% |
| SkyQuest | $1.69 billion (2024) | $4.91 billion by 2033 | 12.6% | Largest region |
| Future Market Insights, ad software only | $1.83 billion (2025) | $5.23 billion by 2035 | 11.1% | Not published |
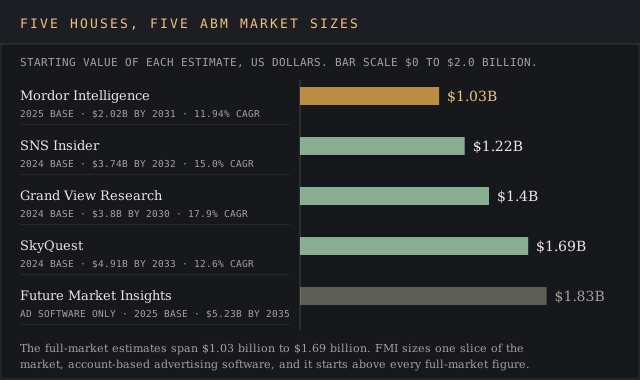
Definitions drive the gap. Mordor counts tools at 64.30% of its market and cloud deployment at 71.40%. SNS Insider puts tools at 63% and cloud at 56%. Future Market Insights sizes one slice, account-based advertising software, at $1,826.7 million for 2025, larger than every full-market estimate on the list.
Forecasts split as well. Grand View's grows the market 2.7 times by 2030, Mordor's roughly doubles it by 2031, and SkyQuest's own page is at sixes and sevens, carrying two 2033 figures, $4.91 billion and $4.36 billion. Quoting one house without its base year misses the mark, so check the start date, 2024 for three houses and 2025 for Mordor.
The houses agree on the shape. North America leads in all three that quantify it, Asia-Pacific grows fastest in all three, and Grand View gives strategic, traditional ABM over 47% of its 2024 market.
Company figures add scale. 6sense raised a $200 million Series E at a $5.2 billion valuation with run-rate revenue above $110 million, per Insight Partners' January 2022 announcement. The same release says customers prioritizing 6sense-identified accounts saw a 25% cut in deal-to-close time and twice the deal size. ZoomInfo made the same Magic Quadrant from the sales data side.
Frequently asked questions
What does ABM marketing mean?
Account-based marketing (ABM) is a B2B strategy in which marketing and sales teams pick a list of target accounts that fit an ideal customer profile and run personalized marketing at the buying committee inside each one, tracking intent signals and customer engagement per account. Personalized outreach aims at each company's pain points and reaches several decision makers at once. In ITSMA's data the median program under this ABM approach covers 250 accounts.
What are examples of account-based marketing?
ITSMA's 2023 survey lists the top tactics in ABM campaigns by type. One-to-one programs use account-specific content, microsites & executive-to-executive programs. One-to-few programs lead with paid social, microsites and SDR outreach. One-to-many programs run paid social, PPC and display ads and email campaigns across 500 to 2,500 target accounts.
What are some key statistics about account-based marketing?
To cut to the chase, companies running ABM gave it 30% of their 2023 marketing budget, 81% of 115 practitioners rate its ROI higher than other marketing, and 52% measure that ROI. Adoption runs from 64% to nearly 80%, and Mordor Intelligence sizes the market at $1.03 billion in 2025.
How long does ABM take to show results?
Plan for at least one full buying cycle. Long sales cycles of 10.1 months, the 2025 average in 6sense's buyer research, mean ABM success measured at six months catches deals mid-cycle. A six-to-nine-month review window covers 59% to 89% of that cycle. Shorter sales cycles are the claim a CRM can test fastest, since every opportunity stage carries a timestamp.
Bottom line
The best-documented account-based marketing (ABM) figures come from Momentum ITSMA and the ABM Leadership Alliance. ABM takes about 30% of marketing budgets at companies that run it, four in five practitioners rate its return higher, and half of those companies measure that business impact.
Platform ABM performance data from Demandbase and 6sense shows lifts in win rate & conversion on samples each vendor picks. Market sizing spreads $660 million across four full-market houses, so quote the house with the number.
For a team building a case, the cheapest upgrade is a control group of matched accounts held outside the program. It moves a company from the 81% who believe in ABM into the 52% who can prove it.
The benchmarks, vendor surveys and research houses behind each ABM figure
Practitioner benchmarks: Momentum ITSMA and the ABM Leadership Alliance (2023 Global Benchmark Report, November 2023, via hubspotusercontent-na1.net, and the March 2023 release via prnewswire.com), demandgenreport.com (coverage of the 2020 ITSMA study, January 2021, and the 2026 ABM Benchmark Survey, May and June 2026), cmocouncil.org (Q4 2023 study).
Analyst firms: gartner.com (2026 CMO Spend Survey, 11 May 2026, and the Magic Quadrant for Account-Based Marketing Platforms, November 2025) and forrester.com (State of Business Buying 2026, January 2026, and its ABM reporting blog).
Vendor data: 6sense.com (2024 ABM Benchmark, 13 March 2025, the 2025 B2B Buyer Experience Report and a November 2025 release), demandbase.com (State of ABM 2026 benchmark report and its Gartner release), nrich.io (2025 State of ABM report, 107 teams), insightpartners.com (January 2022), vendr.com (6sense and Demandbase marketplace pages) and zenabm.com (pricing).
Market size: mordorintelligence.com (updated September 2026), globenewswire.com (SNS Insider, 7 October 2025), grandviewresearch.com, skyquestt.com and futuremarketinsights.com.
Every figure was checked against its source on 7 October 2026. Vendor surveys carry the vendor's name and the sample size where it was published, and the $9,360 per-account figure is our own calculation from the Gartner and ITSMA benchmarks shown in its chart.