Travel statistics 2026: 68.3 million US arrivals and 1.52 billion worldwide
 By Jan Suski. I go deep on every review, checking every number against its source and digging up details other coverage misses, a habit from six years of SEO and link building for tech companies. Bylines at Surfer, Brand24, and Senuto. How the scoring works.
The numbers US and global travel and tourism, checked 4 October 2026
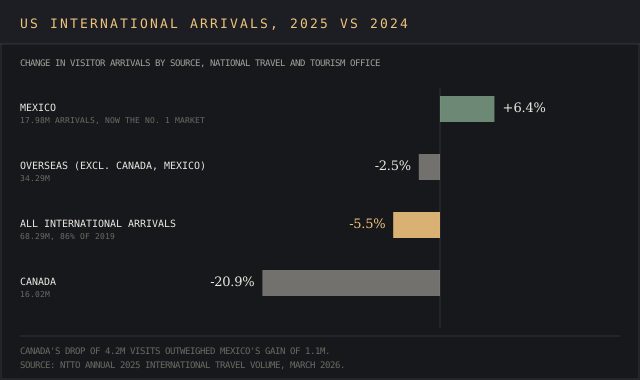
Arrivals from Canada fell 20.9% in 2025 while Mexico rose 6.4%, making Mexico the No. 1 source market.
US citizens kept travelling abroad. Departures in December 2025 ran at 115% of December 2019.
Global growth slowed from 4% in 2025 to 0.4% in the first half of 2026, and UN Tourism cut its 2026 forecast to 1% to 2%.
The US recorded 68.3 million international visitor arrivals in 2025, down 5.5% from 2024 and 86% of the 2019 level, according to the National Travel and Tourism Office (NTTO). Worldwide, international arrivals reached a record 1.52 billion, up 4%, per UN Tourism.
Domestic trips carry the US travel and tourism industry. The U.S. Travel Association forecasts record travel spending of US$1.37 trillion in 2026, and 87% of it comes from domestic travel.
These travel statistics cover US inbound and outbound travel, travel spending, the tourism satellite account, jobs, air travel, hotels, global tourism statistics and traveler behavior, each linked to the government office, trade body or survey that published it. The page is for analysts, hotel and destination marketers, and anyone checking which tourism data answers which question.
US travel and tourism statistics at a glance
Travelers spent US$1.4 trillion directly in the US in 2025, generating US$3.0 trillion of economic output, per the U.S. Travel Association's 2026 economic impact fact sheet, built on Tourism Economics data. Travel supported more than 15 million jobs, 8 million of them directly, equal to 2.4% of GDP, and produced US$92 billion of state and local tax revenue.
Domestic travel takes the lion's share. U.S. Travel's May 2026 forecast puts projected domestic leisure spend at US$909 billion in 2026, the only segment above pre-pandemic spending in real terms. Business travel spend is projected to rise 0.7% to US$319 billion, and international visitor spend 1.6% to US$178 billion. Spending climbs to US$1.42 trillion in 2027.
"Travel continues to be one of the most resilient and essential sectors of the U.S. economy."
Joshua Friedlander, Vice President of Research, U.S. Travel Association, in the May 2026 forecast release.
Our business travel market report sizes the corporate segment of the travel and tourism economy in more detail, and the demand forecasting software ranking covers the tools destinations use to project visitor numbers.
International arrivals to the US
International travel to the US fell last year, a decline led by Canada. The country received 68,287,793 international visitors in 2025, down 5.5%, after 72.4 million in 2024. Overseas arrivals, which exclude Canada and Mexico, fell 2.5% to 34.3 million.
New York was the top port of entry with 5.85 million arrivals, ahead of Miami (4.73 million) and Los Angeles (3.20 million). Three world regions grew in 2025: Central America (+4.7%), Eastern Europe (+2.5%) and the Middle East (+2%).
2026 is mixed so far. Total arrivals rose 2% in March and 2.3% in May, but overseas arrivals fell 6.5% in May, per the National Travel and Tourism Office's monthly international travel volume data. Overseas air arrivals were down 4.8% year to date through May, and July overseas air arrivals fell 7% to 3.1 million, in the same weeks the World Cup played across US host cities.
Forecasters went back to the drawing board. NTTO's March 2025 forecast expected 85.0 million arrivals in 2026. Its April 2026 edition cut that to 70.5 million, rising to 85.2 million by 2030, a growth rate of about 4.5% a year by our CAGR calculator.
The forecast covers the top 12 US source markets, from Canada and Mexico to Italy and Brazil. U.S. Travel expects 70.6 million in 2026 and a return to the 2019 level of 79 million no sooner than 2029, per its travel forecasts page.
The average overseas visitor stayed 16.9 nights and spent US$1,829 per person in 2025, per NTTO's Survey of International Air Travelers. 57.1% came on vacation, 22.2% to visit friends or relatives and 16.4% on business.
Top source markets and the Canada decline
Mexico passed Canada as the No. 1 source of inbound visitors in 2025. Here are the top ten countries by 2025 arrivals, from NTTO's forecast tables. Italy came 11th with 1.18 million and the UK led overseas markets with 4.06 million. NTTO expects Mexico to grow 5.8% and Canada 3.8% in 2026, with India down 4.1%:
| Rank | Country | 2025 arrivals |
|---|---|---|
| 1 | Mexico | 17.98 million |
| 2 | Canada | 16.02 million |
| 3 | United Kingdom | 4.06 million |
| 4 | India | 2.06 million |
| 5 | Japan | 1.97 million |
| 6 | Brazil | 1.92 million |
| 7 | Germany | 1.77 million |
| 8 | South Korea | 1.65 million |
| 9 | France | 1.59 million |
| 10 | China | 1.56 million |
Statistics Canada counts the same drop from its side of the border. Canadian-resident return trips from the US fell 25.4% to 29.1 million in 2025, including same-day trips, while Canadian trips to overseas countries rose 9.2% to 14.2 million, per its February 2026 release. In August 2026, return trips from the US rose 8.8% year on year, the fifth monthly gain in a row, yet car trips stayed 27.4% below August 2024.
US travel spending and the travel trade balance
International visitors spent US$250.2 billion in the US in 2025, down 0.6%, or US$686 million a day, per the National Travel and Tourism Office's travel and tourism exports data. That series adds services beyond vacation spend, including passenger fares paid to US carriers and outlays by foreign students, medical patients and short-term workers.
Inbound visitor spend from January to July 2026 reached US$145.4 billion, down 0.1% on the same period of 2025, per NTTO's July release reprinted by Hotel Online. Americans spent US$20.0 billion abroad that month, up 3%, leaving a US$413 million travel surplus.
U.S. Travel measures the balance differently and gets a US$72 billion travel trade deficit for 2025, using international visitor spend of US$175 billion. Tourism Economics president Adam Sacks told CNN that "historically, the US has had a trade balance in only one significant area, and that is in travel."
The industry wants 100 million international visitors by 2030. U.S. Travel president Geoff Freeman said in a September 2026 release that "getting to 100 million would result in $81 billion in additional spending, more than 400,000 American jobs".
Tourism satellite account and the economic impact of travel
The US Travel and Tourism Satellite Account from the Bureau of Economic Analysis (BEA), part of the Department of Commerce, is the official measure of the tourism industry's place in the economy. Its latest edition, published in February 2025 and covering 2018 to 2023, found real tourism output grew 7.0% in 2023 after 20.8% in 2022, against real GDP growth of 2.9% and 2.5%.
Travel and tourism accounted for 3.03% of US GDP in 2023, up from 2.96%. Tourism value added reached US$840 billion, and total tourism-related output, direct plus indirect, reached US$2.64 trillion, per the tourism satellite account. Food and beverage services, shopping and traveler accommodations were the biggest contributors to tourism industry growth.
Note the end of the series. BEA's travel and tourism page now says "BEA will no longer regularly produce these statistics", so the 2023 tourism satellite account figures are the last official set.
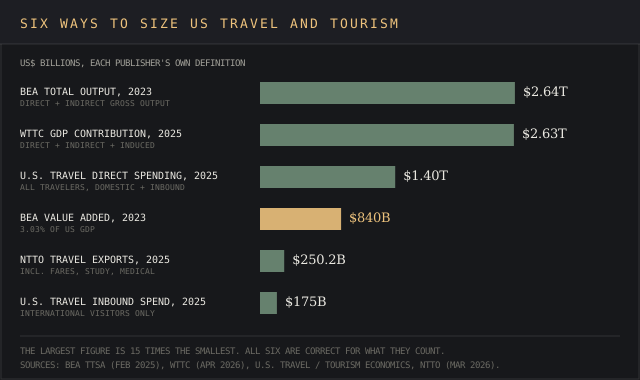
The World Travel & Tourism Council (WTTC) puts the US at US$2.63 trillion of total GDP contribution in 2025, up 0.9%, including induced spending by suppliers' employees. It calls the US the world's largest travel and tourism market, ahead of China at US$1.75 trillion, per its April 2026 release. WTTC president Gloria Guevara said the US "remains the largest Travel & Tourism market in the world".
Travel and tourism employment
Travel and tourism employment depends on the definition. Four counts from government and industry organizations:
- BEA tourism satellite account: 10.0 million tourism industry jobs in 2023, 6.5 million direct and 3.6 million indirect.
- U.S. Travel: 8 million+ direct jobs and 15 million+ supported jobs in 2025.
- Bureau of Labor Statistics: 16.97 million in leisure and hospitality employment in September 2026, a sector that includes restaurants serving locals, per BLS.
- WTTC: 20.4 million jobs supported in 2025, up 242,000, including induced employment.
US residents' outbound travel
US citizens made 107.7 million international departures in 2024, up 9.2%, per NTTO. In 2025, Mexico drew 39.68 million US departures and the Caribbean 11.34 million, together 46.7% of all outbound travel. December 2025 departures ran at 115% of December 2019.
Outbound international travel kept growing in 2026. US citizen departures rose 5.2% to 9.31 million in March, 111.2% of March 2019, and 4.2% to 9.87 million in May, when Mexico took 33.9% and Europe 26.2% of departures. Mexico and the Caribbean remain the top destinations, with 51.2% of departures from January to May 2026.
Air travel and hotels
The TSA screened a record 3.1 million people on 30 November 2025, the Sunday after Thanksgiving, per ABC News. US airlines carried 84.7 million passengers in May 2026, down 0.7%, of which 10.9 million were on international flights, per the Bureau of Transportation Statistics.
Air travel worldwide is still growing. IATA forecasts 5,085 million passengers in 2026, up from 4,967 million, with airline net profit falling from US$45.0 billion to US$23.0 billion on jet fuel assumed at US$152 a barrel, per its June 2026 outlook.
US hotels had their first full-year fall in occupancy and RevPAR since 2020 in 2025. Occupancy dropped to 62.3%, average daily rate rose 0.9% to US$160.54 and RevPAR slipped 0.3% to US$100.02, per CoStar. In August 2026, occupancy reached 66.4% and RevPAR rose 2%, and CoStar and Tourism Economics raised their 2026 RevPAR forecast to +4.4%.
The World Cup gave hotels a smaller lift than hoped. CoStar's Jan Freitag told Forbes: "It's hard to look at the absolute data and conclude this tournament was a tremendous boon for international inbound." Our hotel market intelligence guide and the hotel rate shopping tools ranking cover how hotels track prices city by city.
Global tourism statistics
International tourist arrivals reached 1.52 billion in 2025, up 4% on 2024 and 2% above 2019, and tourism receipts rose 5% to US$1.9 trillion, per UN Tourism's January 2026 World Tourism Barometer. Europe received 793 million arrivals, Asia-Pacific 331 million, the Americas 218 million, the Middle East 99.8 million and Africa 81 million. Within the Americas, South America grew 6.9% and North America fell 1.4%.
Growth stalled in 2026 across most regions. An estimated 690 million tourists travelled internationally between January and June, 0.4% more than the same period of 2025, with a 22% drop in the Middle East after the regional conflict that began in March. UN Tourism Secretary-General Shaikha Al Nuwais said: "Tourism has not stopped growing, but that growth is fragile."
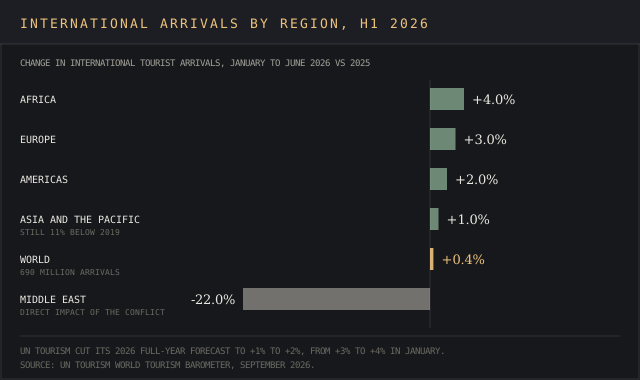
When it rains it pours. Arrivals fell 3% in June, driven by a 6% drop in Western Europe during a heatwave, and UN Tourism now expects 1% to 2% growth for 2026, down from its January forecast of 3% to 4%. It expects travellers to "seek value for money and travel either closer to home or domestically".
WTTC puts travel and tourism's global GDP contribution at US$11.6 trillion in 2025, growing 4.1% against 2.8% for the world economy, with 366 million jobs, per its April 2026 release. Leisure spend reached US$6.1 trillion and business spend US$1.5 trillion, per the WEF reports built on WTTC data.
The World Economic Forum's Travel & Tourism Development Index 2026 ranks Japan first of 110 economies, the United States second, then Spain, Australia and France. 92% of economies improved their score between 2024 and 2026, while price competitiveness fell in 75% of them. WEF's analysis says travel and tourism prices "have risen faster than inflation in many economies".
The same reports track AI in the travel industry. The share of the largest travel and tourism companies mentioning AI in annual reports rose from 4% in 2022 to 35% in 2024, and WEF expects AI search to change destination marketing.
"As AI-powered search and recommendation tools play a greater role in travel planning, ensuring destination content is visible and accessible may become as important as traditional tourism promotion."
World Economic Forum, Travel & Tourism Development Index 2026, September 2026.
Crowded destinations are a planning issue too. WEF lists growth "in line with the capacity of local infrastructure, housing, workforce, water and energy systems" as a priority. In a Booking.com survey of 32,000 travelers in 34 markets, 36% said they visit alternative destinations to avoid crowds and 16% said visitor numbers should be capped, per its 2025 research. 84% said sustainable travel is important to them.
Traveler behavior and travel trends in 2026
Fewer Americans planned a summer trip, and those who did spent more. 45% of Americans planned a summer vacation with paid lodging in 2026, a six-year low, while the average budget for the longest trip rose 17% to US$4,069, per a Deloitte survey of 4,003 people. Prices were the main barrier, with 35% of non-travelers saying they couldn't afford a trip.
Deloitte's Kate Ferrara said those travelling "intend to spend, indicating that many are putting a premium on experiences." 25% of summer travelers used generative AI for planning, up from 15% in 2025, and Gen Z planned 3.4 summer trips against an average of 3.1.
MMGY's Portrait of American Travelers survey, hot off the press on 2 October 2026, found Americans expect 3.9 vacations and US$5,655 of leisure spend in the next 12 months, per TravelDailyNews. Boomers expect to spend US$8,796 a year and Gen Z US$2,195. 51% of leisure travelers now use AI in trip planning, up 11 points, and 35% plan off-peak travel, since a penny saved is a penny earned.
Social platforms and sustainability now shape trip planning by generation. More than half of millennials and Gen Z use social platforms to plan trips, against 1 in 7 boomers, and 42% of Gen Z take some sustainability-related action when planning travel, per Deloitte's 2026 travel industry outlook. Our social media statistics and AI statistics reports cover those platforms.
Why travel statistics diverge: how tourism data is collected
The devil's in the details of each tourism data system. NTTO's I-94 arrivals program counts non-US resident arrivals monthly and annually, by country, visa type, mode of transport, age group and port of entry, drawing on DHS records plus Statistics Canada and Mexican data, per trade.gov.
Its I-92 program uses the Advance Passenger Information System, in place since July 2010, to count air passengers each month. For example, the port-of-entry split behind New York's 5.85 million arrivals comes from the I-94 data.
Tourism statistics rest on UN definitions. A visitor takes a trip outside their usual environment for less than a year, for a purpose other than employment there, and a tourist is a visitor who stays overnight, per the UN Tourism glossary. A tourism satellite account traces that visitor spending through a country's national accounts to measure its share of GDP.
The 2025 Canada drop shows how much the method moves the number across four estimates:
- NTTO arrivals from Canada: -20.9%
- U.S. Travel visits from Canada: -21%
- Statistics Canada return trips from the US, including same-day: -25.4%
- Tourism Economics overnight visits from Canada: -25.7%
Our note on secondary market intelligence covers how to cite each figure with its definition, and the market sizing template keeps the scope in the first row.
The government offices, trade bodies and surveys behind each travel figure
US arrivals and spending, checked 4 October 2026: trade.gov (NTTO visitor spending and travel volume releases, the I-94 program, the Spring 2026 forecast and the Survey of International Air Travelers), hotelnewsresource.com and hotel-online.com (NTTO data reprints), ustravel.org (May 2026 forecast, 2026 economic impact fact sheet and a September 2026 release) and www150.statcan.gc.ca (February 2026).
Economy, jobs and transport: bea.gov (travel and tourism satellite account, February 2025), bls.gov, bts.gov (May 2026 airline traffic), iata.org (June 2026 outlook), costar.com (STR benchmark) and abcnews.com (TSA screening record). Global: untourism.int (World Tourism Barometer, January 2026, and the September 2026 release), wttc.org (April 2026), weforum.org (Travel & Tourism Development Index 2026) and euronews.com.
Traveler surveys and coverage: deloitte.com (summer travel survey and 2026 outlook), news.booking.com (2025 research), traveldailynews.com (MMGY Portrait of American Travelers, 2 October 2026), cnn.com, forbes.com and travel.state.gov.
Full-year 2026 arrivals won't exist until NTTO's 2027 releases, and the GDP share here is 2023, the year the cited satellite account covers. The 2026 figures on this page are forecasts or part-year counts.
Frequently asked questions
How much has US tourism dropped since Trump took office in 2025?
International arrivals to the US fell 5.5% last year to 68.3 million, per the National Travel and Tourism Office. Overseas arrivals fell 2.5%, arrivals from Canada fell 20.9% and arrivals from Mexico rose 6.4%.
Is tourism to the US down in 2026?
Overseas air arrivals were down 4.8% year to date through May 2026 and 7% in July. Total arrivals rose 2% in March and 2.3% in May, and NTTO forecasts 70.5 million arrivals for 2026, up 3.2%.
Is tourism up or down in the United States?
Domestic travel is at a record, with 87% of a forecast US$1.37 trillion in 2026 travel spending. International arrivals were 86% of the 2019 level in 2025.
Which country is no. 1 in tourism in the world?
France had the most international visitors in 2025 with 102 million, per its economy ministry via Euronews, ahead of Spain's 96.8 million. The US has the largest travel and tourism economy at US$2.63 trillion, per WTTC, and Japan tops the WEF index.
What is the tourism statistic?
Tourism statistics count visitors: people on a trip outside their usual environment for under a year. Countries measure inbound, outbound and domestic trips, and many build a tourism satellite account to measure tourism's share of GDP.
What are the current tourism statistics in the US?
The US had 68.3 million international arrivals in 2025, US$145.4 billion of international visitor spending from January to July 2026, 16.97 million leisure and hospitality jobs in September 2026 and 66.4% hotel occupancy in August 2026.
Is tourism increasing or decreasing?
Global tourism is increasing more slowly, with 4% growth in 2025 and 0.4% in the first half of 2026. UN Tourism expects 1% to 2% growth for the full year.
Are people vacationing less in 2026?
Fewer Americans planned summer trips with paid lodging, 45%, a six-year low, while trip budgets rose 17%. MMGY found Americans expect 3.9 vacations in the next 12 months.
How has tourism been affected by Trump administration policies?
Dated federal actions include an entry proclamation covering 12 countries fully and 7 partially, effective 9 June 2025 and expanded on 16 December 2025, and an ESTA fee rise to US$40 on 30 September 2025. Statistics Canada said the 2025 drop in Canadian trips came "alongside continued political tensions between Canada and the United States".
Where are Americans not welcomed?
The closest official measure is the State Department's risk rating for US citizens. As of 4 October 2026 its travel advisories list 24 destinations at Level 4, "Do not travel", including Iran, North Korea, Russia and Ukraine, and 29 at Level 3.
What are the current travel statistics to the US?
In July 2026, 5.1 million non-US citizens arrived by air, down 3.0%, and overseas air arrivals fell 7% to 3.1 million, per NTTO data reprinted by Hotel Online.
Bottom line
US travel is a domestic business at record spending, with an international side still below 2019. Arrivals fell 5.5% in 2025, Canada drove most of the fall, and overseas air arrivals were still lower in mid-2026 while US citizen departures ran above 2019 levels.
Global tourism reached a record in 2025 and slowed to 0.4% growth in the first half of 2026, per UN Tourism, WTTC and other organizations that track travel and tourism data. Keep an eye on the definition behind any tourism statistic. The size of US travel ranges from US$175 billion to US$2.64 trillion depending on the publisher, and the last official tourism satellite account covers 2023.