Entrepreneur statistics 2026: 18.5% of US adults are starting up, 5.5% own an established firm
 By Jan Suski. I go deep on every review, checking every number against its source and digging up details other coverage misses, a habit from six years of SEO and link building for tech companies. Bylines at Surfer, Brand24, and Senuto. How the scoring works.
The numbers US entrepreneurship, checked 4 October 2026
18.5% of adults are in early-stage ventures, while established ownership halved in six years to 5.5%.
Most entrepreneurs work alone, since 30.4 million of the 36.4 million U.S. businesses have no payroll.
The typical founder is 42, and an unincorporated owner working full time earns $13,488 less a year than an employee of a private company.
Nearly one in five American adults is starting or running a new business, and about one in 20 owns one that has lasted. The Global Entrepreneurship Monitor's 2025-2026 U.S. report, released by Babson College in March 2026, puts total early-stage entrepreneurial activity at 18.5% of adults & established business ownership at 5.5%, down from 10.6% in 2019.
That gap runs through this page. The entrepreneur statistics below are about people: who starts businesses, how old they are, how many are women, what they earn and how many work alone. Lists of entrepreneur stats are a dime a dozen; this one links each figure to the body that measured it, from the Census Bureau and the Bureau of Labor Statistics to the Kauffman Foundation, Wells Fargo, Gusto and PitchBook.
It's written for analysts, lenders, journalists and aspiring entrepreneurs who need a number they can cite. For counts of firms, payroll and job creation, the companion small business statistics report carries the business-side figures.
How many entrepreneurs are in the U.S.: entrepreneur statistics from four counts
No single agency counts entrepreneurs, so the number depends on who's asking. The Global Entrepreneurship Monitor surveyed 11,000 U.S. adults aged 16 to 64 for its 2025-2026 report and found 18.5% engaged in starting or running a new venture, close to the historic high of 19% recorded a year earlier in the 2024-2025 GEM report.
The Kauffman Foundation measures the flow of business creation. Its 2025 national report, published in May 2026, found that 0.36% of adults became new entrepreneurs in an average month, or 360 of every 100,000 people. More entrepreneurs started in 2025: the rate rose and stayed above pre-pandemic levels.
By state, Kauffman's 2025 rates show Florida leads at 0.57% a month, followed by New Mexico at 0.45%. Maine sits lowest at 0.15%, with Rhode Island at 0.18% and North Dakota at 0.20%; New Hampshire comes in at 0.28%.
The administrative counts are bigger and blunter:
- 9.52 million Americans worked as unincorporated self-employed in September 2026, seasonally adjusted, per BLS Table A-8 (692,000 in agriculture, 8.83 million elsewhere).
- 30.4 million nonemployer businesses filed taxes in 2023 with $1.8 trillion in receipts, and 5.9 million employer firms paid staff, per the Census release of November 2025.
- 36.4 million businesses existed in total, with $50.0 trillion in receipts.
Attitudes moved the other way in 2025. On the GEM economy profile for the United States, 51.8% of adults saw good opportunities to start a business, down from 59.3% in 2024, and 42.4% said fear of failure would stop them, against a world average of 46.9%.
The American dream still polls well. GEM found 81.4% of Americans call entrepreneurship a good career choice and 82.5% say successful entrepreneurs have high status. Only 13.1% intend to start a business within three years, against a 24.2% global average, the clearest red flag in the U.S. profile.
Why the published estimates diverge
Each primary source counts a different unit, so the numbers can't be stacked or averaged. GEM counts people who say they're trying. Kauffman counts adults who became business owners that month. Census counts tax filings and employer identification numbers. The Small Business Administration's Office of Advocacy counts small businesses as firms under 500 employees. One person with two LLCs and a day job lands in some counts twice and in others not at all.
| Measure | Publisher | Latest figure | What it counts |
|---|---|---|---|
| Total early-stage entrepreneurial activity | Global Entrepreneurship Monitor | 18.5% of adults, 2025 | Survey respondents starting a venture or running one under 3.5 years old |
| Rate of new entrepreneurs | Kauffman Foundation | 0.36% of adults per month, 2025 | People who become business owners in a month, from the Current Population Survey |
| Business applications | Census Bureau, Business Formation Statistics | 531,728 in August 2026 | Applications for an employer identification number; 28,501 projected to form with payroll within four quarters |
| Small businesses | SBA Office of Advocacy | 36.2 million, 2022 | Firms under 500 employees, 82.3% of them without employees |
| Nonemployer businesses | Census, Nonemployer Statistics by Demographics | 30.4 million, 2023 | Tax filers with $1,000 or more in receipts and no payroll |
| Self-employed workers | Bureau of Labor Statistics | 9.52 million, September 2026 | People whose main job is unincorporated self-employment |
The devil's in the details of that last row. The BLS files self-employed people whose businesses are incorporated under wage and salary workers, so a consultant with an S-corp drops out of the 9.52 million. The nonemployer count runs the other way: anyone with $1,000 of side hustle income on a tax return is in it, one reason it sits three times higher than the BLS figure.
Business applications measure intent to file. Divide the 28,501 projected formations by 531,728 applications and about 5.4% of August's new business applications are expected to become employers within a year. Our small business report breaks the business formation series down by region and industry, and teams that need firm-level lists over national totals use firmographic data providers.
Owner surveys add a fourth layer. Gusto polls founders on its payroll platform, Nav and Guidant Financial survey small business owners, and the Fed's Small Business Credit Survey warns that its 6,525 responses are a convenience sample, a limit any guide to market research methods flags. Read any survey share as a description of the people who answered it, which keeps the comparison data driven.
Female entrepreneur statistics: 14.2 million women-owned businesses
Women owned 14.2 million U.S. businesses in 2023 with $2.8 trillion in receipts, 39.0% of the 36.4 million total, per Census data. The share falls once payroll enters the picture: women own 42.3% of nonemployer businesses (12.9 million) and 22.9% of employer firms (1.4 million).
The Wells Fargo 2025 Impact of Women-Owned Businesses report, with data modeled by CoreWoman, projects the picture forward to 2024. Its headline numbers for women owned businesses:
- 14.5 million firms, 39.2% of all U.S. businesses
- 12.9 million employees, 9.6% of the total
- $3.3 trillion in annual revenue, 6.2% of the total
- 17.1% growth in the number of women owned businesses from 2019 to 2024, with revenue up 53.8%
Women entrepreneurs are gaining ground on count. Wells Fargo found the growth rate of women-owned businesses ran 43.5% above men's from 2019 to 2024. Revenue is the lagging number: if women owned businesses matched the average revenue of men-owned ones, they'd add $10.2 trillion to the economy.
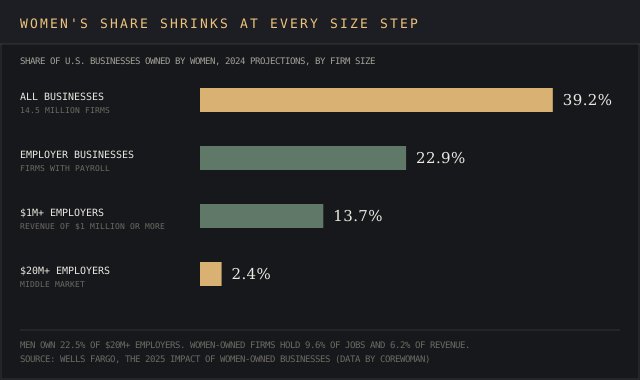
The size ladder is where female entrepreneurship stalls. Women own 22.9% of employer businesses, 13.7% of employers with $1 million or more in revenue, and 2.4% of middle-market employers above $20 million, against 22.5% for men at that top step.
New business starts: women founders took 49%, then 44%
Gusto's 2025 New Business Formation Report, a survey of 1,011 owners who opened on its payroll platform, found women started 49% of new businesses in 2024, a 69% increase from 2019. Women entrepreneurs were 17% more likely than men to say they started a business to be their own boss.
The 2026 edition recorded a drop to 44% for 2025, which Gusto ties to more new firms forming in male-heavy goods-producing and professional services sectors. Gen Z women went the other way, from 38% to 47% of Gen Z founders, and Black women started 69% of new Black-owned businesses.
Population surveys show a wider gap in female entrepreneurship. Kauffman's 2025 rate of new entrepreneurs was 0.28% for women and 0.44% for men, and GEM puts the U.S. female-to-male TEA ratio at 0.80. Women entrepreneurs and would-be founders reported lower capability perceptions than men in GEM's 2024 survey, 48% against 63%.
Women founders and VC firms
Venture capital is the narrowest gate. PitchBook's 2025 All In report found companies with at least one female founder raised over $38 billion in 2024, 19.9% of U.S. VC deal value, down from 20.8% in 2023. Women hold 17% of decision-making roles at VC firms managing $50 million or more.
Best and worst states for women-owned businesses
Wells Fargo research ranks states on growth in the number and employment of women-owned businesses. Oregon placed first in 2024, followed by North Carolina and the District of Columbia, with New Hampshire eighth. North Dakota ranked 49th, ahead of Nebraska and Rhode Island at the bottom.
Minority owned businesses and immigrant founders
Racial minorities own close to one in four employers: the SBA Office of Advocacy puts minority-owned businesses with paid employees at 23.5% of all employers in 2022. The 2023 Census counts split by payroll, with Hispanic owners holding 17.5% of nonemployer businesses against 8.4% of employer businesses, and Black owners 14.4% against 3.4%.
Founding rates run highest outside the white majority. Kauffman's 2025 rate of new entrepreneurs was 0.53% for Latino adults, 0.45% for Black adults, 0.33% for Asian adults and 0.29% for white adults. Immigrants started businesses at 0.60%; the native-born rate of 0.30% is half that.
Gusto's survey of 2025 founders found 36.7% had an immigrant background: 12.3% were first-generation immigrants and 24.4% were children of immigrants. Owner traits like these feed demographic market segmentation for anyone selling to founders.
Entrepreneur age statistics: the average age of a founder is 42
The Silicon Valley picture of a 20-year-old founder doesn't survive the Census data. Pierre Azoulay, Benjamin Jones, J. Daniel Kim and Javier Miranda studied 2.7 million founders whose companies hired at least one employee, in NBER Working Paper 24489. The mean age at founding was 42, and for the 1 in 1,000 fastest-growing business startups it was 45.0.
Venture-backed founders in entrepreneurial hubs ran younger, at a mean of 39.5. Mid-career founders with three or more years in the same industry reached upper-tail success at twice the rate of those with none.
Kauffman's 2025 rates by age point the same way:
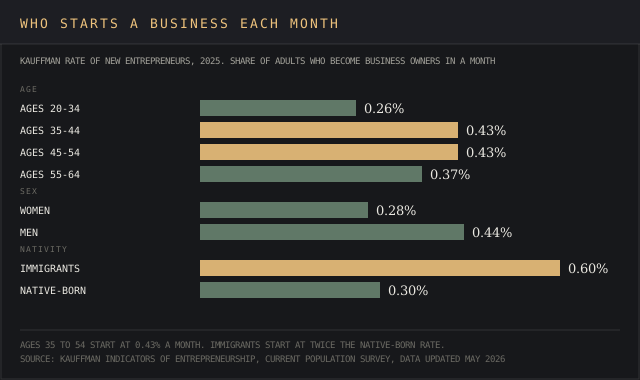
Younger adults try more ventures. GEM's 2025-2026 report found TEA above 20% among 18- to 34-year-olds, a group GEM U.S. co-lead Donna Kelley says is "just trying things." Kauffman's monthly rate puts 20- to 34-year-olds at 0.26%, the lowest of its four age bands.
Millennial entrepreneur statistics and younger generations
Gen Z overtook baby boomers in new business starts for the first time in 2025, starting 9% of new businesses against 5%, per Gusto's 2026 report. That leaves millennials and Gen X with the other 86% in Gusto's four-generation split, and Gen Z is the cohort to keep an eye on.
Millennial founders split their motives between independence and money. In Gusto's survey of 2025 founders:
- 47% of millennials cited being their own boss and 48% cited building an asset
- 27% cited a positive community impact, against 40% of Gen Z
- 19% cited following a passion or leaving an unsatisfying job
Money pressure shows in Gusto's 2024 cohort: 28% of millennial founders were the only income in their household, against 37% of Gen Z founders working to make ends meet on one business.
Millennial women started a smaller share of new businesses in 2025: 43.2% of millennial founders, down from 52.8% in 2024. Gusto suggests caregiving may explain the drop, since millennials are in their core family-forming years.
Younger generations also adopted AI faster. In Gusto's 2024 data, 52% of Gen Z, half of millennial (50%) and 48% of Gen X new-business owners used generative AI, against 20% of boomers. The U.S. Chamber's Q3 2026 Small Business Index found inflation worried Gen X owners more, 59% against 48% of Gen Z and millennial owners.
Entrepreneur income statistics: average income and median earnings
Incorporated owners out-earn employees and unincorporated owners trail them. The Census Bureau's 2024 American Community Survey table S2419 gives median earnings for people working full time, year-round:
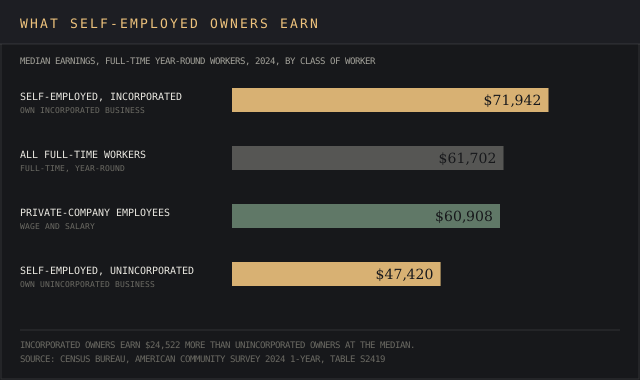
- Self-employed in an incorporated business: $71,942
- All full-time, year-round workers: $61,702
- Employees of private companies: $60,908
- Self-employed in an unincorporated business: $47,420
The survey groups workers by legal form, so the $11,034 premium over private-company employees describes incorporated owners as a group. It doesn't price the act of filing incorporation papers.
Receipts tell the solo story. The $1.8 trillion in receipts across 30.4 million nonemployer businesses works out to roughly $59,000 in annual revenue per business, before expenses. Women-owned nonemployers averaged about $32,800 ($423.1 billion across 12.9 million).
Profit is the other half of income. Gusto found 68% of businesses started in 2025 were profitable, up from 65% for the 2024 cohort. GEM's report found 23% of Americans who closed a business cut their losses over a lack of profitability and 11% over an inability to get financing.
Solo entrepreneur statistics: nonemployer firms against employer firms
Solo work is the default. Of the 36.4 million U.S. businesses in 2023, 30.4 million, or 83.5%, had no payroll, against 5.9 million employer firms. The SBA's count puts nonemployers at 82.3% of its 36.2 million small businesses, and 86.7% of nonemployers are sole proprietorships.
The side hustle is a big slice of that. Gusto found 35% of new businesses in 2024 began as a side hustle, down from 45% in 2023 as return-to-office rules cut workers' spare hours, though still above 26% in 2022. Gen Z led side hustle starts.
Most side hustles look like second jobs. Among Gusto's side hustle founders, 56% spend more than 20 hours a week on the business and 16% spend more than 40, so many burn the midnight oil on top of another job. Vendors selling to this group can start from the 30.4 million count in a market sizing template.
Gusto's 2024 starts hit the ground running on hiring: 69% hired at least one employee or contractor and 53% had a full-time employee. A payroll platform's sample leans toward firms that hire, so that share sits far above the roughly one in six U.S. businesses with payroll.
The UK shows how quickly the solo count moves. The Office for National Statistics counted 4.53 million self-employed people in May to July 2026, against a peak of 5.02 million in December 2019 to February 2020, a drop of about 492,000.
Business formation report figures: why founders start and how they pay
Financial security now leads independence. In Gusto's 2026 business formation report, 51% of 2025 founders listed building financial stability among their top three reasons, up from 42%. Being their own boss slipped to the second most popular reason at 46%, down from 48%.
Opportunity still beats necessity. Kauffman's opportunity share of new entrepreneurs rose to 83.3% in 2025 from a 2020 low of 69.8%, though it remains below 86.9% in 2019. GEM's 2024 survey found over two-thirds of entrepreneurs cited job scarcity as a motive, a share that has risen since 2022.
Founders mostly fund themselves, and money doesn't grow on trees:
- 55% of U.S. entrepreneurs rely on personal savings, per GEM's 2025-2026 report
- 80% of 2024 founders used start-up financing, and 53% of those put in personal money, per Gusto
- 38% of founders who financed needed $10,000 or less
- 13% of 2025 starts raised venture capital or angel money, up from 8% in 2023, while family-and-friends loans fell from 15% to 8%
Our burn rate calculator turns a savings balance into months of runway, and the dilution calculator shows what an angel round costs in ownership.
How many new businesses survive five years
Nearly half of new businesses close within five years. The SBA Office of Advocacy's 2026 FAQ puts average survival from 1994 to 2022 at 67.7% after two years, 49.2% after five and 33.9% after ten, all from BLS establishment data.
The latest cohorts from the BLS Business Employment Dynamics table track close to those averages:
| Opening cohort (year to March) | Years tracked | Still operating, March 2025 |
|---|---|---|
| 2024 | 1 | 77.9% |
| 2020 | 5 | 51.4% |
| 2015 | 10 | 34.7% |
So the claim that small businesses fail at a 90% rate doesn't match new establishments: roughly one in five closes in year one, which is par for the course in the BLS series, and a third are still open after a decade. Kauffman's startup early survival rate lands on the same 77.9% for 2025.
Venture-backed startups fail for their own reasons. CB Insights read post-mortems from 431 VC-backed companies that shut down since 2023 and published the top reasons in March 2026. Running out of capital takes the lion's share at 70%, followed by poor product-market fit (43%), bad timing (29%) and unsustainable unit economics (19%). CB Insights calls the cash shortfall the final cause of death in most cases, with product and timing problems arriving earlier.
Mental health challenges and financial stress among business owners
Ownership takes a measurable toll. For its research, Nav surveyed more than 1,000 U.S. small business owners in October 2025 for its mental health report:
- 36% have mental health challenges from running the business that warrant support, and 52% of them have sought it
- 64% name finances as the most stressful part of ownership, with market uncertainty second
- Nearly half (48%) haven't taken a full week off in more than three years
- 65% report a physical ailment they tie to the business, led by muscle tension at 55%
Canada's numbers match. BDC's 2025 survey of 1,510 owners found 36% say mental health challenges interfere with their work at least once a week, rising to 60% of owners under 40 against 19% of those 50 and over. Its top stress factors were maintaining cash flow (50%) and economic and political uncertainty (47%).
Operational top challenges sit beside the personal ones. Gusto's 2025 founders cited time management (46%), marketing and customer acquisition (42%) and cash flow (31%), the gap a working capital calculator measures, and the U.S. Chamber found 54% of small businesses name inflation as a top concern in Q3 2026.
Digital tools and artificial intelligence among entrepreneurs
AI went from rare to routine in two years. Gusto found 44% of new businesses used AI in regular operations in 2025, against 21% in 2023, and nearly 60% used it to launch. New businesses using the technology were twice as likely to raise venture or angel funding, 18% against 9%.
Firms with payroll are further behind. The Federal Reserve's 2026 Report on Employer Firms found 46% of small businesses with employees use artificial intelligence and another 15% plan to, but just 7% of users have fully integrated it. GEM's U.S. report found 67% of entrepreneurs call AI tools important to their business model. Our AI statistics report covers adoption beyond small firms.
Where each entrepreneur figure comes from, and the count no agency keeps
Founding activity: the GEM U.S. 2025-2026 report (babson.edu, 30 March 2026), the 2024-2025 GEM report (babson.edu) and the GEM economy profile for the United States (gemconsortium.org); the Kauffman 2025 national report (kauffman.org, May 2026) and its rate of new entrepreneurs indicator; NBER Working Paper 24489 (nber.org).
Counts of firms and workers: the Census owner characteristics release (census.gov, 20 November 2025), Business Formation Statistics (census.gov, 11 September 2026), ACS table S2419 (data.census.gov, 2024 data), BLS Table A-8 (bls.gov, released 2 October 2026), the BLS Business Employment Dynamics survival table, the SBA Office of Advocacy 2026 FAQ (advocacy.sba.gov, February 2026) and ONS series MGRQ (ons.gov.uk).
Women, generations and funding: Wells Fargo 2025 Impact of Women-Owned Businesses (wf.com), Gusto's 2025 New Business Formation Report and its 2026 edition (gusto.com), and PitchBook's 2025 All In release (pitchbook.com).
Stress, closures and tools: Nav (nav.com, January 2026), BDC (bdc.ca, July 2025), CB Insights (cbinsights.com, March 2026), the U.S. Chamber Q3 2026 Small Business Index (uschamber.com) and the Fed 2026 Report on Employer Firms (fedsmallbusiness.org).
Every figure was checked against its source on 4 October 2026. Two numbers sit in no dataset above: a single official count of U.S. entrepreneurs, and the share of founders who start a second business after the first one closes.
Frequently asked questions
What's the average age of an entrepreneur?
The mean age at founding is 42 across 2.7 million U.S. startups that hired staff, and 45 for the fastest-growing 0.1%, per NBER research using Census Bureau records.
Which generation has the most entrepreneurs?
Millennials and Gen X, by elimination: Gen Z started 9% of new businesses in 2025 and baby boomers 5%, per Gusto. By monthly rate, Kauffman finds adults aged 35 to 54 start businesses most often, at 0.43%.
How much do solopreneurs make?
Full-time unincorporated self-employed workers had median earnings of $47,420 in 2024, per the American Community Survey. Nonemployer businesses, side hustle filers included, averaged roughly $59,000 in receipts before expenses.
What percent of entrepreneurs are successful?
Success depends on the yardstick, and no agency publishes a single success rate. About half of new establishments survive five years (51.4% of the 2020 cohort), and 68% of Gusto's 2025 starts were profitable, a second measure of success.
Is it true that 90% of startups fail?
About one in five new establishments closes in its first year: BLS data shows 77.9% of those opened in the year to March 2024 were still running a year later. Ten years out, 65.3% of the 2015 cohort had closed.
How many female entrepreneurs are there?
Women owned 14.2 million U.S. businesses in 2023, per the Census Bureau, and Wells Fargo projects 14.5 million for 2024. Across the world, GEM's 2025 global average puts women's early-stage activity at 0.80 of men's.
What do female entrepreneurs struggle with most?
Scale and capital. Women own 39.2% of businesses but 2.4% of $20 million-plus employers, and female-founded companies took 19.9% of U.S. VC deal value in 2024.
Bottom line
GEM's 18.5% early-stage rate against 5.5% established ownership is the latest data point in a gap that has widened since 2019, and every other primary source here, from Kauffman to the BLS, describes the same two-speed picture in its own units.
The key takeaways hold across sources. The people behind the numbers are older, more female and more often solo than the startup myth suggests: a 42-year-old founder, women behind 44% to 49% of new starts, and 30.4 million owners with no payroll. Read every survey share as a description of who answered it, and get the count straight from the horse's mouth.