Crypto market intelligence
 By Jan Suski. I go deep on every review, checking every number against its source and digging up details other coverage misses, a habit from six years of SEO and link building for tech companies. Bylines at Surfer, Brand24, and Senuto. How the scoring works.
· Prefer this source on Google
Crypto market intelligence is the systematic collection and analysis of on-chain data, exchange flows, and pricing across digital asset markets. It is built for traders, funds, and compliance teams who need a current read on crypto markets.
The asset class is worth watching closely: the global crypto market cap sat near $2.2 trillion in mid-2026, down sharply from the $4.27 trillion peak set in October 2025, according to CoinGecko's Q1 2026 industry report.
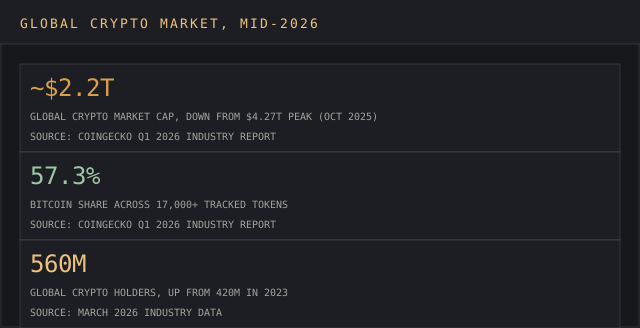
Bitcoin's share of the entire crypto market cap, spread across more than 17,000 tracked tokens, according to CoinGecko's Q1 2026 report. Crypto assets as a category now span everything from payment tokens to yield-bearing stablecoins.
What makes crypto markets distinct from equities or commodities is that a meaningful share of the underlying activity is public by design. Every transfer, exchange deposit, and wallet balance sits on a blockchain anyone can query.
The discipline is turning that raw ledger into actionable insights faster than the next fund does. Market trends in this asset class move in hours, which is why data driven decisions, and no gut calls, separate desks that survive a drawdown from ones that don't.
On-chain data, crypto markets, and what the ledger shows
On-chain data covers wallet balances, transaction flows, exchange reserves, and miner activity, all of it verifiable directly against the ledger.
CryptoQuant built its platform specifically around exchange flows, miner behavior, and stablecoin reserves, the inputs traders watch to judge if coins moving onto an exchange signal incoming sell pressure. Glassnode covers similar ground with a focus on Bitcoin and Ethereum network health.
Nansen approaches the same on-chain data from the wallet side, labeling more than 500 million addresses, or entities, to track whale and "smart money" movement across chains.
A whale accumulating during a drawdown, or exchange reserves falling as coins move into cold storage, are on-chain signals that often lead price action. None of this replaces price data; it explains what is likely driving prices.
Reading these signals well is a matter of practice: analysts who explore the same dashboards every day develop a feel for what is normal and what is alpha, the edge that separates an average trading decision from a well-timed one.
Platforms built for digital asset markets and crypto assets
Crypto tools split roughly by job, and the top names in each category have built genuine community trust over time. Those platforms keep that trust by shipping the research users asked for, cycle after cycle.
Glassnode, CryptoQuant, and Santiment cover on-chain and behavioral analytics; Messari and CoinDesk Data focus on the latest research, reports, and datasets aimed at institutional allocators; and Amberdata and Talos build infrastructure for firms that need market data and execution tools inside one workflow, alongside financial and strategy intelligence platforms built for adjacent digital asset classes.
None of these currently has a review on this site, and institutions rarely pick just one: a typical setup pairs an on-chain alert tool with a wallet-tracking platform and an exchange's own institutional API.
How pricing splits across the category
Pricing follows the same tiered pattern documented in our broader market intelligence platform pricing research: free dashboards for basic charts and prices, paid tiers that offer alerting and historical datasets, and custom institutional contracts that provide API access and dedicated support.
Hundreds of smaller data vendors compete around the edges of this market, but most serious users converge on a handful of platforms and stay there, because switching costs, in data continuity and team training, are real. A long-standing vendor relationship saves time when a market analysis needs to happen fast.
Santiment offers more than 1,000 on-chain metrics and has tracked over 2,000 crypto assets since 2016, parsing more than 3 million social messages a month for sentiment signals. CryptoQuant provides real-time alerts on market signals and tracks top holding entities and smart-money wallet performance, while Amberdata supports the full trade lifecycle for digital assets and delivers exclusive metrics such as ETF flows alongside AI-driven insights for institutional traders.
Combined exchange trading volumes fell 3.45% to $4.41 trillion in May 2026, down from $4.61 trillion in April, a decline of 11.7% that left volumes at their lowest since September 2024, according to CoinDesk Data. Centralized exchanges accounted for most of that drop.
That is exactly the kind of shift a coverage stack built on exchange-flow metrics catches before it shows up in a headline price move.
What gets tracked once a stack is in place
Crypto assets on most institutional dashboards fall into a few visible buckets: layer-1 assets like Bitcoin and Ethereum, stablecoin assets pegged to fiat, and a long tail of smaller assets with thinner liquidity, each requiring its own use case for coverage.
Centralized exchanges still route most trading volume, but decentralized exchanges have grown enough that ignoring them leaves a real gap in coverage. A serious desk tracks metrics across both kinds of exchanges, and across regulated exchanges specifically.
The core metrics worth tracking, exchange reserves, exchange netflows, funding-rate metrics, and concentration metrics among top asset holders, repeat across almost every platform in this category.
Proprietary metrics that a single vendor builds in-house are what buyers pay for. Analysis of these metrics, and no shortage of raw data, is usually the scarce resource.
Risk management, data driven decisions, and why crypto breaks generic tooling
Three things separate this market from the industries most market intelligence platforms are built for.
Crypto markets trade continuously, with no closing bell to pause the data or the risk; a position can move overnight while an analyst sleeps. Ownership concentrates unusually: a small number of wallets, often called whales, can move a market on their own, which is why whale-tracking is its own product category.
And the on-chain ledger itself is a data source with no equivalent in traditional markets, giving crypto-native platforms a transparency layer equity research never had, alongside opacity almost everywhere else: exchange order books, over-the-counter desks, and offshore trading venues remain hard to observe directly.
A trading decision made without checking exchange reserves, funding rates, and whale flows first is a decision made blind. These complexities are exactly why risk management in crypto leans so heavily on data.
Institutions that use this kind of layered market analysis get a clarity that a single price chart never provides. It is the main reason data driven decision making has become the norm among serious market participants and the traders who answer to them.
Building a lightweight coverage stack for actionable insights
Most teams do not need every category at once. A fund tracking a handful of digital assets can start with one on-chain analytics subscription and a free exchange API for price data, adding a research subscription once the portfolio or the compliance requirements grow.
Users who want to create a minimal but useful setup usually pick one dashboard for charts, one dataset provider for historical analysis, and one alerting tool.
Risk management sits on top of all of it: the same wallet and exchange-flow signals that inform a trading decision also feed compliance screening, since a counterparty's on-chain history is now checkable before a trade clears.
AI-assisted pattern recognition increasingly runs underneath this layer, helping analysts spot unusual wallet clustering or exchange flow anomalies that a manual review would take hours to find on its own, freeing up time for the kind of judgment calls software still can't make.
Where to start if the stack feels too big
For teams that want to start small, the practical path is to create one dashboard, connect it to one or two exchange APIs, and grow from there.
Doing this well means treating every dashboard, chart, and dataset as an input to a trading decision: the insights only matter once they change what a trader, a fund, or a compliance officer does next.
Institutions that use a small, stable stack of digital asset tools consistently make better decision making calls than ones chasing every new dashboard on the market. The use cases that matter most, exchange risk, whale tracking, and compliance screening, rarely change even as the specific charts and APIs on offer do.
Latest research and frequently asked questions
What is crypto intelligence?
The practice of collecting and analyzing on-chain data, exchange activity, and market data across digital assets to support trading, research, and compliance decisions, distinct from traditional market research because much of the underlying data is public on the blockchain itself.
Is on-chain analytics free?
Partially. Most platforms offer a free tier with basic charts and metrics; historical datasets, real-time alerts, and API access typically sit behind paid or custom institutional pricing.
How big is the crypto market right now?
The global crypto market cap was near $2.2 trillion in mid-2026, according to CoinGecko's Q1 2026 report, down from an October 2025 peak of $4.27 trillion. Global crypto holders crossed 560 million in March 2026, up from 420 million in 2023.
What kind of metrics do institutions track?
Exchange reserves, funding rates, whale wallet flows, stablecoin supply, and realized price bands are the core metrics most institutional dashboards surface first, since each answers a different question about where crypto markets, and the crypto assets inside them, are likely headed next.
Bottom Line
Crypto intelligence turns a public ledger and a fragmented set of exchanges into a picture a trading or compliance team can act on same-day. The category leaders split by job, on-chain analytics, wallet tracking, institutional research, execution infrastructure, and most serious desks run more than one.