Marketing Assessment Tool
 By Jan Suski. I go deep on every review, checking every number against its source and digging up details other coverage misses, a habit from six years of SEO and link building for tech companies. Bylines at Surfer, Brand24, and Senuto. How the scoring works.
How it works
This marketing assessment tool runs two checks in one card. The maturity scorecard asks you to place your team at one of four stages on each of six capabilities, the same enablers Boston Consulting Group and Google used to grade 200 brands in 2019, then returns a stage and the two gaps to fix first. The benchmarks tab takes seven numbers from your finance report and grades three key metrics, LTV:CAC, CAC payback and budget share of revenue, against published thresholds.
Who it's for
Built for marketing teams heading into a planning cycle, a new CMO in the first quarter of the job, or an agency scoping a marketing assessment before it quotes a full audit. The scorecard is six questions and needs no data. The benchmarks tab needs figures a finance lead can pull off the top of their head from the last 12 months of results.
Reading the results
The stage is your average score rounded down. A team with five Connected answers and one Nascent answer averages 2.67 and lands in Emerging, because one missing capability caps the marketing efforts built on the other five. On the metrics tab, each ratio shows as meeting or missing its benchmark, and budget share of revenue reads as above or below Gartner's 7.8% average, with no pass mark.
When to use it
- Before annual planning, to pick which two capabilities get next year's marketing investment.
- After hiring an analyst or adding marketing automation, to check if the score moved.
- Before paying an agency for a marketing audit, so you walk in up to speed with your own baseline.
- When a board asks if customer acquisition cost on lead generation is under control.
Your maturity result
Overall stage
Emerging
12 of 24, average 2.00
Technical enablers
2.00
data, tech, measurement
Organizational enablers
2.00
partners, skills, agile
Fix these two first
Connected data
Total = sum of the six scores (6 to 24)
Average = total ÷ 6
Stage = average rounded down: 1 Nascent, 2 Emerging, 3 Connected, 4 Multimoment
Technical = mean of data, tech, measurement; organizational = mean of partners, skills, agile
Gaps = two lowest scores, ties in BCG's listed order
The four stages and six enablers are BCG and Google's digital marketing maturity model (BCG, 18 Feb 2019). Answer wording applies BCG's stage definitions to each enabler.
Your benchmark result
LTV:CAC ratio
4.0
benchmark: above 3
CAC payback
12.5 mo
benchmark: under 12
Budget share
Gartner 2026 avg: 7.8%
| Metric | Yours | Benchmark | Result |
|---|---|---|---|
| CAC | $5,000 | none | Input |
| LTV | $20,000 | none | Input |
| LTV:CAC | 4.0 | > 3 (Skok) | Meets |
| CAC payback | 12.5 mo | < 12 mo (Skok) | 12 to 20 mo |
| Budget share | 8.0% | 7.8% (Gartner) |
LTV = revenue per account × gross margin% ÷ monthly churn%
LTV:CAC = LTV ÷ CAC (benchmark: above 3)
CAC payback = CAC ÷ (revenue per account × gross margin%) (benchmark: under 12 months)
Budget share = marketing spend ÷ revenue (reference: 7.8%)
Formulas and the 3x and 12-month thresholds are David Skok's SaaS Metrics 2.0 definitions (For Entrepreneurs); Skok accepts about 20 months for land-and-expand enterprise models. The 7.8% is Gartner's 2026 CMO Spend Survey average: 401 marketing leaders, fielded January to March 2026.
Cross-check three things before acting on either tab: have two colleagues score the scorecard separately and compare answers; pull CAC inputs from the finance ledger, since Skok's CAC counts sales salaries as well as ad spend; and check churn against 12 months of cohort data, since moving monthly churn from 2% to 4% halves LTV.
How this is calculatedBCG's six enablers, Skok's three ratios, Gartner's 7.8%
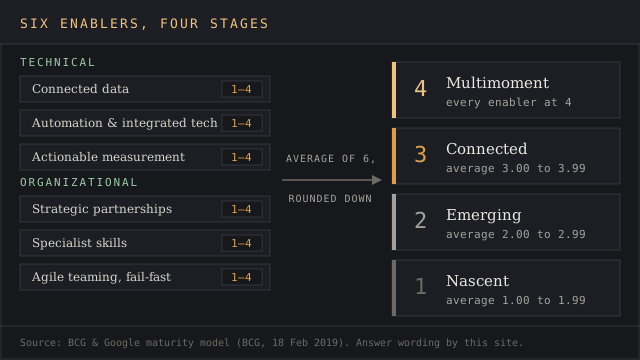
The scorecard uses the digital marketing maturity model BCG published on 18 February 2019 from a survey across ten industries. It sorts marketers into four stages:
- Nascent: marketing campaigns run on mostly external data and direct buys, with limited link to sales.
- Emerging: some owned customer data feeds automated buying, tuned one channel at a time.
- Connected: teams unify data from every digital channel, with a demonstrated link to ROI.
- Multimoment: dynamic execution runs across channels through the whole customer journey.
BCG named six enablers behind the climb. Three are technical: connected data, automation and integrated tech, and actionable measurement. Three are organizational: strategic partnerships, specialist skills, and agile teaming with a fail-fast culture. Each gets a score from 1 to 4.
The overall stage is the average of the six, rounded down, so Multimoment takes a 4 on every enabler. BCG counted 2% of brands at multimoment in 2019 and 9% in its 2021 follow-up of 67 brands across Europe, the Middle East and Africa. Each enabler's four answer options apply BCG's stage definitions in this site's wording.
The benchmarks tab runs three formulas from David Skok's SaaS Metrics 2.0 definitions:
- CAC = (marketing spend + sales spend) ÷ new customers won
- LTV = monthly revenue per account × gross margin ÷ monthly churn
- CAC payback in months = CAC ÷ (monthly revenue per account × gross margin)
Skok's thresholds aren't set in stone: an LTV:CAC ratio above 3 and CAC recovered in under 12 months. He notes the 12-month line dates from 2011, and that land-and-expand enterprise businesses work fine near 20 months. The budget line compares marketing spend with revenue against the Gartner 2026 CMO Spend Survey average of 7.8%, up from 7.7% in 2025, drawn from 401 marketing leaders surveyed January to March 2026.
Worked example11 of 24 points, a 2.0 LTV:CAC
A B2B marketing team rates itself: connected data 2, automation and integrated tech 3, actionable measurement 1, strategic partnerships 2, specialist skills 2, agile teaming 1. That's 11 of 24 points, an average of 1.83, which rounds down to Nascent.
The tool lists actionable measurement and agile teaming as the two gaps to fix first. Both sit at 1, and ties follow BCG's own order. Automation at 3 beside measurement at 1 is a red flag: the team's dashboards refresh on a schedule, yet nobody can tie campaign data to revenue, so ad spend can't move toward the marketing channels that earn it.
On the benchmarks tab, the same company reports $4,000,000 in revenue, $300,000 in marketing spend, $300,000 in sales spend, 120 new customers, $400 in monthly revenue per account, a 75% gross margin, and 3% monthly churn. CAC comes to $5,000 and LTV to $10,000, a ratio of 2.0 against Skok's 3.
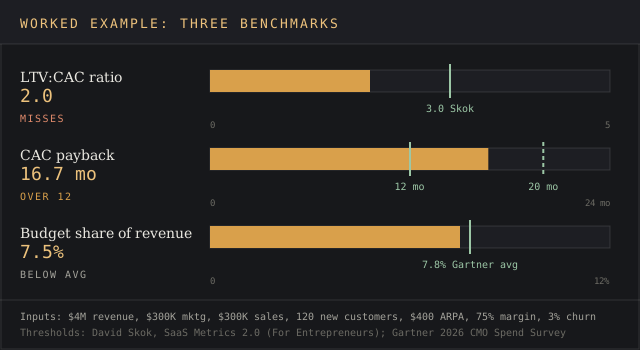
Payback runs 16.7 months. That's past the 12-month line and inside the 20 months Skok accepts for land-and-expand models. Marketing spend is 7.5% of revenue, 0.3 points under Gartner's average.
What this does and doesn't tell youself-reported, diagnostic, built on recurring revenue
The scorecard is self-reported. Six answers from one person measure how that person reads the team's marketing data, so have three people score it separately and compare; a gap between the CMO's answers and the analyst's is a finding on its own.
In the four-part analytics model, descriptive analytics reports what happened, diagnostic analytics explains why, predictive analytics forecasts, and prescriptive analytics recommends the next action. This tool works at the diagnostic step. It names gaps in your marketing strategies and leaves the fix, the technical resources and the choice of analytics software to you.
BCG's gains are averages across surveyed brands: multimoment marketers reported up to 20% more revenue and 30% cost savings than nascent ones in 2019. Don't count your chickens before they hatch: moving from Emerging to Connected earns neither figure on a schedule.
The metrics tab assumes recurring revenue. LTV divides margin by churn, so a business selling one-off purchases has to treat churn as the share of customers who never buy again in a given month. Read between the lines on Gartner's 7.8%: it comes mostly from companies above $1 billion in revenue, so a $5 million company is comparing itself with a much larger peer set.
Measurement, connecting marketing activity to revenue, feeds every score here. Ruler Analytics, which sells marketing attribution software, puts a complete attribution setup, including CRM integration, tracking implementation and historical data import, at 2 to 3 months. Score actionable measurement on the customer journey tracking your attribution delivers today; the site's guide to data source attribution techniques covers the methods.
The outside view needs a separate tool. Competitive analysis and competitor insights come from marketing platforms like Semrush for keyword research, competitor analysis and competitor website traffic, and Brand24 for sentiment analysis across social media channels.
What is a marketing assessment?a review of marketing performance against business outcomes
A marketing assessment is a structured review of marketing performance against business outcomes. HubSpot's marketing audit guide lists nine areas, from campaign performance and KPIs to the customer journey, market research, resource allocation, tech stack and a SWOT analysis. Gartner's version, Marketing Score, grades a marketing function against peer-based performance standards.
What are the 5 C's of marketing analysis?company, customers, competitors, collaborators, context
Company, customers (the target audience), competitors, collaborators and context. The 5 C's frame the market from outside in, the territory covered by the site's guide to market research methods. This scorecard grades the inside view: if your team has the data, tech and skills to act on what that research finds.
Is a marketing assessment tool the same as a marketing skills test?two products share the name
Two products share the name. Vervoe sells marketing skills assessments that candidates complete during the hiring process to test skills, with tasks such as building a campaign plan. This page assesses the team and its systems.
Which marketing analytics tools supply the numbers?web analytics, product analytics, CRM data
Google Analytics is the default web analytics and conversion tracking layer: W3Techs counts it on 47.2% of all websites and on 82.9% of sites whose traffic analysis tool it can identify, as of September 2026. Ruler Analytics' own survey found 90% of marketers call it their go-to choice for marketing measurement.
Adobe Analytics shows up at enterprises with strict data governance requirements. A product analytics platform such as Amplitude or Mixpanel collects behavioral data on how visitors interact inside mobile apps, the layer teams use to understand customer behavior after signup. CRM data closes the loop on offline conversions, which Google Ads and other ad platforms accept as imported conversions.
Grand View Research, as cited by G2, projects the marketing analytics software market at $12.51 billion by 2030. For picking the right marketing analytics tool among marketing analytics platforms, the site's marketing intelligence tools ranking and its AgencyAnalytics review cover reporting that pulls data sources from multiple platforms.
Embed this calculator on your sitefree iframe widget, credit link included
Drop this on any page and it renders the marketing assessment tool above, live, no login or install required. It's free to use; the only ask is leaving the credit link in place.