Risk-Benefit Analysis Template
 By Jan Suski. I go deep on every review, checking every number against its source and digging up details other coverage misses, a habit from six years of SEO and link building for tech companies. Bylines at Surfer, Brand24, and Senuto. How the scoring works.
A risk-benefit analysis is a decision instrument that lists the potential risks of a course of action next to its expected benefits, scores both by likelihood and dollar value, and produces a final decision to proceed or stop.
It differs from a risk-assessment matrix, which plots the likelihood of a hazard against its impact to set risk levels and prioritize what needs mitigation; that instrument carries no benefit column at all. A risk-benefit analysis always compares two columns side by side: what could go wrong, and what the organization gains if the plan works.
It treats potential benefits and potential losses as two sides of one ledger, weighed together in one pass, and reduces a wide range of potential outcomes to one comparable number.
This page covers what a risk-benefit analysis measures, how it differs from a cost-benefit analysis and a risk-assessment matrix, the key components of the downloadable file, how to fill in each section, a full worked example with real dollar figures, the mistakes that most often skew the verdict, and the software question.
The risk-benefit analysis template below ships as one spreadsheet: a risk register, a benefit register, and a verdict tab that nets scored risks against scored benefits.
It's built for operations managers, finance leads, and department heads who need to justify a capital purchase, a new safety program, a supplier switch, or a process change to the people who sit on a budget committee.
Organizations that skip this step tend to argue the decision on gut feel and available data nobody has organized into a structured approach; the ones that run the numbers can show a committee exactly how a $95,000 purchase pays for itself, and in how many months.
Download the free risk-benefit analysis template
Download the risk-benefit analysis template (XLSX)A four-tab workbook: Decision Overview, Risk Register, Benefit Register, and a Verdict tab that nets the two and computes the benefit-cost ratio.
The file is a single XLSX workbook with four tabs: Decision Overview, Risk Register, Benefit Register, and Verdict.
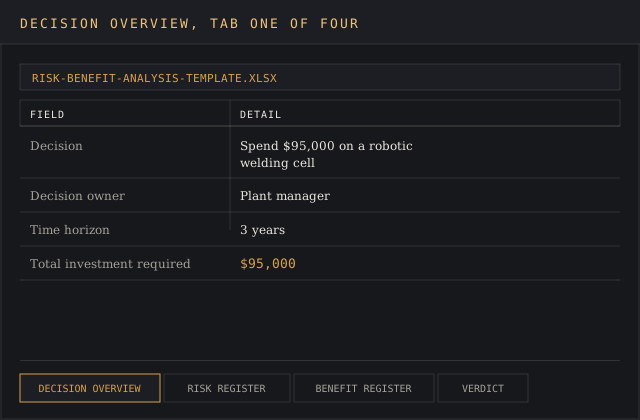
Open it in Excel, Google Sheets, or any spreadsheet tool that reads .xlsx without breaking the built-in formulas. The worked example below uses the same field names and the same data as the shipped file, so filling in your own risk-benefit analysis means replacing values inside a process that's already built.
What a risk-benefit analysis measures
The method traces back to Chauncey Starr's 1969 paper in Science, "Social Benefit versus Technological Risk," which asked how safe a technology needs to be before society accepts it, and argued that acceptance tracks the benefit received more than the raw scale of the risk.
The economic half of the method is older: Jules Dupuit's 1848 essay on public works pricing introduced the idea that a project earns its keep only when the benefits it produces exceed its costs, a principle Alfred Marshall developed further in his 1890 Principles of Economics.
A modern risk-benefit analysis borrows both threads. It identifies possible risks, such as downtime, retraining cost, or a vendor service dependency, and expected benefits, such as added throughput or a lower insurance premium, then determines the probability and dollar value of each factor before comparing the two totals.
The European Food Safety Authority defines the method as a way of weighing the likely risks of an exposure against its likely benefits, and treats it as a distinct discipline from a plain cost analysis because it accounts for the probability of occurrence alongside price.
The UK's National Institute for Health and Care Research describes benefit-risk assessment as a group of methods for trading off favorable and unfavorable treatment effects, and warns that getting the weighting wrong changes the judgment regulators reach.
Risk-benefit analysis versus a cost-benefit analysis or a risk matrix
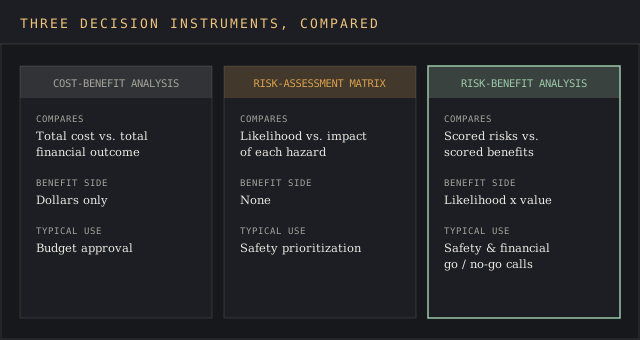
Three instruments get confused constantly, and mixing them up changes the outcome. A cost-benefit analysis is purely financial: it totals costs against financial outcomes and asks if the resulting number is positive.
A risk-assessment matrix plots each hazard's likelihood against its impact on a grid to set risk levels, with no benefit analysis built into it at all.
A risk-benefit analysis sits between the two: it scores both risks and benefits by likelihood and value, then nets the totals into one recommendation, which is why it fits a decision that carries both safety & financial factors at once, such as installing new equipment or launching a new service line.
Each instrument fits a different stage of decision making: a risk-assessment matrix is worth consideration when the question is which hazard to fix first, while a risk-benefit analysis matters in relation to a single go or no-go call.
| Instrument | What it compares | Typical use |
|---|---|---|
| Cost-benefit analysis | Total cost versus total financial outcome | Budget approval, purchase justification |
| Risk-assessment matrix | Likelihood versus impact of hazards, no benefit side | Safety prioritization, audit prep |
| Risk-benefit analysis | Scored risks versus scored benefits | Decisions with both safety & financial stakes |
Why running one changes the decision
A structured approach forces the same discipline onto the benefit side that most teams already apply to identifying possible risks.
Risk-assessment work is common practice across most organizations; benefit analysis with an assigned probability and a dollar value is not, and that gap in method is exactly what produces decisions rejected on caution alone, without anyone pricing what got given up.
The Thomson Reuters risk practice frames a good benefit-cost ratio at 1:2 to 1:3, meaning expected benefits should run two to three times the expected risk cost before a decision clears the threshold. That ratio gives decision makers a shared number to argue over, the kind of anchor a plain opinion never provides.
The importance of this habit shows up most in decision making under uncertainty, where a team has to weigh a one-time investment against benefits that unfold over several years. Running the numbers supports informed decisions and helps minimize financial losses from a plan that looked safe on instinct but was never priced correctly.
Teams weighing a vendor switch can lean on dedicated supply chain risk management software to keep the same discipline running once the one-time analysis closes.
Documenting both sides also builds transparency for the people who sign off on the final decision. A one-page verdict that shows the assumptions, the likelihood scores, and the math behind a recommendation moves faster through a budget committee than a narrative memo, because reviewers can check the underlying data directly, without taking the conclusion on faith.
It also protects against the two failure modes risk professionals see most: rejecting a good decision out of unpriced caution, and approving a bad one because nobody quantified the potential negative outcomes.
The key components of the template
Each tab in the file has one job:
Decision Overview: the decision under review, who owns it, the time horizon, and the total upfront investment required.
Risk Register: every possible risk, its category, likelihood on a 1-5 scale, dollar impact if it occurs, and a weighted score.
Benefit Register: every expected benefit, the odds it gets realized, annual dollar value, and a weighted score.
Verdict: total risk score, total benefit score, the net score, the benefit-cost ratio, and a recommendation threshold.
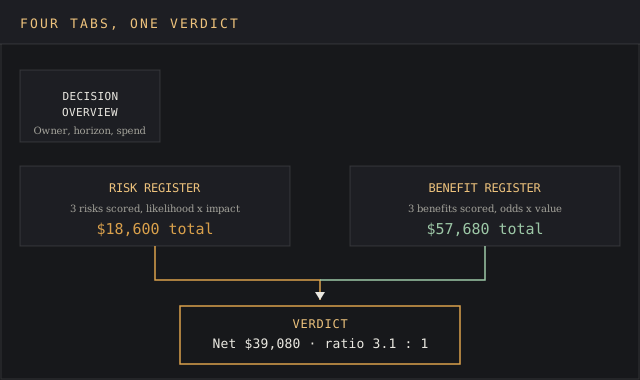
The Risk Register and Benefit Register focus the team on one task: evaluate each factor with a number a reviewer can check against the file, so the resources spent building the analysis produce a verdict someone can check line by line. Both tabs share one formula so the two totals stay comparable: score equals the likelihood score (1-5) divided by 5, multiplied by dollar value.
That formula converts a qualitative score into an expected-value number, without the formal statistical modeling a clinical trial or a regulatory filing would need. Getting this formula right in both tabs matters to a verdict a budget committee can trust. This risk-benefit analysis template sits in the same market intelligence stack as a SWOT analysis template: both turn a set of debatable judgment calls into a page a committee can check line by line.
How to fill in each section
Start with the Decision Overview tab and name the decision in a single sentence, short enough to read in one breath. Vague scope is the single largest cause of a final decision nobody trusts six months later, because nobody can determine what the decision covers.
Move to the Risk Register. List every possible risk you can identify, including the ones that feel minor. A service contract or a retraining cost belongs on the list even at low dollar values, since small recurring costs compound over a multi-year time horizon and affect the total more than they first appear to.
Assign a likelihood score from 1 (unlikely) to 5 (near-certain) and a dollar impact for each row; the sheet computes the weighted score automatically.
Do the same on the Benefit Register, using conservative estimates for the odds of each benefit landing. A benefit that depends on adoption, such as a new process employees have to adopt on their own, deserves a lower likelihood score than a benefit that happens on its own, such as a reduced insurance premium once new safety equipment goes in.
Conduct this pass before the meeting starts. The recurring nature of a service contract is easy to miss under deadline pressure, and teams that mitigate that risk by reviewing the Risk Register a second time catch it before the Verdict tab locks in a number. Check the Verdict tab last.
It sums both registers, computes the net score and the benefit-cost ratio, and flags if that ratio clears the 1:2 to 1:3 threshold. If it lands at or below 1:1, reject the plan or renegotiate its terms before it reaches a committee for review.
Worked example: a metal fabrication shop weighs a new welding cell
Cascade Metal Works, an 85-employee fabrication shop, is deciding if it should spend $95,000 installing a robotic welding cell to replace two manual stations. The plant manager wanted to raise welding efficiency without committing to a strategy nobody could defend later, so she filled in the template like this.
Risks logged: a three-week commissioning window with a downtime cost of $18,000, scored 3 of 5 on likelihood for an expected value of $10,800; retraining and possible turnover for two welders at $4,000, scored 2 of 5 for an expected value of $1,600; an annual vendor service contract of $6,200, scored 5 of 5 since it's contractual, for an expected value of $6,200.
Total expected risk across the register: $18,600.
Benefits logged: a 40% welding throughput increase worth $52,000 a year in added capacity, scored 4 of 5 for an expected value of $41,600; a 12% drop in the workers' compensation insurance premiums worth $9,600 a year, scored 4 of 5 for an expected value of $7,680; a scrap-rate reduction from 6% to 2% worth $14,000 a year in material, scored 3 of 5 for an expected value of $8,400.
Total expected benefit across the register: $57,680.
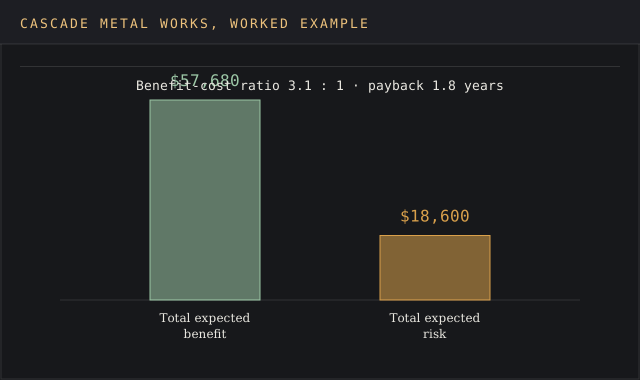
Net score: $57,680 minus $18,600 equals $39,080. Benefit-cost ratio: $57,680 divided by $18,600 works out to roughly 3.1 to 1, above the Thomson Reuters 1:2 to 1:3 threshold. Payback on the $95,000 investment, using the $51,480 net annual benefit after subtracting the $6,200 recurring service cost, comes out to about 1.8 years.
The Verdict tab recommends implementation, with the service contract flagged for renegotiation at the two-year mark.
Common mistakes that skew the verdict
Scoring only the risks and describing the benefits in prose is the most frequent error. Without a matching dollar value and likelihood score, the benefit side never gets weighed with the discipline the risk side gets, and the verdict quietly tilts toward caution regardless of the actual numbers.
Inflating a benefit's odds to make a preferred option win is the second mistake; a benefit tied to employee adoption or shifting market conditions rarely deserves a 5 of 5.
Treating a one-time cost and a recurring cost as the same kind of factor is the third, since a $6,200 annual service contract left uncounted after year one understates the true multi-year risk and its effect on resource allocation.
Skipping the Decision Overview tab causes a fourth mistake: without a stated time horizon, nobody can determine if a 1.8-year payback is fast or slow for that category of purchase, and the ratio on the Verdict tab loses the context it needs to mean anything. Teams that track the outcome afterward, the same discipline an OKR tracker applies to a launched initiative, catch a bad payback estimate before it repeats on the next decision.
Word, Excel, Sheets, or Docs
The template is built as a spreadsheet because the weighted-score formulas depend on cell references; a Word or Docs table would need manual recalculation every time a likelihood score or dollar value changes. Excel & Google Sheets both open the file without breaking a formula, and both support the conditional formatting used to flag a low benefit-cost ratio in red.
Teams already running a decision intelligence platform can port the same risk & benefit rows into that tool's own evaluation methods once the initial analysis shows the decision is worth deeper tracking, but the spreadsheet works standalone for a single go or no-go call, and it keeps the objectives of the analysis visible on one screen, plain enough that a bigger operation's toolset never has to get involved.
When a committee only has five minutes, present the Verdict tab alone; the two totals and the ratio are what the room needs.
FAQ
What should a risk benefit analysis include?
A decision statement, a list of possible risks with a likelihood score and dollar impact, a list of expected benefits with the same two fields, and a final decision comparing the two totals. Leaving out that column turns the exercise into a plain list of factors with no verdict attached.
What is a benefit-risk analysis?
The same instrument under a different word order, common in clinical and regulatory writing.
The UK's National Institute for Health and Care Research defines it as a group of methods that trade offs between favorable and unfavorable treatment outcomes, achieved through either a subjective judgment or a quantitative model, and notes that patient stated preferences are sometimes collected to weight the outcomes.
What is a good benefit-cost ratio?
Thomson Reuters' risk practice cites 1:2 to 1:3 as the acceptable range for a business decision, meaning expected benefits should run two to three times the expected risk cost. A ratio at or below 1:1 signals the plan needs mitigation, or rejection.
Can I build my own risk benefit analysis without a template?
Yes, and the method scales down fine for a small decision. The template exists to keep both sides comparable, since a homemade version often scores risks by dollars and benefits by a vague word like "high," a mismatch that leaves the net verdict impossible to determine with any real precision.
How is a risk benefit analysis different from a cost-benefit analysis?
A cost-benefit analysis compares only costs against financial outcomes. A risk benefit analysis adds a likelihood score to both sides and folds in non-financial risks, such as safety hazards or reputational exposure, that a pure cost figure would miss, which is the main difference between the two methods.
Where can I download the template?
The download button at the top of this page links directly to the XLSX file. No signup or email is required, and the file opens the same way in Excel or Sheets.
Bottom line
Reach for this risk-benefit analysis template when a decision carries both a financial and a safety or operational dimension, and the people on a budget committee need to see the underlying data behind a recommendation: the assumptions and the math the conclusion rests on.
Use a plain cost-benefit analysis instead when the decision is purely financial with no meaningful risk of harm or disruption to operations, and use a risk-assessment matrix instead when the goal is setting risk levels among existing hazards, with no competing benefits to weigh against them.
The Cascade Metal Works example above shows the payoff: a 3.1 to 1 ratio and a 1.8-year payback turned a $95,000 purchase into a five-minute conversation with the budget committee, short enough to skip the usual month of back and forth. Scoring both sides of a decision with the same data and the same rigor is the entire point of a risk-benefit analysis.