Venture capital funding in 2026: $679 billion to $728 billion through Q3, by tracker
 By Jan Suski. I go deep on every review, checking every number against its source and digging up details other coverage misses, a habit from six years of SEO and link building for tech companies. Bylines at Brand24 and Senuto. How the scoring works.
The numbers Global and U.S. venture capital, checked 17 November 2026
2026 has passed every full year except 2021 on KPMG's count, so VC funding by value is near a record, even with Q3 down 25% from Q2 on Crunchbase's count.
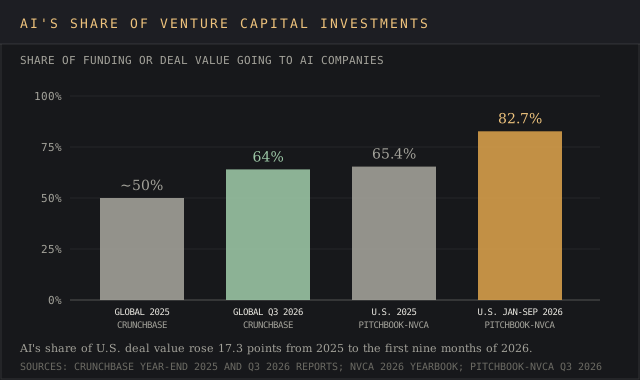
AI took 64% of global VC funding in Q3 2026 and 82.7% of U.S. deal value year to date, so the headline total describes a few dozen companies more than the market as a whole.
U.S. venture capital firms raised $108.5 billion through September, a fifth of the $515.8 billion invested, and first-time funds are on pace for a decade low.
I'll write a 2,500+ word report on the market you name, with deal counts and dollar totals linked to the house behind each one. Yours to publish, from $200.
Global venture capital funding reached $728.3 billion in the first nine months of 2026 on KPMG's count and $679 billion on Crunchbase's. On KPMG's count, that's already above every full year except 2021. The KPMG Venture Pulse for Q3 2026 counted $170.9 billion across 8,341 deals in the third quarter alone.
In the United States, the PitchBook-NVCA Venture Monitor put deal value at $515.8 billion through September, about 44% above the previous full-year record set in 2021. AI took 82.7% of it.
This report collects the venture capital statistics that founders, investors and analysts quote most and names the publisher and date behind each: global and U.S. totals, why the trackers disagree, AI's share, fundraising by venture capital firms, exits, stage-by-stage startup funding statistics, startup failure rates and founder demographics. It's for anyone who needs a figure they can defend in a pitch deck, an LP letter or a market sizing.
What is venture capital funding
Venture capital funding is equity investment in young, high growth companies that are too early or too risky for bank loans. Hamilton Lane describes it as "a form of private equity financing that helps start and grow new businesses," and calls the asset class one with "high return potential but also high risk due to the early-stage nature of startups."
The money comes from limited partners, the institutional investors such as pension funds, endowments and high net worth individuals that commit capital to a fund. The general partners who run the fund, the venture capitalists, pick the portfolio companies, take an equity stake in each and return capital after exit events such as IPOs, acquisitions or secondary sales.
Venture capitalists differ from buyout private equity firms in what they buy. A buyout fund takes control of a mature business, while venture capitalists take minority stakes in young companies and add strategic guidance, board seats and introductions to the company's development. Both sit inside the private equity asset class, and both charge management fees and carried interest.
- Most funds run 10 to 12 years, with a few years of extensions possible, per Wikipedia's venture capital entry.
- General partners charge annual management fees of 2% to 2.5% of committed capital.
- They also take carried interest, typically 20% of the fund's profits, the "20" in "2 and 20."
- VC is equity, so founders give up equity ownership and owe no monthly payments or interest to the capital providers.
Startups raise venture capital in funding rounds that follow a sequence. Seed investors "are normally the first institutional investors in a business," per Hamilton Lane, and later funding rounds run from Series A to Series B, C, D "and so on as needed." Angel investors often come before the seed round, and late stage funding can come from growth funds, corporations and crossover investors.
Global venture funding in 2026 by tracker
Four houses publish a global or U.S. total for 2026, and each counts a different universe. Through September 2026, the global totals run from $679 billion to $728.3 billion.
| Tracker | Q3 2026 | January to September 2026 | Scope |
|---|---|---|---|
| KPMG Venture Pulse | $170.9 billion, 8,341 deals | $728.3 billion | Global VC investment, PitchBook data |
| CB Insights | $187.2 billion | $698.3 billion | Global VC investments, CB Insights data |
| Crunchbase | $159 billion, close to 6,000 startups | $679 billion | Global venture and growth funding |
| PitchBook-NVCA Venture Monitor | $98.4 billion, about 5,012 deals | $515.8 billion | U.S. VC deal value only |
Copy these lines into an email, fill them in and send. I reply with scope and a price within 2 to 3 business days.
Open the email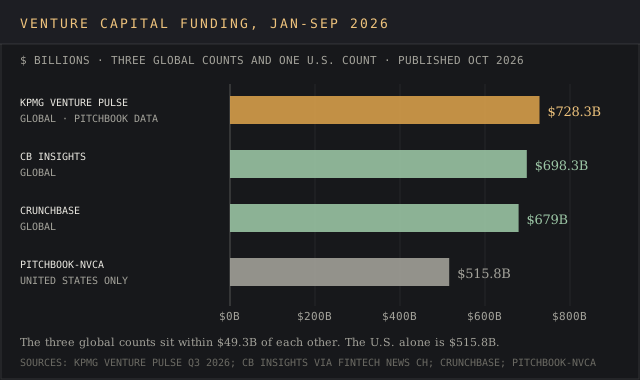
Crunchbase's Q3 total of $159 billion was down 25% from $212 billion in Q2 and up 53% from $104 billion a year earlier, per its 5 October report. U.S.-based companies raised $91 billion of it, about 57%, and a record 27 companies raised rounds of $1 billion or more, against 16 in Q2 and 14 in Q1. CB Insights' figures come via Fintech News Switzerland's report on its Q3 data.
KPMG's mid-year release put the first half at $560.4 billion, the highest first-half level in five years, and its 2021 full-year record at $750.9 billion. On that basis, 2026 needs about $22.6 billion more in the fourth quarter to set a new annual record on KPMG's count.
How each tracker's proprietary data changes the total
Each total comes from proprietary data with its own rules for what counts as a venture deal. Crunchbase counts venture and growth rounds into private companies. KPMG's Venture Pulse uses PitchBook data, so its U.S. Q3 figure of $98.4 billion across 3,626 deals matches the PitchBook-NVCA Venture Monitor's $98.4 billion. CB Insights runs its own deal database, and our company data providers ranking compares Crunchbase with the other vendors.
The deal counts differ more than the dollars. KPMG counted 8,341 global deals in Q3, while Crunchbase counted close to 6,000 funded startups. The U.S. deal count is 3,626 on KPMG's page and about 5,012 on the Venture Monitor, an estimate that includes deals PitchBook expects to log late. Seed and early stage rounds are reported with a lag, so every early total rises after publication.
The gap matters most for U.S. figures in 2025. Crunchbase puts U.S. VC investments at $274 billion, 64% of its global total. The NVCA 2026 Yearbook, built on PitchBook data, put U.S. deal value at $320 billion across 15,352 deals, and KPMG's Q1 2026 report put it at $321.6 billion. A $46 billion difference between two respected sources is normal, so quote the house with the number and check it against a second one, the core of data triangulation.
Totals also move after publication. Crunchbase first reported Q3 2025 global funding at $97 billion, per its Q3 2025 report. Its Q3 2026 report gives the same quarter as $104 billion, after late-reported deals were added. A figure quoted the week a report comes out is usually the lowest that quarter will ever read.
Venture capital funding in 2025
2025 was the third-largest year for venture capital investments on record, behind 2021 and 2022, per Crunchbase's year-end report. Venture and growth investors put $425 billion into more than 24,000 private companies, up 30% from $328 billion in 2024.
| Measure, 2025 | Figure | Source |
|---|---|---|
| Global venture funding | $425 billion, up 30% | Crunchbase |
| Global AI funding | $211 billion, up 85% from $114 billion | Crunchbase |
| U.S. venture capital investments | $274 billion, 64% of global | Crunchbase |
| U.S. VC deal value | $320 billion across 15,352 deals, up 51% | NVCA 2026 Yearbook |
| U.S. VC investment | $321.6 billion | KPMG Venture Pulse Q1 2026 |
| AI share of U.S. deal value | 65.4% | NVCA 2026 Yearbook |
| Global VC in Q4 2025 | $138.1 billion across 7,981 deals | KPMG Venture Pulse |
Roughly half of all global VC funding in 2025 went to AI, per Crunchbase, and OpenAI, Scale AI, Anthropic, Project Prometheus and xAI each raised more than $5 billion. The $425 billion is Crunchbase's global total for 2025, and its U.S. figure for the same period is $274 billion.
Venture capital funding history, 2021 to 2026
2021 remains the peak year on most counts, and 2026 is the first year since to challenge it. KPMG puts 2021 global VC investment at a record $750.9 billion. Crunchbase ranks 2025 third behind 2021 and 2022, and calls 2026's $679 billion through September the highest three-quarter total in its records.
| Year | Crunchbase (global) | KPMG (global) | PitchBook-NVCA (U.S.) |
|---|---|---|---|
| 2021 | Peak year | $750.9 billion, the record | Previous full-year record |
| 2024 | $328 billion | Not used here | About $212 billion, implied by 2025's 51% rise |
| 2025 | $425 billion, third-largest year | Third-highest year; Q4 at $138.1 billion | $320 billion across 15,352 deals |
| 2026, January to September | $679 billion | $728.3 billion | $515.8 billion, 44% above the 2021 full year |
The U.S. figure shows how far the market has moved in the past decade of data. U.S. deal value through nine months of 2026 already sits 44% above any full year the Venture Monitor has recorded, and 82.7% of it went to AI.
AI's share of venture capital investments
AI went from the largest sector to most of the market in under two years. Crunchbase counted $102 billion of AI funding in Q3 2026, 64% of the quarter's $159 billion. In the U.S., AI accounted for 82.7% of deal value through September on the Venture Monitor's count, up from 65.4% for all of 2025. Our AI statistics report covers adoption and spending outside venture.
Want a share chart like this for your own sector? Send the sector and the years.
Email a briefThe concentration shows up in deal sizes. KPMG counted 14 rounds above $1.5 billion in Q3 2026, nine of them in the U.S. Carolina Oliveira, global lead of emerging giants at KPMG International, said the market "continues to be quite bifurcated, with a lot of the investment going into top end deals." Startups outside AI face a more selective market, per the same release, and that's where most early stage companies sit.
Fintech companies also sit near the top of the private market. Revolut and Ramp, both fintech companies, sit among the ten most valuable unicorns on Crunchbase's board, which our Crunchbase review covers as a data source.
VC funding by region
The Americas took $101.2 billion of KPMG's $170.9 billion in Q3 2026, across 3,947 deals, and the U.S. alone $98.4 billion. The rest of the world split the remaining $69.7 billion.
- Americas: $101.2 billion across 3,947 deals.
- United States: $98.4 billion across 3,626 deals.
- Asia: $39.8 billion across 2,698 deals, down from $44.6 billion in Q2, including $27.2 billion in China.
- Europe: $28.4 billion across 1,497 deals, a sixteen-quarter high.
Crunchbase's Q3 report put the San Francisco Bay Area at 24% of global venture investment on its own. The local market in one metro area raised more than all of Europe on KPMG's count.
U.S. VC investments and the deal market
The U.S. venture market in 2026 is the largest on record by value. Deal value reached $515.8 billion through Q3, and the Q3 total of $98.4 billion came from about 5,012 deals. Nontraditional investors took part in roughly 30% of 2025 deals and accounted for 83% of investment value, per the NVCA 2026 Yearbook.
Corporate venture capital is the fastest-growing source. KPMG put CVC investment at $532.8 billion in the first nine months of 2026, already above the previous annual record. That figure counts every deal with a corporate investor in the round, so it overlaps with the headline totals and can't be added to them.
Unicorn companies hold much of the value created by those VC investments. The Venture Monitor counted 992 active U.S. unicorns worth a combined $5.7 trillion at the end of Q3 2026, up from 859 worth $4.34 trillion in the 2026 Yearbook's 2025 figures. For pricing on the database behind these figures, see our PitchBook pricing report.
How much venture capital firms raise
Venture capital firms, or VC firms, raise money in a separate market from the one where they invest it, and that market is far smaller. U.S. VC funds raised $108.5 billion from January to September 2026, against $515.8 billion of deal value. In 2025, they raised $67 billion across 585 funds, per the NVCA 2026 Yearbook.
- Funds of $500 million or more took 78.1% of 2026 capital while making up 6.0% of funds closed.
- Fourth-or-later funds from established managers took 88.2% of 2026 fundraising dollars.
- First-time funds numbered 81 through September 2026, about 4.5% of dollars, on pace for the lowest annual count in a decade.
- In 2025, 101 first-time funds closed, the lowest since 2011 and down 77.9% from 457 in 2021.
- The top ten funds of 2025 raised $22 billion, 32.9% of all VC capital raised.
The average 2025 U.S. venture fund works out to about $115 million, by our division of $67 billion by 585 funds. The median is lower, because the top ten funds raised a third of the money. Limited partners have put more capital into large, established VC firms, and new managers face a cold shoulder.
How venture capitalists exit and get paid
Venture capitalists need a liquidity event to return capital to their limited partners, and exits lag investment by years. U.S. VC-backed companies produced $217.1 billion of exit value across 1,463 exits in 2025, per the NVCA 2026 Yearbook, and secondary sales passed $100 billion.
Unicorns are the bottleneck. Of the 859 U.S. unicorns worth $4.34 trillion in the 2025 data, only 30 to 40 exited during the year. In Q3 2026, 18 venture-backed companies went public, per the Venture Monitor. An acquisition or an initial public offering remains the main exit, and most portfolio companies return less than the capital invested.
Hamilton Lane describes the strategy as one that seeks "to offset those losses with outsized returns from successful investments." That's the pattern people mean by the 80/20 rule in VC, with a few winners covering the losses on the rest.
Startup funding statistics by stage
Funding rounds have spread out in time. The median gap between a seed round and a Series A was 1.9 years in Q4 2025, across 9,843 rounds raised by U.S. startups on Carta, per Carta's data. Carta's analysis also shows that, across five to six years of its data, the share of priced seed rounds reaching Series A within two years has never been lower than for the 2022 and 2023 cohorts.
Crunchbase's Q3 2025 stage split gives a sense of scale for a normal quarter: $9 billion of seed funding across more than 3,500 companies, nearly $30 billion of early stage funding for more than 1,700 companies, and $58 billion of late stage funding. Early stage startups raise many small rounds, and late stage companies raise fewer, larger ones.
Pre-seed funding usually pays for a prototype and the first tests of market demand, and a seed round pays for the early team and the first attempt at product market fit. At Series A, investors expect founders to prove traction, and Series B onward pays for expansion into new markets.
Carta's figures for the last quarter of 2025 show the same pattern on cap tables. Startups on Carta raised $36.1 billion in Q4 2025 across 1,195 transactions, the lowest Q4 deal count this decade, per its State of Private Markets report. The average round size rose to $30.2 million from $19.3 million a year earlier, and less than 14% of new rounds were down rounds.
How investors make an investment decision
AI changes the price at every stage. Carta found that the median AI startup's Series A valuation ran 38% above the median for non-AI startups in 2025, and that 58% of all cash raised at Series D went to AI startups. Median Series B dilution fell from about 15% to 12.9%, so founders gave up less equity per round. Our dilution calculator runs the same math for a single round.
Carta found median Series B dilution fell from about 15% to 12.9%, so founders gave up less equity per round.
Median Series B dilution, 2025
Source: Cartae.g. dilution by stage in your market
Source: linked, checked, datedThe diligence process behind each round checks a company's financials, team and market potential before investors commit further investment. KPMG's Q3 release describes a market where startups outside AI face a more selective process, and Carta's graduation data shows fewer seed companies clearing the bar to a Series A. For emerging companies with a limited operating history, the investment decision rests on traction and the founding team more than on revenue.
How many startups fail
Government data gives the most reliable startup failure figures. The Bureau of Labor Statistics tracks every private-sector establishment born in a given year. Of those born in March 2015, 79.6% were still operating a year later, 50.2% after five years and 34.6% after ten, per its Business Employment Dynamics survival table.
- After 1 year: 79.6% survive, so about 1 in 5 startups fail in year one.
- After 5 years: 50.2% survive, so about half have closed.
- After 10 years: 34.6% survive, so 65.4% have closed.
- Later cohorts: 1-year survival ran from 76.3% for 2022 to 80.9% for 2020.
On the BLS count, about 65% of new establishments close within ten years. The series covers every private employer, from restaurants to technology startups, and no government series tracks venture-backed startups separately.
For the full small-business picture, our small business statistics report covers survival rates by industry, and the entrepreneur statistics report covers who starts a business and why.
Startup founder demographics
The average founder is older than the stereotype. A study of 2.7 million U.S. founders by Pierre Azoulay, Benjamin Jones, J. Daniel Kim and Javier Miranda found a mean age at founding of 41.9, rising to 45.0 for the fastest-growing 1 in 1,000 new ventures, per Kellogg Insight's summary. Founders of venture-backed firms averaged about 42.
Gender shows the widest gap in the venture data, and female founders see it in every round. Companies with at least one female founder raised a record $73.6 billion in 2025, 27.7% of U.S. VC deal value, per PitchBook's All In report. All-female teams raised $3.2 billion across 794 deals, while all-male teams raised $191.1 billion across 10,048, per WLRN's report on the same data.
- All-female teams raised $3.2 billion, about 1.7% of the combined total raised by all-female and all-male teams.
- Female-founded unicorns reached an aggregate valuation of $481 billion, a record.
- More than $30 billion of the 2025 female-founded total went to Scale AI and Anthropic.
That last point explains the gender gap in the headline. Two AI companies with mixed founding teams lifted the female-founded share to a record, while all-female founders raised 22% less than in 2024, per the same PitchBook report.
Job creation by venture-backed companies
Venture-backed companies employ far more people than their deal count suggests. An NVCA study prepared by IHS Global Insight in 2009 found that 11% of U.S. private sector jobs came from venture-backed companies and that their revenue equalled 21% of U.S. GDP. Those figures date from 2009.
The same NVCA work said that of nearly 2 million businesses created in the U.S. each year, only 600 to 800 get venture capital funding. Crunchbase counted more than 24,000 companies funded worldwide in 2025, and the NVCA Yearbook counted 15,352 U.S. deals, many of them follow-on rounds for the same companies.
Most small businesses never raise venture capital at all, and VC funding goes to the few startup companies chasing a national or global market.
Delivered for your site and your byline. Hosting here is optional.
Frequently asked questions
What is venture capital funding?
Equity investment by venture capital firms in startups with high growth potential, paid in exchange for an ownership stake. The startup owes no repayment, and investors earn a return only when the company is sold or goes public.
What percent of startups get funded?
A tiny percentage. An older NVCA estimate put it at 600 to 800 of nearly 2 million U.S. businesses created each year. Crunchbase counted more than 24,000 companies funded worldwide in 2025.
Is it true that 90% of startups fail?
The BLS puts the ten-year closure rate at about 65%, since 34.6% of private establishments born in 2015 were still operating after ten years.
What is the typical size of a venture capital fund?
The average U.S. fund raised in 2025 was about $115 million, from $67 billion across 585 funds. Funds of $500 million or more were 6.0% of 2026 closings and took 78.1% of the capital.
What is 2 and 20 in venture capital?
It's the standard fee structure, an annual management fee of about 2% of committed capital and carried interest of about 20% of the fund's profits, both paid to the general partners.
Is VC funding slowing down?
Funding by value is near a record. Global funding through Q3 2026 was $679 billion to $728.3 billion, already above every full year except 2021. Crunchbase's Q3 figure fell 25% from Q2, and first-time funds are on pace for a decade low.
How difficult is it to get VC funding?
Harder outside AI. KPMG describes a more selective market for startups outside AI, and Carta's data shows the 2022 and 2023 seed cohorts have the lowest two-year Series A graduation rates in its records.
What are the top 10 VC firms?
By investments in 2026's new unicorns, Crunchbase News ranked Sequoia Capital first, followed by Khosla Ventures, Y Combinator, Lightspeed Venture Partners, Founders Fund, Andreessen Horowitz, Bessemer Venture Partners, Lux Capital, General Catalyst and BoxGroup, in its 19 August 2026 analysis.
What is the success rate of venture capital?
Most portfolio companies return less than they raised, and a few outsized winners carry a fund. Hamilton Lane describes venture strategies as seeking to offset losses with outsized returns from successful investments.
Bottom line
Venture capital funding in 2026 is on course for a record on most counts: $679 billion to $728.3 billion globally through September, and $515.8 billion in the U.S. alone. AI took 64% of global funding in Q3 and 82.7% of U.S. deal value year to date.
The headline hides two thinner markets. Fundraising by venture capital firms reached $108.5 billion, a fifth of the money invested, and first-time funds are at a decade low. Quote the tracker and its scope with any venture capital figure, because the same quarter reads $159 billion on Crunchbase and $187.2 billion on CB Insights.
VC firms, accelerators and startup service providers publish reports like this one as lead magnets and LP material.
A report on your topic for a blog page, gated content or a lead magnet.
Written for your client and published under their brand, with my name left off.
Your report on marketintelligencetools.com, with 2 to 3 CTAs carrying your sponsored links.
Default terms: the report is yours to publish, and I keep the right to republish it on this site behind a gate, outside Google's index.
The research houses behind each venture figure, and the returns no one publishes yet
Global and regional totals: kpmg.com (Venture Pulse releases for Q4 2025, January 2026, mid-year 2026 and Q3 2026, October 2026), news.crunchbase.com (2025 year-end report, Q3 2025 and Q3 2026 reports, investor analysis of 19 August 2026) and CB Insights’ Q3 2026 data via letsdatascience.com.
U.S. deals, fundraising, exits and unicorns: nvca.org (PitchBook-NVCA Venture Monitor, Q3 2026; NVCA 2026 Yearbook). Rounds, timing and dilution: carta.com (State of Private Markets Q4 2025; time between rounds). Founders: businesswire.com (PitchBook All In report, 5 March 2026), wlrn.org and insight.kellogg.northwestern.edu.
Survival rates: bls.gov (Business Employment Dynamics establishment survival table). Fund structure and terms: hamiltonlane.com and en.wikipedia.org. The average fund size and the implied 2024 U.S. total are our calculations from NVCA figures.
Every figure was checked against its source on 17 November 2026. No house publishes fund returns for 2025 or 2026 vintages yet, and no government series counts venture-backed startups separately.