Financial Modeling Prep review: 20 free-key tests, a $19 to $99 plan ladder and the data errors users report
 By Jan Suski. I go deep on every review, checking every number against its source and digging up details other coverage misses, a habit from six years of SEO and link building for tech companies. Bylines at Surfer, Brand24, and Senuto. How the scoring works.
Best for
A developer, analyst or small fintech that needs US fundamentals and stock prices through an API at $19 to $99 a month, and can check the numbers it ships.
Not for
A team that wants to display the data in a product without a separate licence, or anyone who expects a refund after a bad first month.
What it costs
$0 for 250 calls a day, then $19, $49 and $99 a month billed annually ($29, $69 and $139 billed monthly). Display rights are quoted separately.
- Free plan
- 250 calls a day, 500MB a month
- Starter
- $19 a month billed annually, 300 calls a minute, US
- Premium
- $49 a month billed annually, 750 calls a minute, US, UK, Canada
- Ultimate
- $99 a month billed annually, 3,000 calls a minute, global
- Bandwidth
- Trailing 30 days: 20GB, 50GB, 150GB by plan
- Securities
- 70,000+
- Price history
- 30+ years of daily data
- Source of financials
- SEC EDGAR filings
- REST API
- One API key, sent as a query parameter or a header, returns JSON for every dataset.
- Financial statements
- Income statements, balance sheets and cash flow statements, each stamped with its filing date.
- API Viewer
- A no-code Playground that exports any dataset as JSON, CSV or plain text.
- Sheets and Excel add-on
- Pulls data straight into cells with the FMP, FMPPRICE and FMPFUNDS functions.
- MCP server
- Wraps the REST endpoints as 27 tools for Claude, Cursor and other AI clients.
- DCF valuation
- Returns a default discounted cash flow value, with a custom calculator on Premium.
- Analyst estimates
- Consensus price targets plus revenue and EPS forecasts for each ticker.
- Revenue segments
- Product and geographic revenue splits, back to 2011 for Amazon.
- Earnings transcripts
- 10+ years of call transcripts, unlocked on the Ultimate plan.
- WebSocket streams
- Live quote streams for US stocks, forex and crypto.
- Trustpilot
- 3.8 from 98 reviews, 23% one-star
- Vendor replies
- About 10% of negative reviews
- Support access
- Email and chat for paid plans only
- Refunds
- All sales final under the terms of service
- Display rights
- Separate Data Display and Licensing Agreement
EODHD
Not forA developer testing on a free tier first.
FactSet
Not forA solo developer or a small fintech on a monthly budget.
Massive (formerly Polygon.io)
Not forA fundamentals-first analyst on a tight budget.
Pairs well with FMP
Where FMP's own published numbers disagree with each other
FMP's homepage claims 70,000+ securities, while its ChatGPT for Financial Services announcement says more than 100,000 securities in over 40 countries. The homepage says "Trusted by +1000 businesses" and the commercial pricing tab says 100,000+ customers.
The trust center lists SOC 2 Type I and Type II, while an FMP article updated in March 2026 refers to a Type 1 report only. This review uses the homepage security count and asks buyers to request the current SOC 2 report.
Financial Modeling Prep is a financial data API sold to people who prefer writing code to paying for a terminal. FMP lists 70,000+ securities, 30+ years of daily stock prices and 100+ endpoints on its homepage, behind four self-serve plans that top out at $99 a month billed annually. The operating company is Utradea Inc., per FMP's trust center.
This review covers what the plans buy, what a free API key returns, how the fundamental data compares against a company's own filing, and the refund and endpoint disputes that drag FMP's Trustpilot score down. I ran 20 calls on a free key on 16 October 2026 and checked Apple's financials against Apple's own earnings release. Feature claims are a dime a dozen on data-API sites, so every number below traces to a call I ran or a page FMP publishes.
It's written for developers, quant hobbyists, analysts building a model in a spreadsheet, and small fintech teams pricing their first data provider. Enterprise desks comparing FactSet or LSEG seats will find the price gap here and the licensing catch that comes with it.
Why now: FMP data started appearing inside ChatGPT for Financial Services in September 2026, its MCP server plugs the API into AI assistants, and the August 2026 complaints about legacy endpoints show what happens to a paid plan when the company changes its routes.
↑ FACT SHEETWhat Financial Modeling Prep is, and what FMP stands for
FMP stands for Financial Modeling Prep. The product is a REST data API with a JSON response for nearly every dataset.
FMP's API spans a broad range of datasets, and the developer docs group them into company information, quotes, financial statements, charts, analyst estimates, an earnings calendar, SEC filings, Form 13F, insider and Senate trades, ETF and mutual fund holdings, forex, crypto, commodities, economics and ESG.
Every financial data API call returns financials as JSON with a filing date and an accepted date on each period, so a model can track when a figure became public. Authentication is one API key, appended as ?apikey= or sent as a header. A developer with a key can hit the ground running on the first request.
Four other surfaces sit on top of FMP's API. The API Viewer, also called the Playground, pulls data without code and exports it as JSON, CSV or plain text, according to FMP's API Viewer guide, so a balance sheet or a stock performance chart lands in a spreadsheet in just a few clicks. An Excel and Google Sheets add-on adds FMP, FMPPRICE and FMPFUNDS functions. WebSocket streams cover US stocks, forex and crypto.
FMP's MCP server
The fourth surface sets FMP apart in this price band. Its MCP server wraps the REST endpoints as 27 tools, per the 27 March 2026 changelog, that Claude, Cursor and other AI clients call directly. It runs on the free key, and each AI request counts toward FMP's API limits. That's more tools than FactSet's MCP server at 24 and AlphaSense's at 2, with no seat contract to sign first. Our MCP tools list tracks the other finance servers.
Since 10 September 2026, FMP says selected datasets also run inside ChatGPT for Financial Services, which answers the "can ChatGPT do financial modelling" question in part: it can now pull the statements a model needs.
FMP's three starter prompts, run on a free key
FMP's welcome email for the MCP server suggests three prompts. I ran all three through the free key on 16 October 2026, and all three returned data.
Free cash flow for Microsoft, Amazon and Google. Over the last three fiscal years Alphabet grew from $69.5B to $73.3B (+5%), Microsoft fell from $74.1B to $67.0B (-10%), and Amazon fell from $32.2B to $7.7B (-76%) as capital spending hit $131.8B.
Building that capacity cost an arm and a leg, and the free cash flow line carries the bill. One catch: FMP subtracts gross capex, while Amazon's own Q4 2024 release nets out $5.3B of property sales and incentives, so Amazon reports $38.2B for 2024 where FMP shows $32.9B.
Amazon revenue by segment. From 2021 to 2025, AWS rose from $62.2B to $128.7B and advertising from $31.2B to $68.6B, both more than doubling, while online stores grew 21% to $269.3B. The free key returned 15 years of segments, back to 2011, past the 5-year cap on statements.
Tesla price targets against the price. The consensus target came back at $441.36 (median $435, range $157 to $840) against a $367.90 quote stamped 14:02 UTC, about a minute old, putting consensus 20% above the price.
↑ FACT SHEETPricing: what each plan buys and the limit that binds
All four self-serve prices sit on the pricing page, which earns the 85 on price transparency. The 15 points it loses are the Build and Enterprise tiers, priced by a sales call.
| Plan | Annual billing | Calls | Bandwidth, 30 days | History | Coverage |
|---|---|---|---|---|---|
| Basic | $0 | 250 a day | 500MB | 5 years | US |
| Starter | $19 a month | 300 a minute | 20GB | Up to 5 years | US |
| Premium | $49 a month | 750 a minute | 50GB | Up to 30 years | US, UK, Canada |
| Ultimate | $99 a month | 3,000 a minute | 150GB | Full history | Global |
Starter adds annual financials and ratios, news, crypto and forex. Premium adds full financials and ratios, intraday charts, technical indicators, corporate calendars and the custom discounted cash flow calculator. Ultimate adds earnings call transcripts, 13F holdings of institutional investors, ETF and mutual fund holdings, 1-minute charts and bulk delivery.
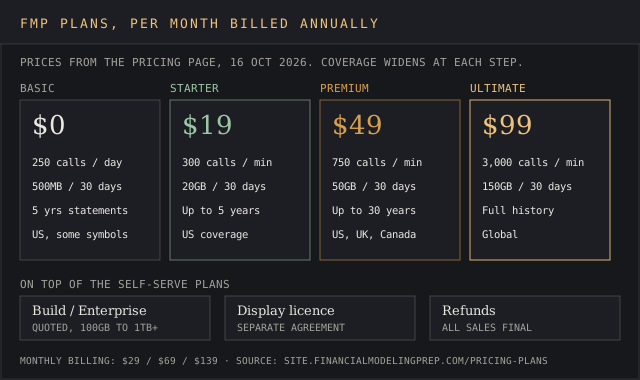
The devil's in the details, and the detail here is bandwidth. Every plan carries a trailing 30-day cap, enforced since 24 February 2025 per the changelog, and capacity only returns as old usage ages out, per FMP's own limit guide.
Downgrading has its own trap, because the 30-day window keeps counting usage from the bigger plan.
Since 21 May 2026 the dashboard also sells add-ons for extra bandwidth and API calls, per the changelog, so a plan can flex without a full upgrade. A French reviewer in September 2026 summed up the pricing: "The pricing is fair and transparent, data coverage is very good" (Julien Genini, Trustpilot).
Coverage is the second limit on FMP's market data. A Starter key reads US companies only, so anyone researching London or Toronto listings has to bite the bullet and pay for Premium, and India's NSE sits in the global Ultimate tier. So, can you get NSE data through an API here? Yes, at $99 a month billed annually.
That thread's original poster had paid about $200 a year before the plan restructure and priced the new ladder this way: "The future STARTER plan covers only US data and 5 years of historical data. For 588$ / year, I get UK and Canada coverage and 30 years of historical data. For 1188$ / year (!!), I get global coverage" (u/rpedrosb, r/ValueInvesting).
↑ FACT SHEETThe free plan, tested: 20 calls on a free API key
Is the Financial Modeling Prep API free? The Basic plan is, at 250 market data requests a day per the FAQ. The API key sits on the account dashboard after sign-up, which answers the "where do I find my FMP API key" question in one screen.
I connected the free key to FMP's MCP server and ran 20 calls on 16 October 2026. Twelve returned data and eight were refused with a message naming the plan required.
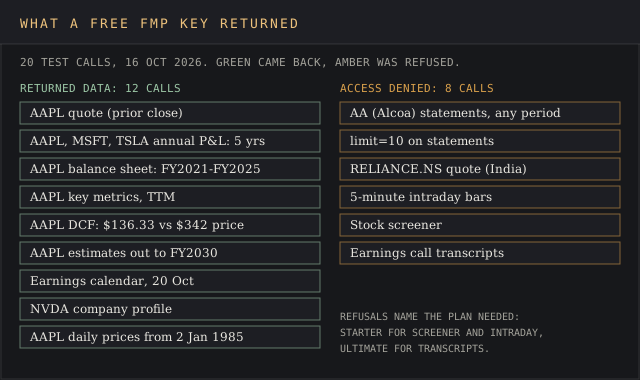
What came back: the AAPL quote, five years of annual financials each for Apple, Microsoft and Tesla (fiscal 2021 to 2025 for Apple), AAPL's balance sheet, TTM key metrics, analyst estimates, the earnings calendar for 20 October, NVIDIA's company profile, and daily AAPL price data reaching back to 2 January 1985.
Each statement carried its filing date and accepted date, and Apple's FY2025 financials showed a filing date of 31 October 2025. That last price result shows the 5-year cap on Basic applies to statements, while daily stock prices run the full 30+ years of historical data. For a backtest on Apple, Microsoft or Tesla, the free key covers the lion's share of the price history a hobbyist needs.
What was refused: any of the financial statements for Alcoa (ticker AA), a US company, even though the FAQ describes the free plan as "up to 5 years of annual statements for US companies." A limit=10 parameter on statements, a quote for RELIANCE.NS, 5-minute intraday bars and the stock screener all needed Starter, and earnings call transcripts needed Ultimate. The free tier covers a curated list of symbols, and the FAQ doesn't say which ones.
The discounted cash flow endpoint returned a $136.33 fair value for AAPL against a $342 share price. That's a mechanical model with default assumptions, useful as a data point and a bad basis for investment strategies on its own.
Data quality: Apple's financials checked against Apple's filing
FMP says fundamental data comes from the SEC's EDGAR site, and its FAQ adds that data taken from 8-K filings "is not as reliable or as full as the data from their 10-Q." I compared FMP's AAPL financials with Apple's fiscal 2025 earnings release.
| Line, $ millions | Apple's release | FMP |
|---|---|---|
| FY2025 revenue | 416,161 | 416,161 |
| FY2025 operating income | 133,050 | 133,050 |
| FY2025 net income | 112,010 | 112,010 |
| FY2025 total assets | 359,241 | 359,241 |
| FY2025 other income/(expense) | (321) | +321, sign flipped |
| FY2024 other income/(expense) | 269 | -269, sign flipped |
The headline lines of the income statement and balance sheet match to the million. FMP's nonOperatingIncomeExcludingInterest field carries the opposite sign in both years, while FMP's totalOtherIncomeExpensesNet field gets both right. An investor or analysts running a stock market screen that sums non-operating income across the S&P 500 would pick up that error without warning. Close but no cigar, and it lines up with what the critical reviews describe.
The same r/ValueInvesting poster, who used FMP's paid plan for his own screening, reached the same split in 2025:
"From my experience, data quality was acceptable for most US companies especially for the "main" lines in the financial statements (e.g. revenue, EBIT, total assets, etc). [...] Neverthrless, I noticed a degradation in many financial statements for FY2024 (many lines were 0)."
u/rpedrosb, r/ValueInvesting, 2025
Users who checked the data against filings report better results. A UK reviewer in August 2026 wrote: "I've verified their split-adjusted historical data against primary sources myself and it held up" (Oleksandr R., Trustpilot). A US user in November 2025 compared FMP with two rivals by name:
"Data quality in fundamentals and earnings is more consistent than any of the retail-targetted competitors that I've tried, e.g., Polygon-Massive/AlphaVantage. [...] if you find an issue in the data, you let them know and it's fixed very quickly."
So, is the FMP API reliable? For headline financial statements on large US caps, my check says FMP's financial data holds up. For derived fields, smaller tickers and anything you'd publish, plan on a validation layer, which is the 55 on data accuracy. Corrections go through a bug ticket in the site chatbot, per the FAQ, and that chatbot sits behind a paid plan.
Using FMP data to prepare a financial model
The site name invites the question of how to prepare financial modeling work with it. To cut to the chase, FMP supplies the inputs and you build the model.
A three-statement model links the three financial statements: income statement, balance sheet and cash flow statements, so a change in one flows through the others. FMP supplies the historical data that grounds the forecast of future performance from past performance: five years of annual financials free, quarterly and TTM statements on paid plans, plus key metrics and financial ratios like ROE and free cash flow yield. Net present value comes from your own forecast.
The same financials feed financial analysis of liquidity: current assets, current liabilities and cash all come back in one balance sheet call, and our working capital calculator turns them into current and quick ratios.
Good practice keeps inputs, calculations and outputs on separate tabs, states each assumption in one cell, and checks that the balance sheet balances every period. Valuation then runs three ways: a discounted cash flow, comparable companies and precedent transactions. Sensitivity analysis moves one assumption at a time, and scenario analysis moves several together, so analysts see which inputs swing the result.
FMP's add-on pulls the raw figures into Sheets or Excel. The judgment calls stay with you, which is why the AAPL DCF above reads $136. Putting all your eggs in one basket with a default DCF would value a $342 stock at $136. For a quick check on the outputs, our enterprise value calculator takes the same balance sheet inputs.
↑ FACT SHEETLegacy endpoints, refunds and the support team
Customer feedback on plan changes drags FMP to a 3.8 on Trustpilot from 98 reviews, with 64% five-star and 23% one-star. On 7 April 2025 FMP refactored plan access to enforce "previously unenforced limits," and on 27 August 2025 it removed legacy endpoints from the public docs, per the changelog. Long-time subscribers felt both changes.
Replying on Reddit in 2025, FMP's own account told one of them that "you will retain access to the legacy endpoints for as long as your subscription remains active" and that FMP would "honor our legacy pricing" (FMPAPI, r/ValueInvesting).
The critical reviews repeat six complaints: wrong figures ("Unless you like 95% accuracy"), an annual Starter plan that lost NSE data on 11 August 2026 and got "no refund", features lost in the move to stable endpoints ("I lost access to Transcripts and TTM financials"), a bandwidth cap that blocks bulk history ("it costs me 26G"), downgrades locked "for days or weeks", and quotes running "6–10 minutes" behind.
A refused refund is a bitter pill to swallow on an annual plan, because the terms of service say "All sales are final," and cancelling a subscription only stops the next renewal.
Refunds do happen case by case. A Polish user raised his rating in August 2026 after "Support reached out quickly, handled the case professionally, and issued a full refund to my card" (Szymon Piastowki, Trustpilot).
Support access depends on the plan. On a free account, FMP's support block reads: "Customers with paid plans can log in and email or chat with us." Free users get the public contact form and the info@ address, so a free-tier tester who finds a data error can't open a chatbot ticket. FMP publishes no response-time target, and Trustpilot records it replying to about 10% of negative reviews, typically within a week. The happy users describe a fast support team:
"The support team is incredibly responsive, usually resolving any data issue within a few hours."
Jeffrey Tidd, Trustpilot, June 2026
The cheap way to cut your losses: buy one month at the monthly price ($29 for Starter) before committing to a year, and keep your code on the current /stable/ routes.
Licensing, security and who can show the data
The self-serve plans cover personal use only. The terms limit use to "personal, non-business and non-commercial purposes," and the pricing page says "Displaying or redistributing data sourced from FMP requires a specific Data Display and Licensing Agreement with FMP." A business that shows stock prices in its app needs that agreement, which is why fit for a product that displays the data scores 30: the cost is a sales quote, and the $19 to $99 prices stop applying.
The same agreement covers displaying financials, prices or estimates through Enterprise data services. Speed is licensed too. FMP markets real time stock prices, and its FAQ adds that real-time or delayed access "may be subject to additional agreements with the relevant exchange."
On security, the trust center lists SOC 2 Type I and Type II covering security, availability and confidentiality, with reports behind an access request. An FMP article updated in March 2026 still refers to a Type 1 report only, so procurement teams should ask for the current report before they jump the gun on a contract.
FAQ
How much does Financial Modeling Prep cost?
$0, $19, $49 or $99 a month billed annually, or a monthly subscription at $29, $69 and $139. Build and Enterprise plans are quoted.
What company is FMP?
Financial Modeling Prep, and FMP's data services, are run by Utradea Inc., per its trust center. KPMG, Societe Generale and RBC Capital Markets appear among the customer logos on its homepage.
Is FMP data free?
Partly. The free plan gives 250 calls a day on a limited set of US symbols, with five years of annual financials and full daily price history for the symbols it covers.
↑ FACT SHEETFinancial Modeling Prep vs alternatives
Three financial market data APIs sit in the same price band, and one enterprise data provider with full data services sits far above it. Our financial data providers ranking, where FMP sits at #3, and the market intelligence API ranking cover the wider field.
EODHD
EODHD charges $99.99 a month for its all-in-one plan with 100,000 calls a day, and its fundamentals and financials feed costs $59.99 alone. It wins for non-US coverage at that price, with 150,000+ tickers across global exchanges. FMP wins on the $19 entry point and the free tier (EODHD's free plan allows 20 calls a day).
One Swedish reviewer who moved over in June 2024 wrote that EODHD fixed a data problem "systematically almost immediately" while FMP "would fix the specific ticker you reported.. after a few days" (Shan, Trustpilot).
Massive (formerly Polygon.io)
Massive sells stocks plans at $29, $79 and $199 a month, with financials and ratios only on the $199 tier or as a $29 add-on. It wins for real time data, streaming stock prices and trading infrastructure. FMP wins for anyone who needs fundamental analysis on a budget, since its fundamentals start at $19.
Alpha Vantage
Alpha Vantage allows 25 free requests a day and starts premium at $49.99 a month for 75 requests a minute. FMP's free tier gives 10 times the daily calls, and its $49 Premium plan gives 10 times the per-minute rate. Alpha Vantage wins on simplicity for a weekend project that needs a little market data. For daily screening, 25 calls are a drop in the bucket.
The Reddit poster who tested it as an FMP replacement wrote: "I started playing a bit with AlphaVantage but data quality problems were evident. I scanned the financials for Novo Nordisk and apparently PPE for 2024 is "0"" (u/rpedrosb, r/ValueInvesting, 2025).
FactSet
Our FactSet review puts a realistic seat at $14,000 to $22,000 a year, which is roughly 12 to 18 years of FMP Ultimate. FactSet wins where a bank's analysts need audited financials coverage under a negotiated enterprise contract. For an AI workflow, compare FactSet's MCP server with FMP's 27 tools, covered above. The FactSet vs Bloomberg comparison covers the terminal tier, and our LSEG review the other enterprise option.
Verdict
Buy it if you're one of the developers, students and small fintech teams who want financial data on a budget: US fundamentals, stock prices and an earnings calendar through one API key at $19 to $99 a month. My free key returned Apple's financials matching Apple's release on the first call, and a reviewer who scanned "hundreds of large caps" said it "takes seconds, not minutes" (John Pondis, Trustpilot, July 2026).
Another put the value plainly: "They figured out how to give global data coverage at an affordable cost and an acceptable rate limit" (Abdullah AlJasser, Trustpilot, September 2026).
Skip it if you publish figures without checking them, run a product that displays the data without the separate licence, or can't absorb a no-refund annual plan.
The elephant in the room is data quality. The flipped sign in Apple's non-operating income, the 23% one-star share and the August 2026 NSE cut-off all point the same way.
Consider it with caveats as an investor building a watchlist or a research team running data driven decisions on market performance across sectors, provided you pay monthly first, pin code to the stable routes, budget bandwidth for bulk history pulled on demand, and treat FMP as the raw feed for its own data quality checks and insights.
The scores at the top of this review rest on those findings: 90 for a first useful call in minutes, 85 for four public prices, 85 for a solo developer who can start at $0 and scale to $19, 55 for a sign error in both Apple years I checked plus the user reports, 35 for the no-refund terms and 30 for display rights that need a quote.